
Key risk events today:
China Manufacturing PMI and Non-Manufacturing PMI; Canada Inflation; US Core PCE Price Index m/m and Personal Spending m/m; Chicago PMI; US Revised UoM Consumer Sentiment.
(Previous analysis as well as outside sources – italics).
EUR/USD:
Despite a brief spell north of 93.50, the US dollar index resumed downside Thursday, positioning 93.00 on the radar. US unemployment claims totalled 1.434 million, according to the Labour Department, while economists polled by Dow Jones anticipated claims to rise to 1.45 million. Real US gross domestic product (GDP) also decreased at an annual rate of 32.9% in the second quarter of 2020, as per the Bureau of Economic Analysis.
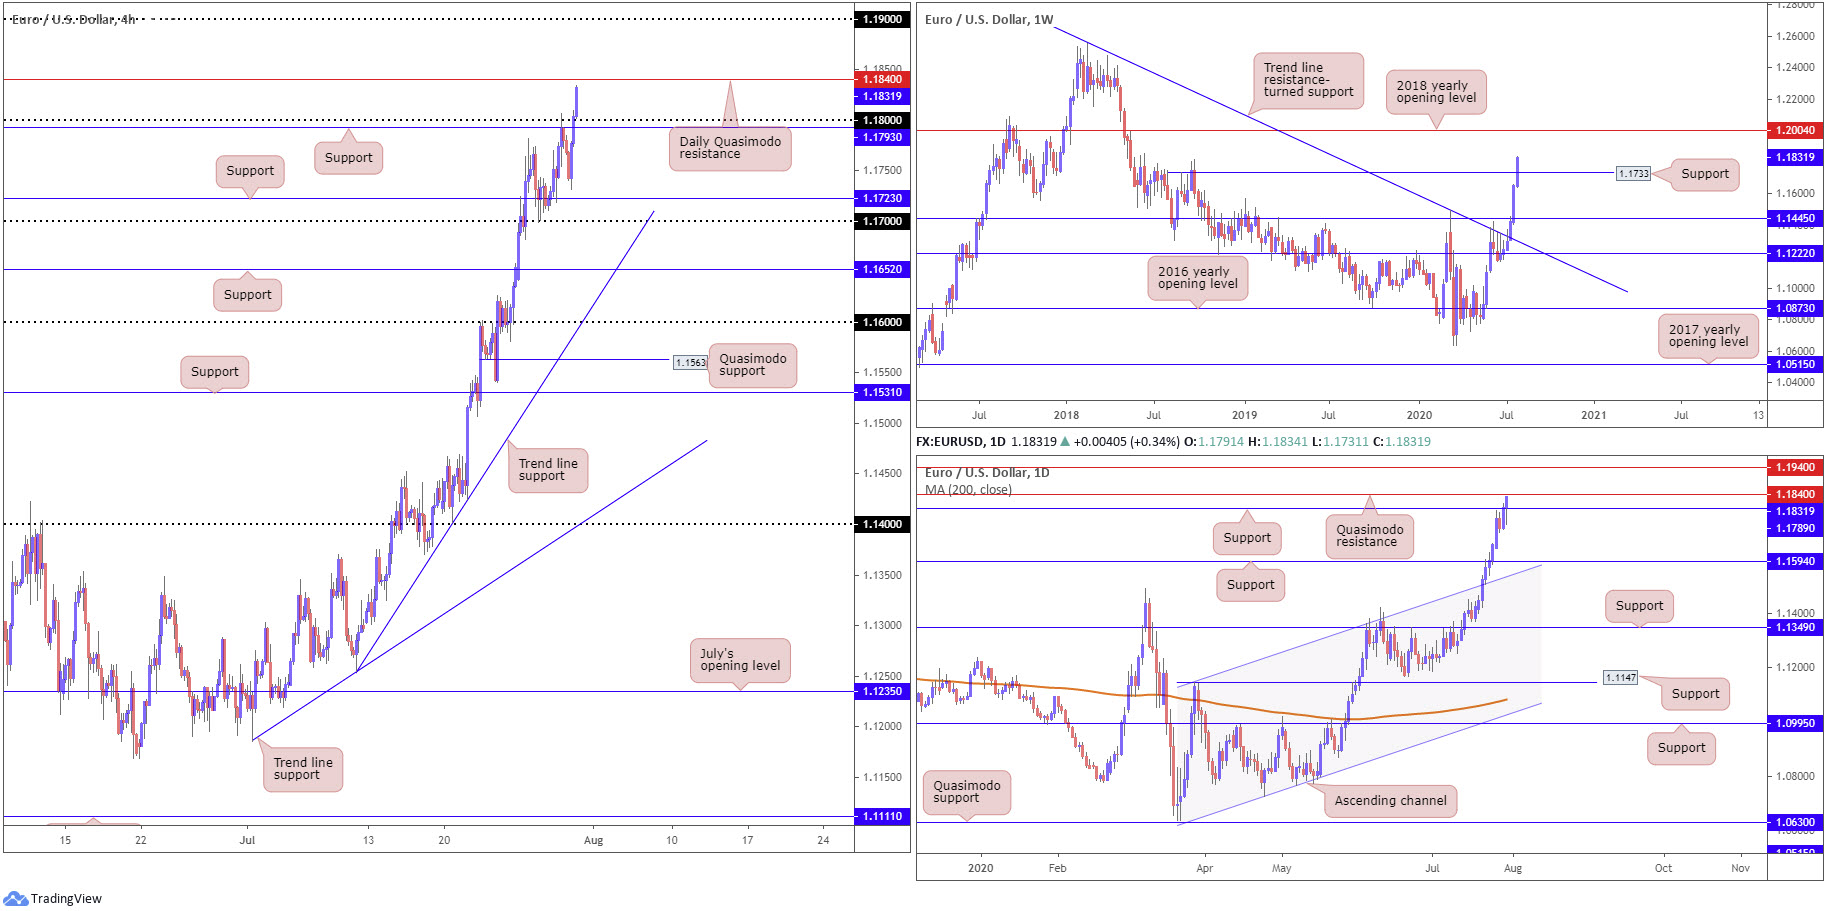
EUR/USD movement opened Thursday at 1.1791 and, after fleeting moves to lows at 1.1731, extended higher heading into US hours. Quasimodo resistance based on the H4 timeframe at 1.1793, as well as the round number 1.18, succumbed to upside pressure, consequently throwing daily Quasimodo resistance in the frame at 1.1840, after, of course, splitting daily resistance at 1.1789 (now a serving support).
Higher up on the curve, weekly price recently defeated Quasimodo resistance at 1.1733 (took out the Quasimodo head at 1.1815, the September 24 high [2018]). This leaves the path north reasonably clear to the 2018 yearly opening level at 1.2004.
Areas of consideration:
The break of weekly trend line resistance (July 13), taken from the high 1.2555, and violation of the 1.1495 March 9 high, reflects a long-term (potential) technical trend change.
Higher timeframe (technical) eyeballs will likely be on the daily Quasimodo resistance mentioned above at 1.1840, which could, of course, hamper breakout buying north of 1.18 on the H4 today.
In line with a potentially brewing long-term uptrend, a violation of daily Quasimodo resistance today highlights possible buying towards daily resistance at 1.1940. Though before reaching the latter, H4 buyers above 1.1840 will be watching 1.19 to enter some resistance.
GBP/USD:
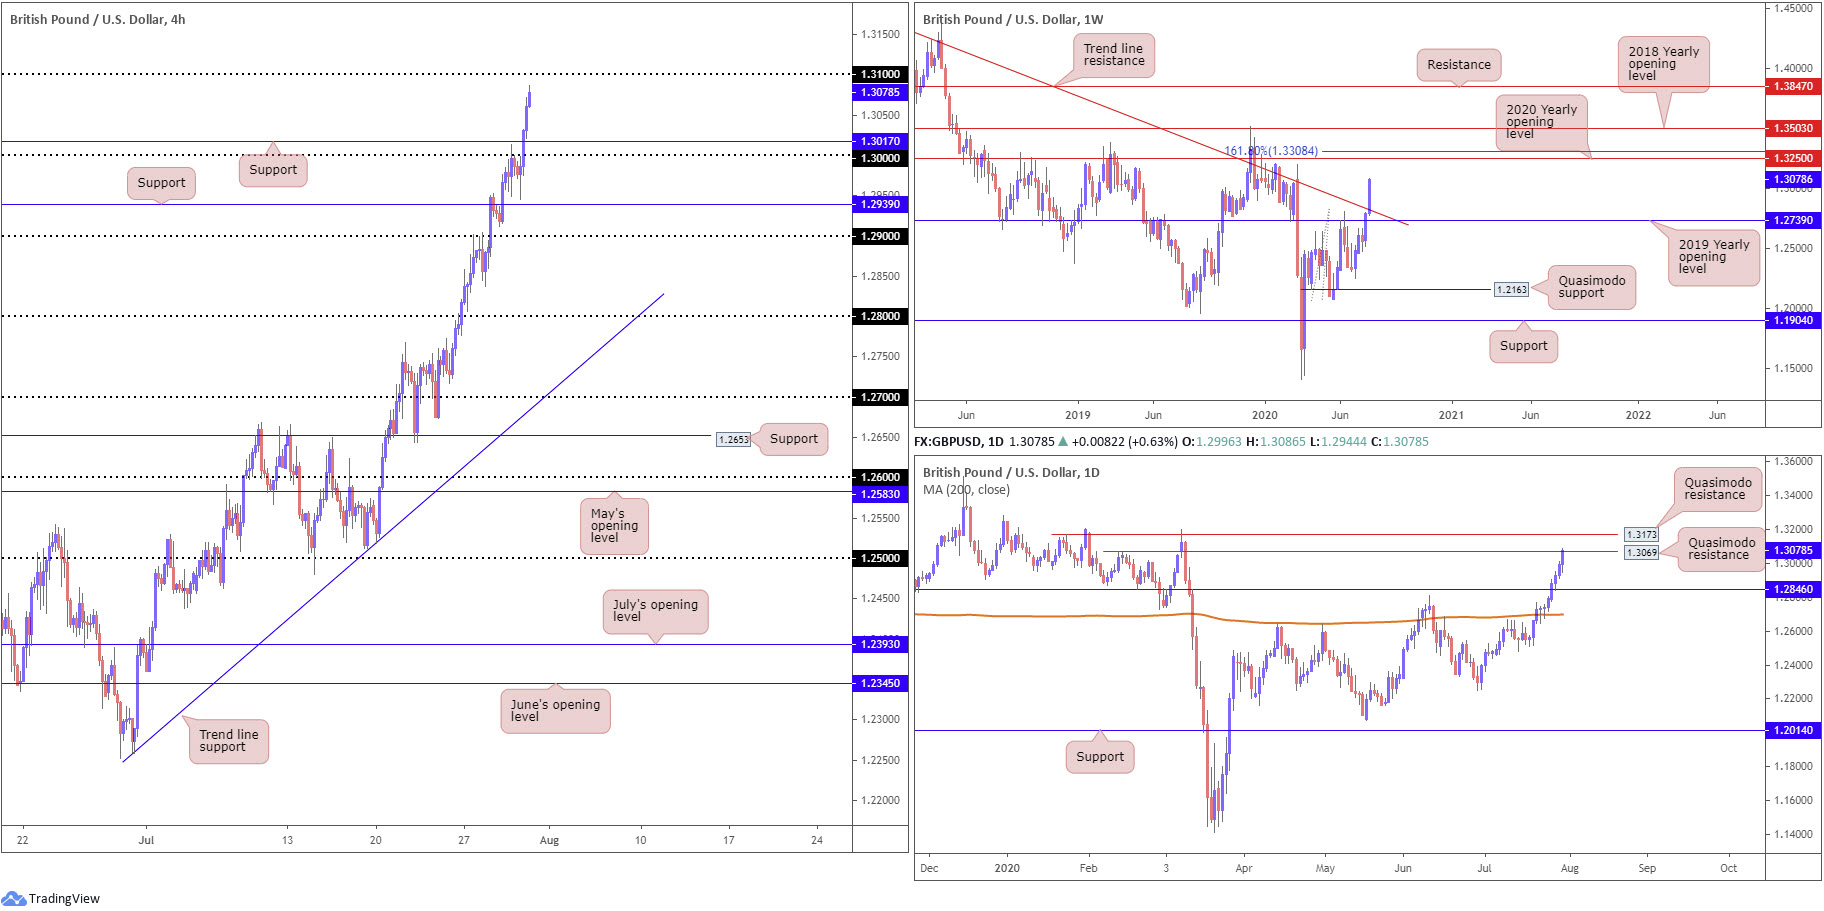
Sterling recorded a tenth consecutive daily gain on Thursday, receiving strong tailwinds amid broad USD weakness. After the US dollar index failed to sustain gains above 93.50, the DXY dropped to fresh 26-month lows ahead of the 93.00 handle, consequently lifting GBP/USD above the key figure 1.30 on the H4 timeframe, as well as Quasimodo resistance at 1.3017 (now serving support).
Weekly flow, after engulfing long-term trend line resistance, extended from the high 1.5930, earlier in the week, could see the 2020 yearly opening level at 1.3250 potentially call for attention, followed by a 161.8% Fibonacci extension point at 1.3308.
A closer reading of price action on the daily timeframe, thanks to the recent pop above 1.30, reveals the unit crossing swords with Quasimodo resistance at 1.3069, with a break exposing another layer of Quasimodo resistance plotted at 1.3173.
Areas of consideration:
The recent trend line resistance break on the weekly timeframe, despite the 1.3514 December 9 high (2019) still intact (a break of here also signals trend change to the upside), may have long-term traders consider long positions.
Daily Quasimodo resistance at 1.3069 could hinder upside to the 1.31 handle on the H4, and could, therefore, represent an initial take-profit target for those long north of 1.30. However, the dip from 1.3069 is unlikely to be anything to write home about, given the weekly timeframe’s current position.
A dip back to the 1.30 region will likely be a welcomed sight for dip-buying. Failure to pullback, however, buyers may be watching for a break of 1.31 for possible bullish scenarios to daily Quasimodo resistance at 1.3173.
AUD/USD:
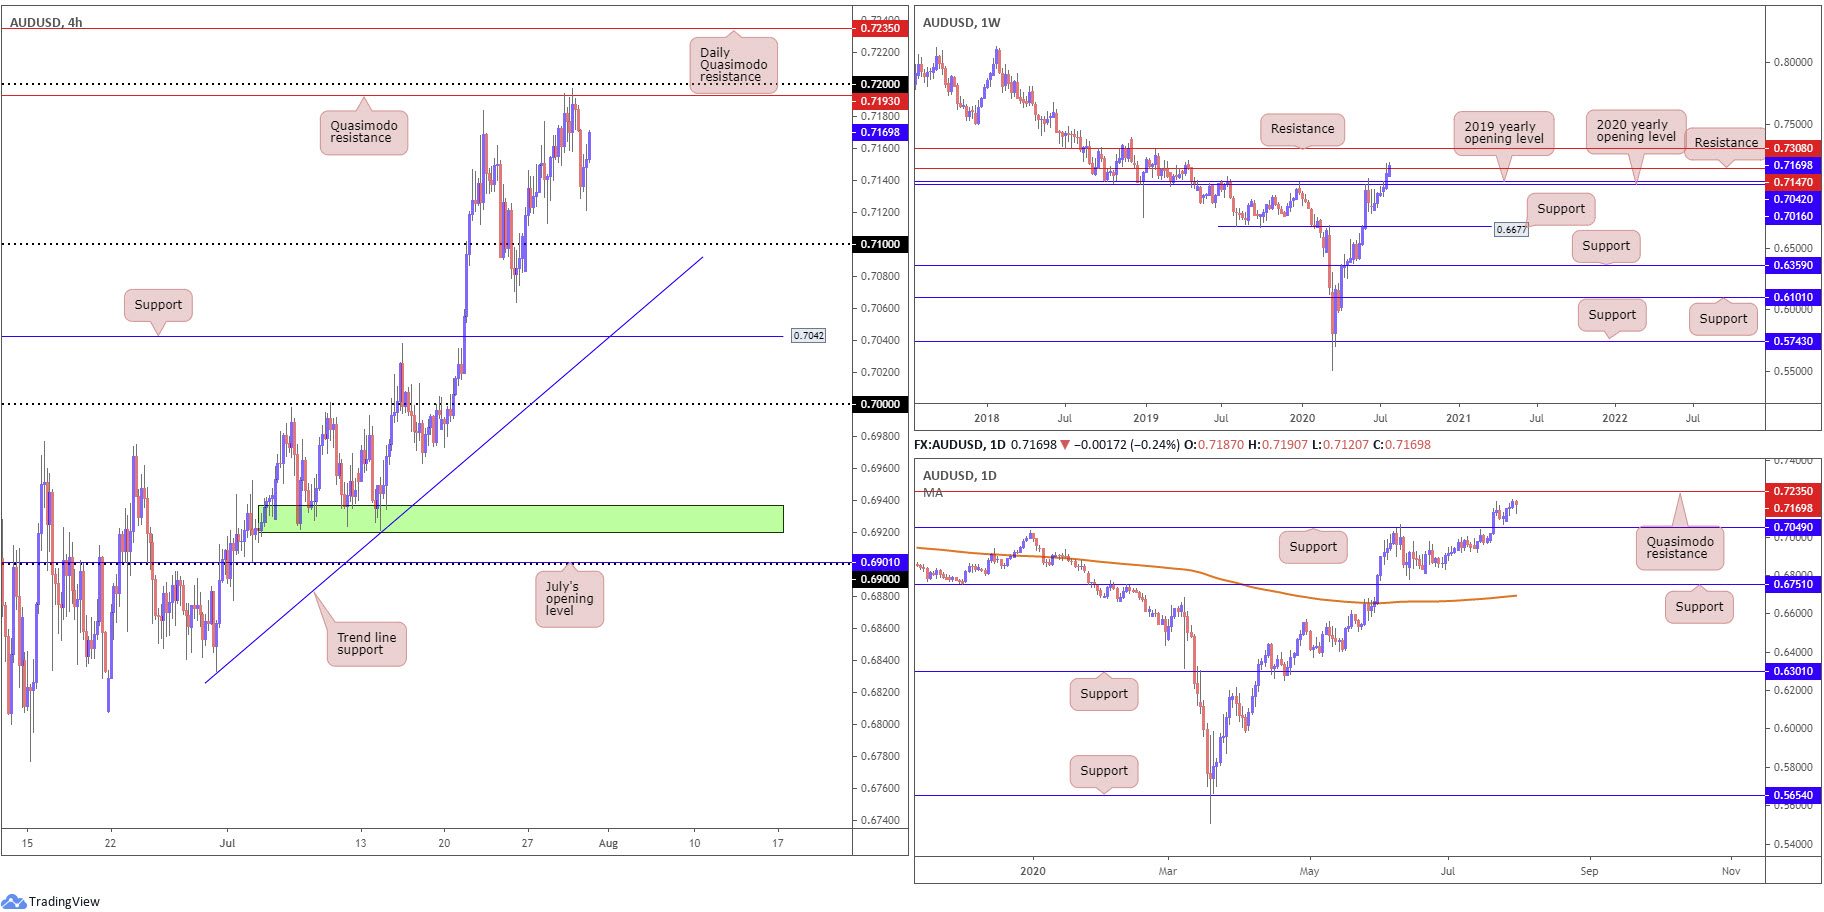
Risk aversion, along with further deterioration in the US dollar index, directed AUD/USD southbound sub H4 Quasimodo resistance at 0.7193 (sited below the 0.72 handle) on Thursday, probing lows as far south as 0.7120. Going into US hours, though, risk sentiment twisted north and, as you can see, hauled the risk-sensitive Australian dollar higher along with it.
Buyers and sellers on the weekly timeframe continue to battle for position around resistance at 0.7147, with a decisive breach here potentially setting the stage for additional upside towards resistance at 0.7308. Meanwhile, movement on the daily timeframe demonstrates room to advance until reaching Quasimodo resistance priced in at 0.7235.
Areas of consideration:
The current uptrend favours buyers. The break of the 0.7031 December 30 high (2019) visible on the weekly timeframe shows this.
With that in mind, and noting yesterday’s action on the H4 failed to reach 0.71, are we still looking at a run through orders at 0.72 on the H4 timeframe towards daily Quasimodo resistance at 0.7235? While the latter sits as an initial upside target; buyers will also likely target the 0.73 handle and, of course, weekly resistance at 0.7308.
USD/JPY:
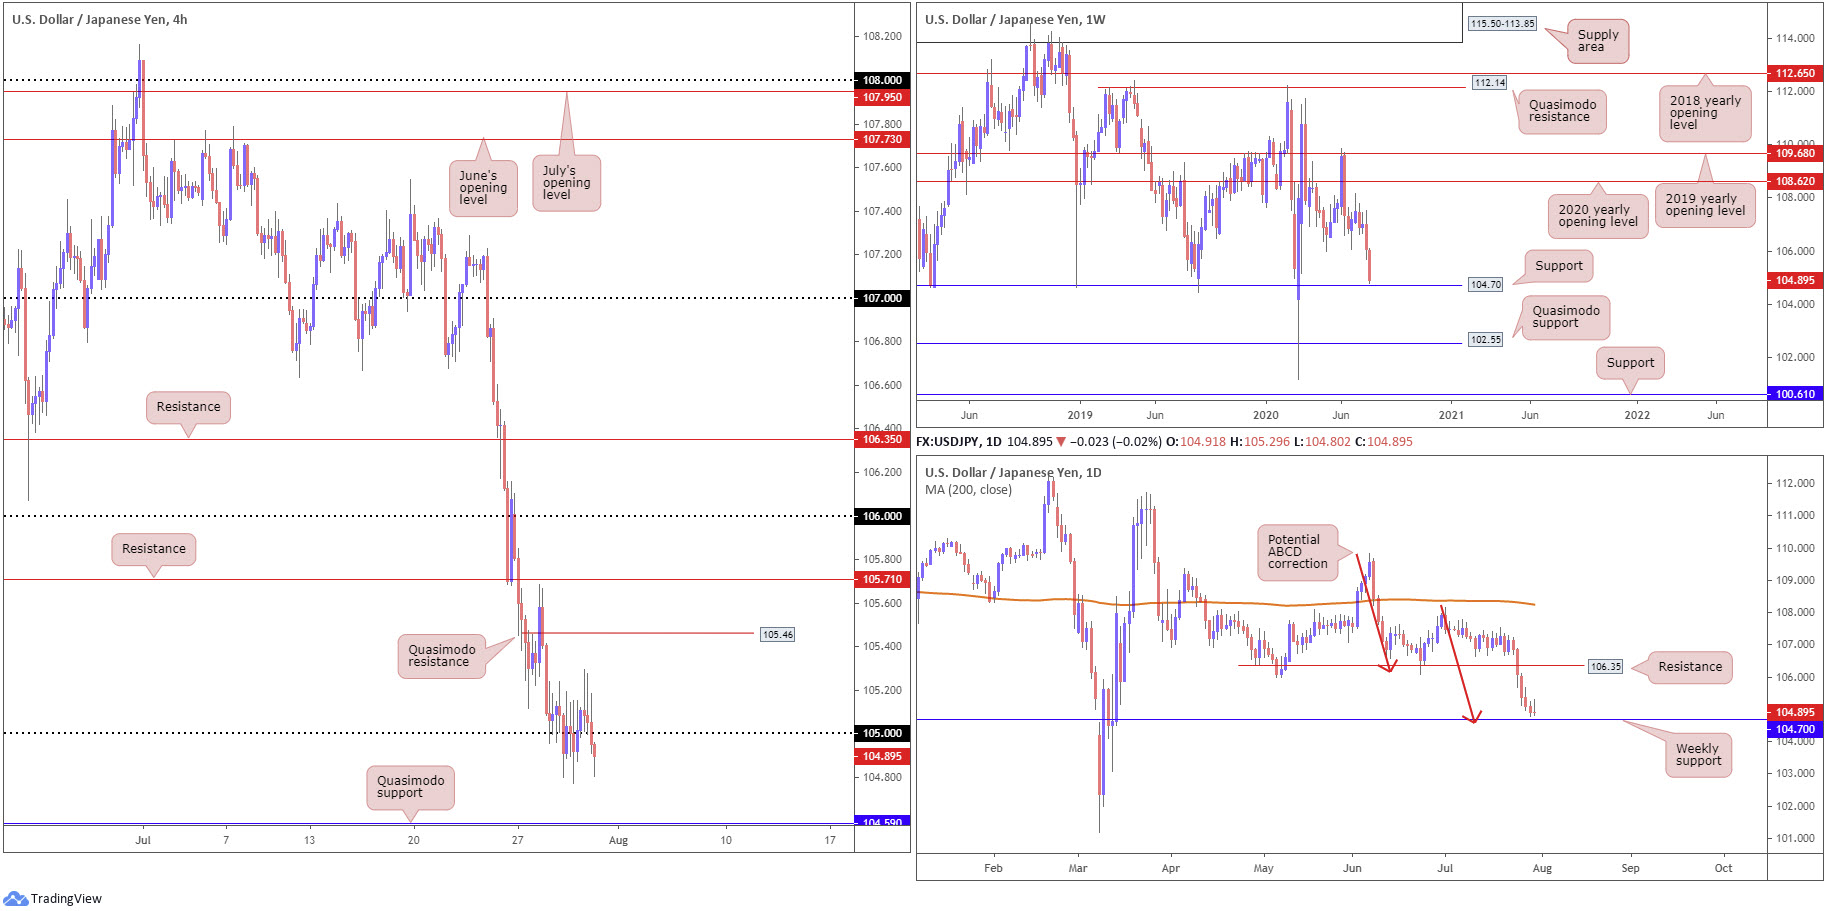
Trade concluded sharply off best levels Thursday, weighed by persistent USD softness. USD/JPY, based on the H4 timeframe, continues to absorb buying pressure from 105 after fading 105.20ish, ending the session marginally under the round number. This draws eyes towards H4 Quasimodo support coming in at 104.59. While probing levels under 105 perhaps activates breakout sellers (and trips protective stop-loss orders from those attempting to fade the round number), traders are still urged to pencil in the possibility of a stronger recovery back above 105 to H4 Quasimodo resistance from 105.46.
Analysis on the higher timeframes has price movement closing in on weekly support at 104.70, ten pips above the aforementioned Quasimodo support on the H4 timeframe. What’s also notable around 104.70 is the formation of a daily ABCD bullish pattern (red arrows).
Areas of consideration:
Assuming the pair continues to explore terrain south of 105, the 104.70 weekly support and H4 Quasimodo support at 104.59 is perhaps eyed. This is an area traders estimate buyers to potentially make a show, given the additional daily ABCD completion. This, therefore, also forms an intraday downside target for sellers short sub 105.
Recovering above 105, as underlined above, could stretch price to H4 Quasimodo resistance at 105.46. Despite holding limited confluence, aside from forming alongside the immediate downtrend, this is still a base sellers could display interest in.
USD/CAD:
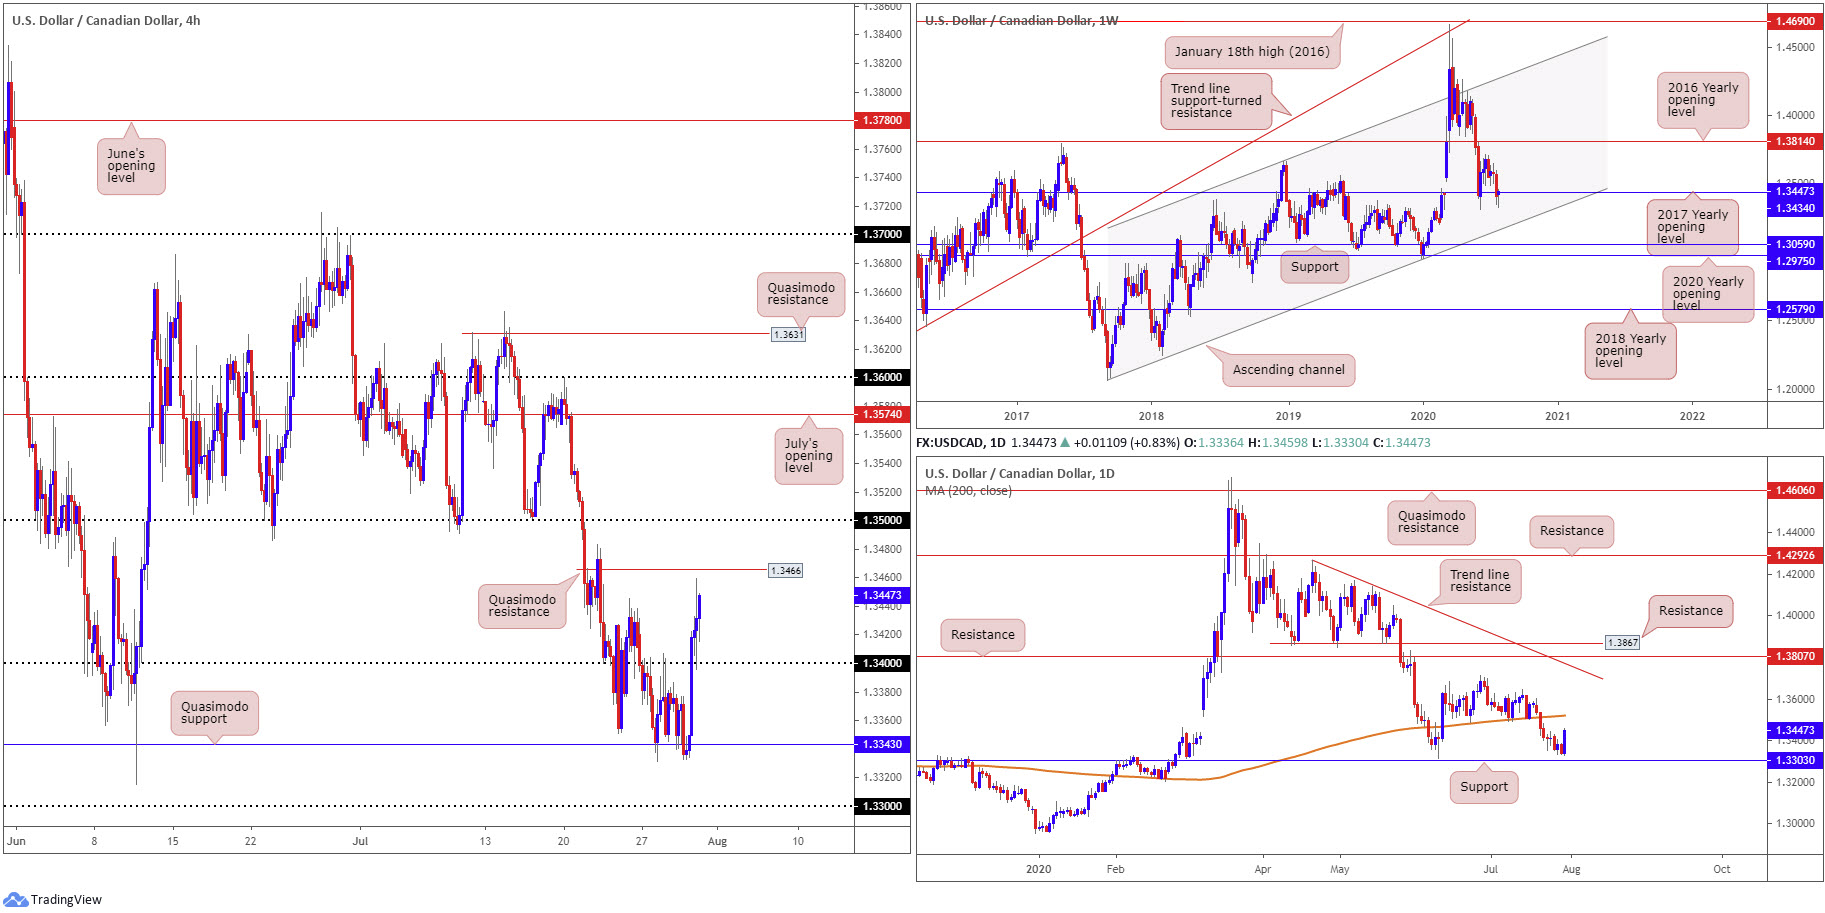
Wider risk pressures weighed on WTI Thursday, sending oil to lows at $38.74 a barrel. As a consequence, this guided the Canadian dollar lower, elevating USD/CAD off H4 Quasimodo support at 1.3343 and above the 1.34 handle, closing the day within striking distance of Quasimodo resistance at 1.3466. Although sellers may make an appearance off the latter today, breaking the base could see expectations rise to the 1.35 handle. Having seen this area hold well as support in recent weeks, resistance could form here.
Multi-timeframe analysis reveals the weekly timeframe has price attempting to regain connection with the 2017 yearly opening level at 1.3434. Below 1.3434, however, channel support, taken from the low 1.2061, can be viewed as the next potential floor, while a break to the upside could eventually throw the 2016 yearly opening level at 1.3814 back into the pot.
The story on the daily timeframe shows price left support at 1.3303 unchallenged and pencilled in a near-full-bodied bullish candle Thursday. With room to extend higher until reaching the 200-day SMA (orange – 1.3520), buyers could stretch things northbound today.
Areas of consideration:
Although buyers appear to have the upper hand right now, at least according to the higher timeframes, H4 traders may seek a close above Quasimodo resistance at 1.3466 before engaging, with the expectation of a follow-through move north of 1.35 to reach 1.3520ish, the 200-day SMA.
USD/CHF:
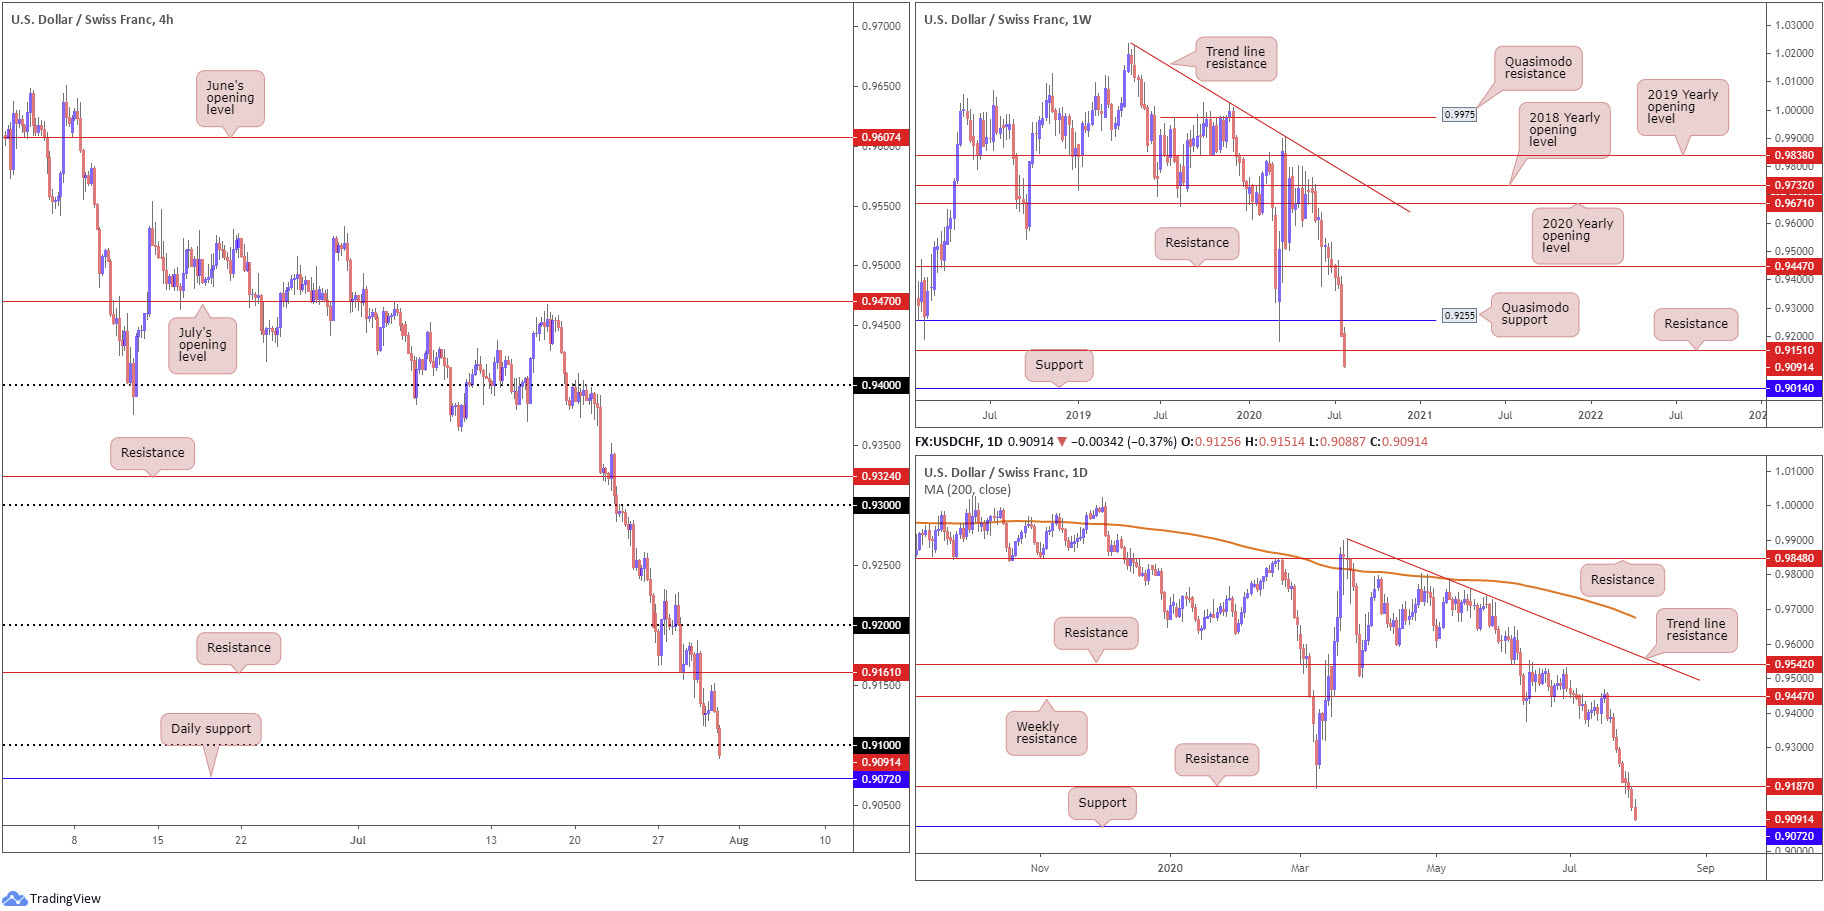
Kicking things off from the top this morning, price action recently leapt through weekly support at 0.9151 and shifted focus to another layer of support at 0.9014. Before reaching this far south, nonetheless, a retest at 0.9151 could occur. Elsewhere, on the daily timeframe, after support at 0.9187 put up little fight (now a serving resistance), we are nearing support coming in at 0.9072 after recording an eighth consecutive daily decline.
Closer analysis on the H4 timeframe shows that after a failed attempt at reaching resistance drawn from 0.9161 (price topped at 0.9150), the candles have since dipped through the round number 0.91. Understandably, this has likely gathered interest from breakout sellers and, at the same time, filled any protective stop-loss orders from traders fading the figure.
Areas of consideration:
Breakout selling strategies under 0.91, although in line with the immediate downtrend, face opposition from daily support mentioned above at 0.9072. Daily support is unlikely noticeable on the lower timeframes, hence this may catch some intraday sellers off guard.
Conservative sellers, therefore, may seek a H4 close (some may prefer a daily close) below current daily support before pulling the trigger; this unshackles downside to as far south as weekly support at 0.9014, according to chart studies. Readers will also acknowledge we may observe a dip into the widely watched 0.90 level, too.
Dow Jones Industrial Average:
US stocks finished considerably off worst levels on Thursday, initially prompted lower on dismal GDP. The Dow Jones Industrial Average declined 225.92 points, or 0.85%; the S&P 500 dropped 12.22 points, or 0.38%, while the tech-heavy Nasdaq 100 concluded higher by 52.52 points, or 0.49%.
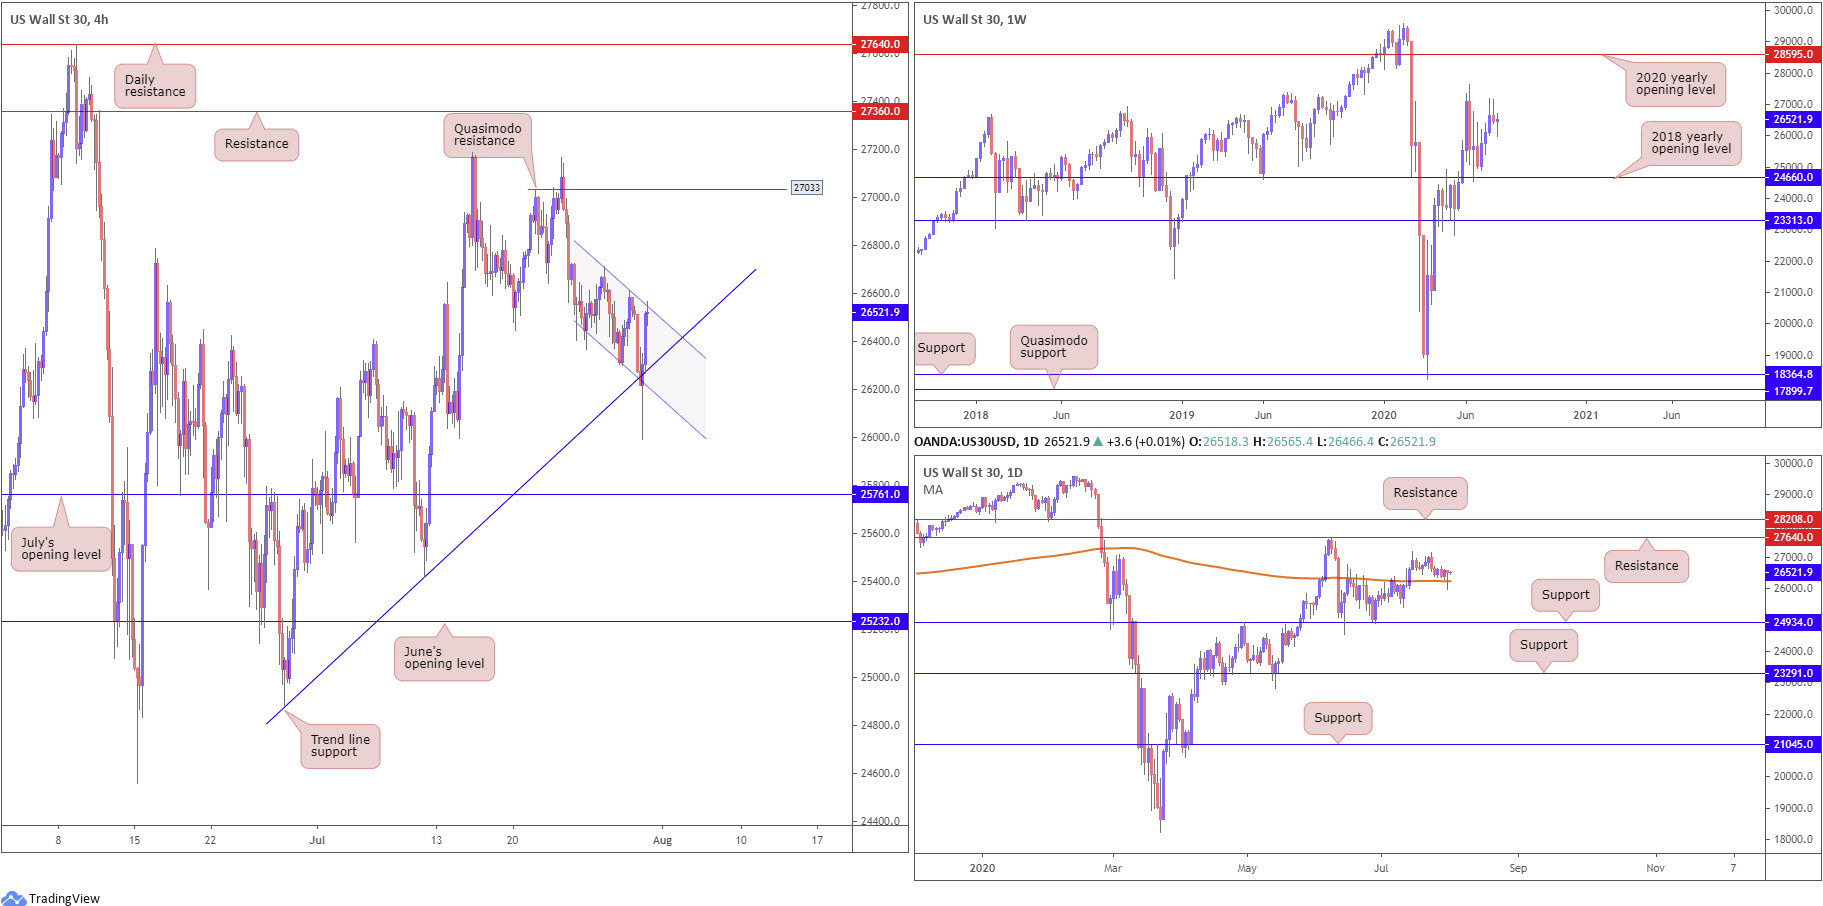
Viewing market action through technical eyes reveals H4 trendline support, extended from the low 24881, made an appearance yesterday, albeit encountering a spike to lows at 25993. Price action traders will acknowledge a recently formed descending H4 channel present between 26712/26303. Eclipsing the upper limit of the aforementioned pattern today signals a bullish market, at least until we cross swords with H4 Quasimodo resistance at 27033.
The 2018 yearly opening level at 24660 remains intact on the weekly timeframe and is an important base of support to keep eyes on. Traders are likely to eventually pull in the 27638 high, despite last week’s modest pullback snapping a three-week bullish phase, followed by a possible run to the 2020 yearly opening level at 28595.
The intraday dip to lower territory yesterday had daily action penetrate the 200-day SMA (orange – 26244), responding in the shape of a hammer candlestick signal. Combined, this might have buyers strengthen their grip and attempt to take on resistance coming in at 27640.
Areas of consideration:
Keeping it simple this morning, all three timeframes point to the possibility of price swerving to the upside. A H4 close above channel resistance (26712) sends across a bullish cue, with an initial upside target set at H4 Quasimodo resistance fixed from 27033.
XAU/USD (GOLD):
Although the price of gold snapped a nine-day bullish phase, sellers lacked conviction and wrapped up Thursday off worst levels. This is likely due to the US dollar index recently tunnelling through 93.00.
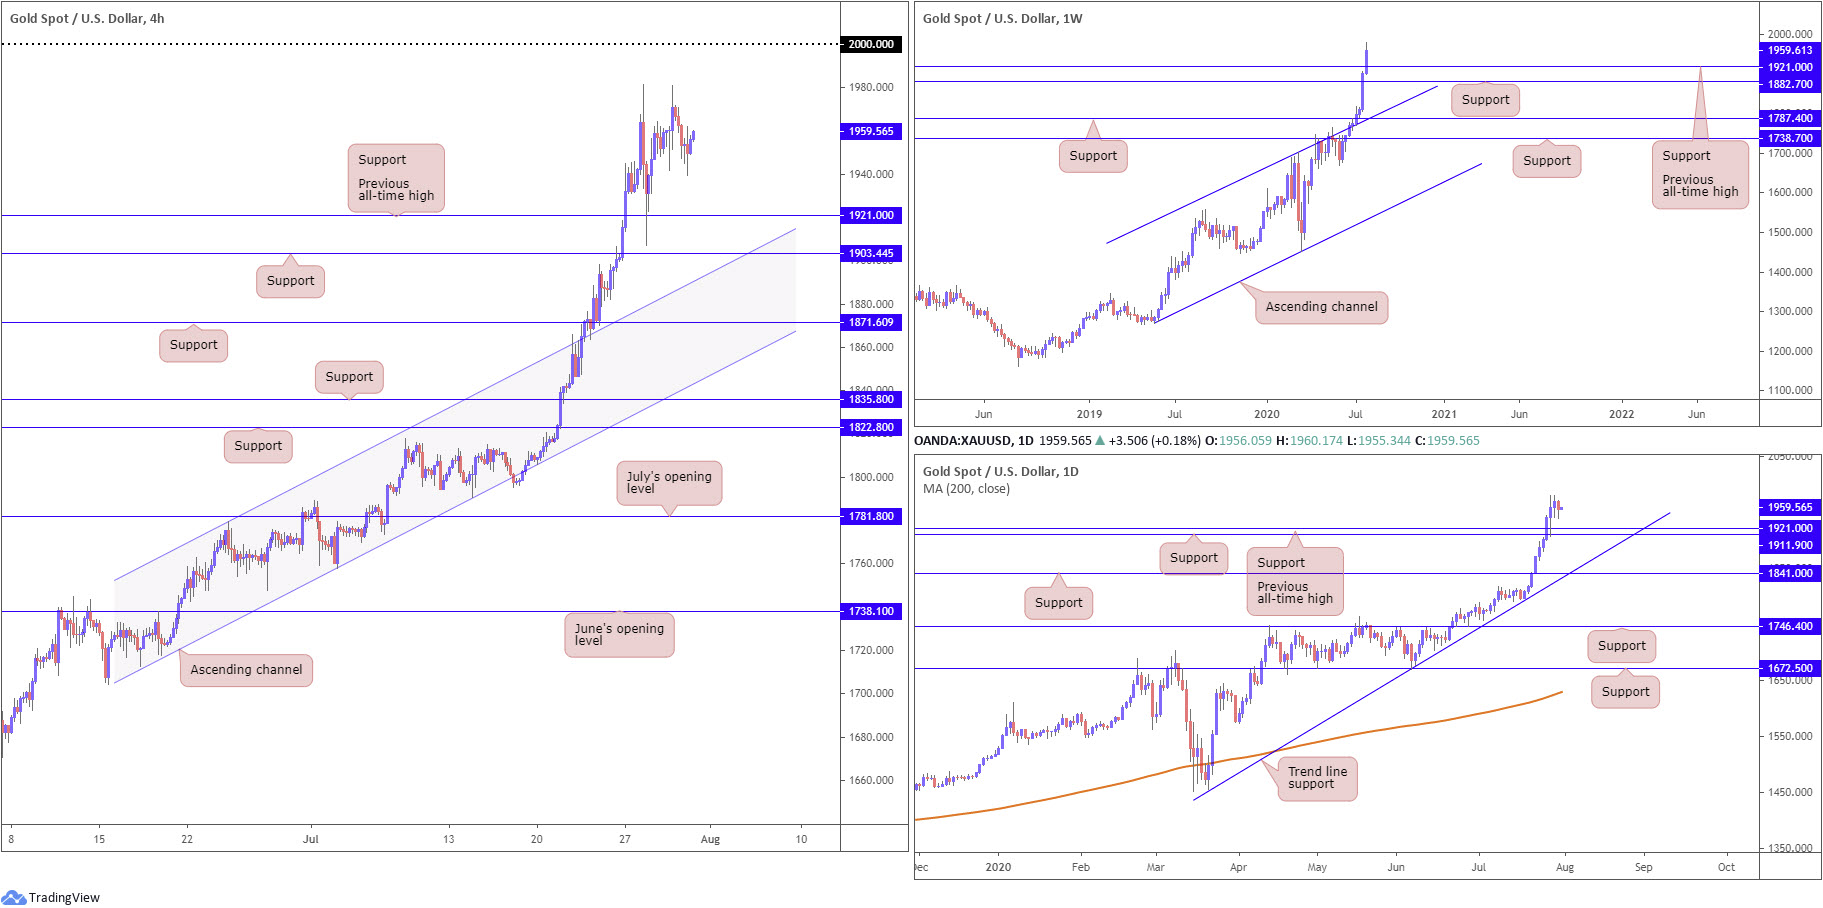
Wednesday drove price to within a few pips of all-time peaks at 1981.3, following Tuesday’s decisive rebound from the previous all-time high at 1921.0. Upside targets remain at the recently formed all-time peak at 1981.3, with a decisive break exposing the widely watched 2000.0 base. Additional selling today, on the other hand, could pull in 1921.0 once again, though breaking this base shifts interest to another support at 1903.4 and channel resistance-turned support, extended from the high 1779.4.
Areas of consideration:
Further buying remains likely in this market, despite Thursday’s modest sell-off. As aired in Thursday’s technical briefing, a break of 1981.3 could stimulate bullish scenarios to 2000.0 today, while dips back to 1921.0 may also be on the cards and ignite dip-buying strategies.
The accuracy, completeness and timeliness of the information contained on this site cannot be guaranteed. IC Markets does not warranty, guarantee or make any representations, or assume any liability regarding financial results based on the use of the information in the site.
News, views, opinions, recommendations and other information obtained from sources outside of www.icmarkets.com.au, used in this site are believed to be reliable, but we cannot guarantee their accuracy or completeness. All such information is subject to change at any time without notice. IC Markets assumes no responsibility for the content of any linked site.
The fact that such links may exist does not indicate approval or endorsement of any material contained on any linked site. IC Markets is not liable for any harm caused by the transmission, through accessing the services or information on this site, of a computer virus, or other computer code or programming device that might be used to access, delete, damage, disable, disrupt or otherwise impede in any manner, the operation of the site or of any user’s software, hardware, data or property.