
Key risk events today:
China Manufacturing PMI and Non-Manufacturing PMI; Spanish Flash GDP q/q; EUR CPI Flash Estimate y/y; Canada GDP m/m and RMPI m/m; US Core PCE Price Index m/m; US Employment Cost Index q/q; US Personal Spending m/m and US Personal Income m/m; Chicago PMI.
(Italics represents previous analysis and outside sources).
EUR/USD:
Europe’s shared currency firmed against the US dollar Thursday, adding more than 20 points, or approximately 0.20%. On the data front, the inflation rate in Germany, measured as the year-on-year change in the consumer price index, is expected to be 1.7% in January 2020. Based on the results available so far, the Federal Statistical Office (Destatis) also reported consumer prices are expected to decline by 0.6% on December 2019.
The US economy expanded at a 2.1% annualised rate in Q4, according to the advance estimate released by the Bureau of Economic Analysis, while jobless claims marginally dropped.
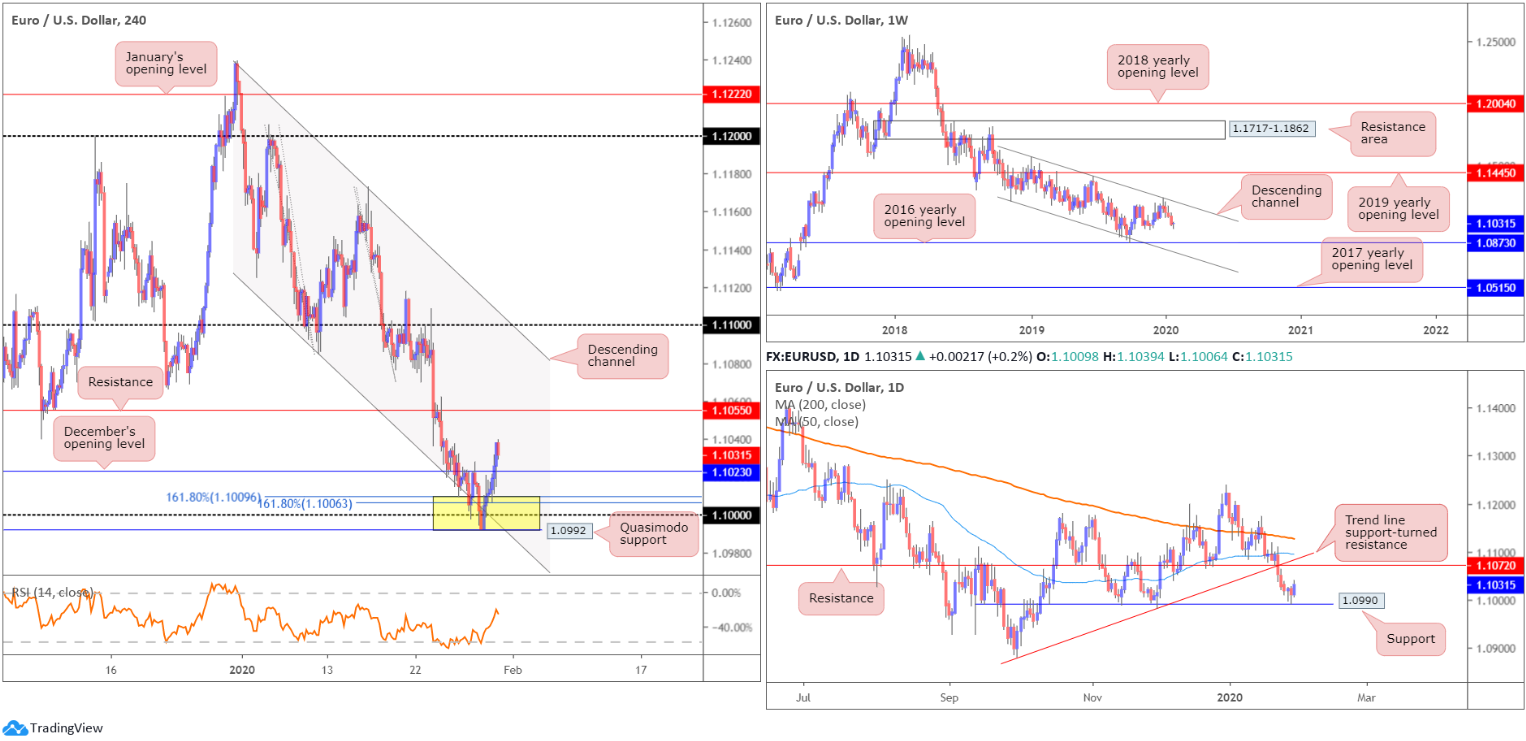
Technical research, based on H4 movement, has price action advancing out of a key reversal zone at 1.0992/1.1009 (comprised of the key figure 1.10, channel support, pencilled in from the low 1.1085, Quasimodo support at 1.0992 and two 161.8% Fibonacci extensions at 1.1006 and 1.1009 – yellow). Price recently overthrew December’s opening level at 1.1023 and scored a high of 1.1039. Limited resistance is visible on this scale until reaching 1.1055, closely followed by daily resistance coming in at 1.1072 after a near-test at support drawn from 1.0990.
Contrary to daily and H4 structure, the weekly timeframe exhibits scope to extend losses south of long-standing channel resistance, drawn from the high 1.1569. Assuming sellers remain in the driving seat, the 2016 yearly opening level at 1.0873 is feasible support followed by channel support, taken from the low 1.1109. Further supporting sellers is the primary trend, lower since topping in early 2018, at 1.2555.
Areas of consideration:
Well done to any traders long 1.0992/1.1009; this was a noted bullish reversal zone to keep an eye on in previous reports. The H4 close above December’s opening level at 1.1023 was likely a cue for most buyers to reduce risk to breakeven. In addition, it might entice additional buying, particularly if 1.1023 is retested as support.
The next resistance targets beyond 1.1023, as stated above, rest at H4 resistance drawn from 1.1055 and daily resistance at 1.1072. Eyeing much higher than here is unlikely due to weekly price threatening lower moves.
GBP/USD:
The Bank of England left UK interest rates on hold. The Bank also cut its growth forecasts and downgraded its expectations for productivity growth, in a sign that the UK economy has suffered from Brexit uncertainty.
According to Bloomberg, the pound’s spike about 15 seconds before the Bank of England’s interest-rate decision prompted traders and analysts to wonder if there had been a leak. Sterling shot up toward $1.31 just before BoE policy makers surprised markets by voting 7-2 for no change, even though many analysts and investors expected a closer decision or a rate cut. There was also a volume spike in the minute beforehand, according to traders.
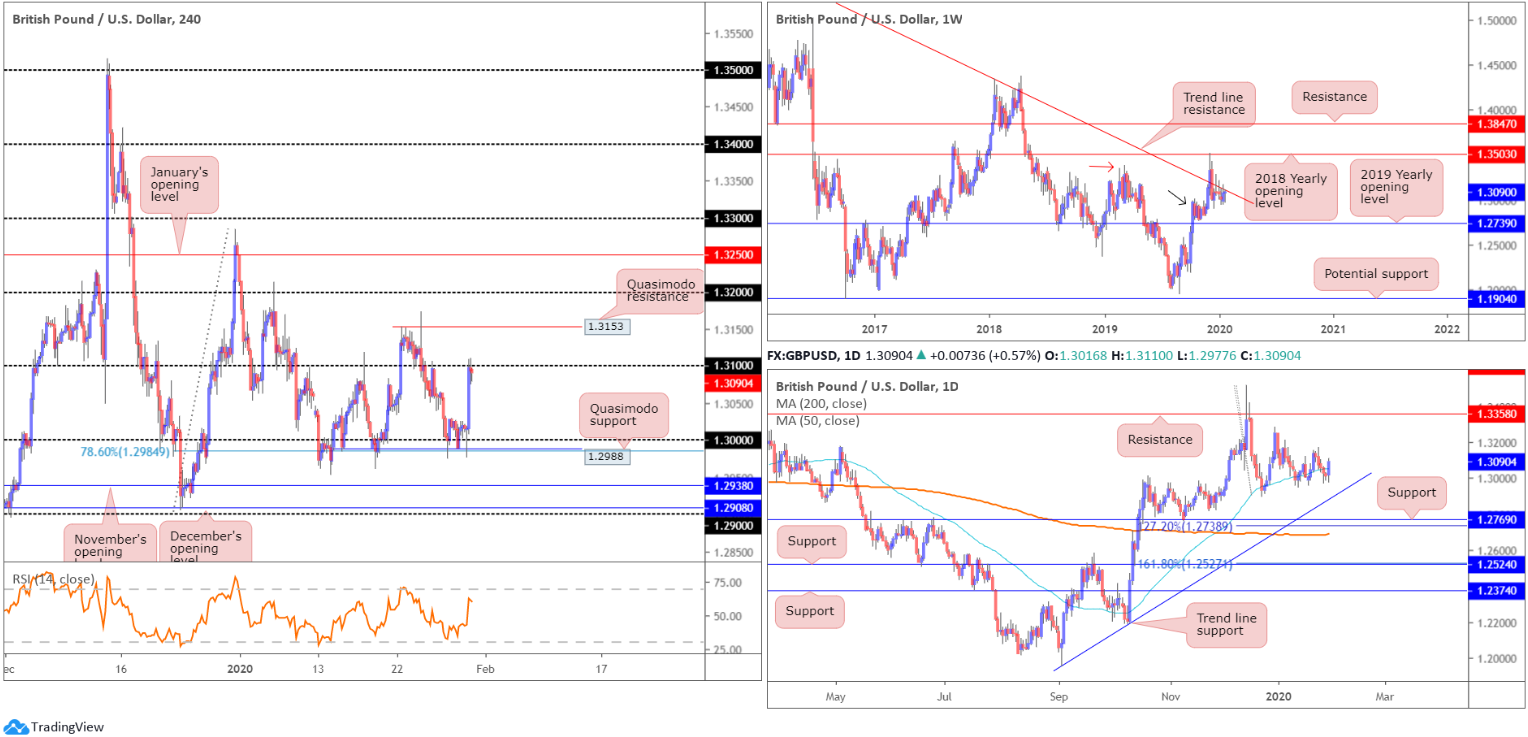
Technically, we remain off highs at 1.3110, marginally paring earlier gains. Above 1.31 on the H4 timeframe, Quasimodo resistance lies close by at 1.3153. The relative strength index (RSI) is also seen fast approaching overbought status. Further rejection off 1.31 has the key figure 1.30 to target, shadowed by Quasimodo support at 1.2988, as well as a 78.6% Fibonacci retracement at 1.2884.
Daily activity, in the shape of an outside candle, shot back above its 50-day SMA (blue – 1.3055) yesterday. This should not come as a surprise, given recent history. Late December and throughout January, price engulfed the said SMA to the downside in similar fashion, but was able to recover and close higher.
Since late December, longer-term movement on the weekly timeframe has been consolidating between long-standing trend line resistance, pencilled in from the high 1.5930, and demand around the 1.2939 region (black arrow), likely seduced by the recent break of the notable high at 1.3380 (red arrow). A break of the said trend line has the 2018 yearly opening level at 1.3503 to target, whereas a move south implies we might see a push to the 2019 yearly opening level at 1.2739, consequently tripping sell stops below the current demand zone.
Areas of consideration:
Shorts off 1.31 are an option today as weekly price trades close by its current trend line resistance. Equally interesting for shorts is H4 Quasimodo resistance, mentioned above at 1.3153.
Conservative traders may opt to hold fire and wait for additional candlestick confirmation to form before pulling the trigger. This helps identify seller intent and provide entry and risk levels to work with.
AUD/USD:
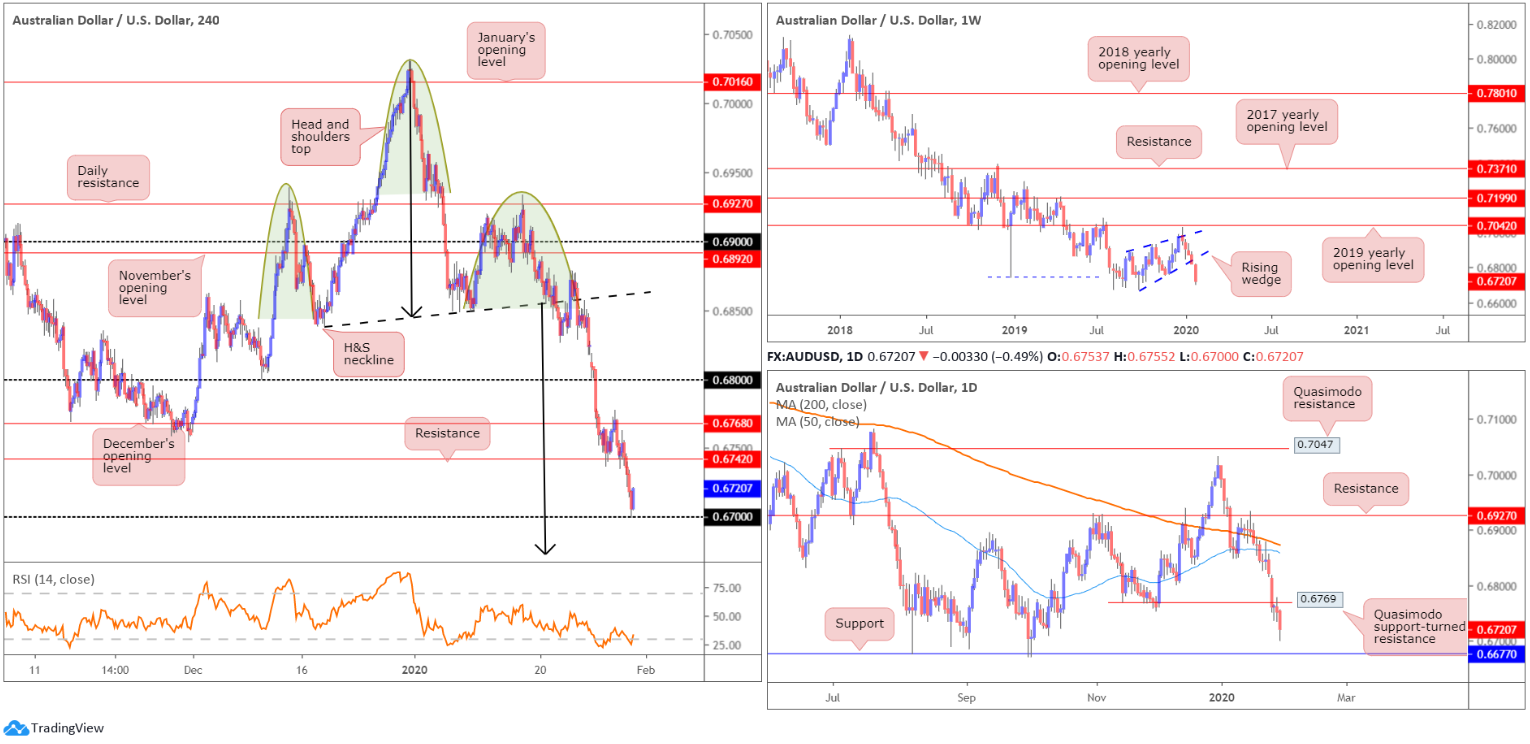
Heightened concerns over the coronavirus continues to impact the China-proxy Australian dollar. As of writing, AUD/USD is down 0.47%, but gleaning some support off the 0.67 handle, applied to the H4 timeframe. The relative strength index (RSI) is also attempting to exit oversold territory on mild bullish divergence.
Traders who read previous reports may also recall the following pieces (italics):
H4 price has been chalking up a head and shoulders top pattern since mid-December 2019 (left shoulder sports a top at 0.6938, right shoulder at 0.6933 and the head at 0.7031 – green). The neckline is drawn from the 0.6838 December 18 low and the 0.6850 January 9 low (black line). H&S traders will be looking for 0.6671ish as a take-profit target (calculation from the head to neckline added to the breakout point – black arrows).
There will likely be traders short this market on last Tuesday’s H4 close south of the H&S neckline. In addition, price retested the neckline last Friday and rotated lower, another noted entry point. Well done to any readers who remain short the H&S pattern, as the final take-profit target rests a touch beyond 0.67.
On more of a broader perspective, the weekly timeframe, since registering a bottom in late September at 0.6670, has been carving out what appears to be a rising wedge formation, typically considered a continuation pattern. The past four weeks witnessed price decline back into the rising wedge and, thanks to recent selling, break and extend beyond the lower edge. With the primary downtrend having been in full force since topping at 0.8135, in early 2018, the recent close beyond the lower edge of the noted wedge formation may trigger weighty sell stops, both from lower-timeframe traders entering long the shorter-term correction and longer-term traders’ breakout sell orders.
Daily Quasimodo support-turned resistance at 0.6769 remains in motion, with limited support seen on this timeframe until 0.6677.
Areas of consideration:
Well done to any readers short the H4 H&S formation, either on last Tuesday’s breakout or Friday’s neckline retest. With only 0.67 standing in the way of price reaching the final take-profit target, it’s likely to hit today or early next week. However, some traders may have already cashed in most of the position. Regardless, chart studies suggest leaving a portion of the position running, at least until connecting with daily support coming in at 0.6677.
USD/JPY:
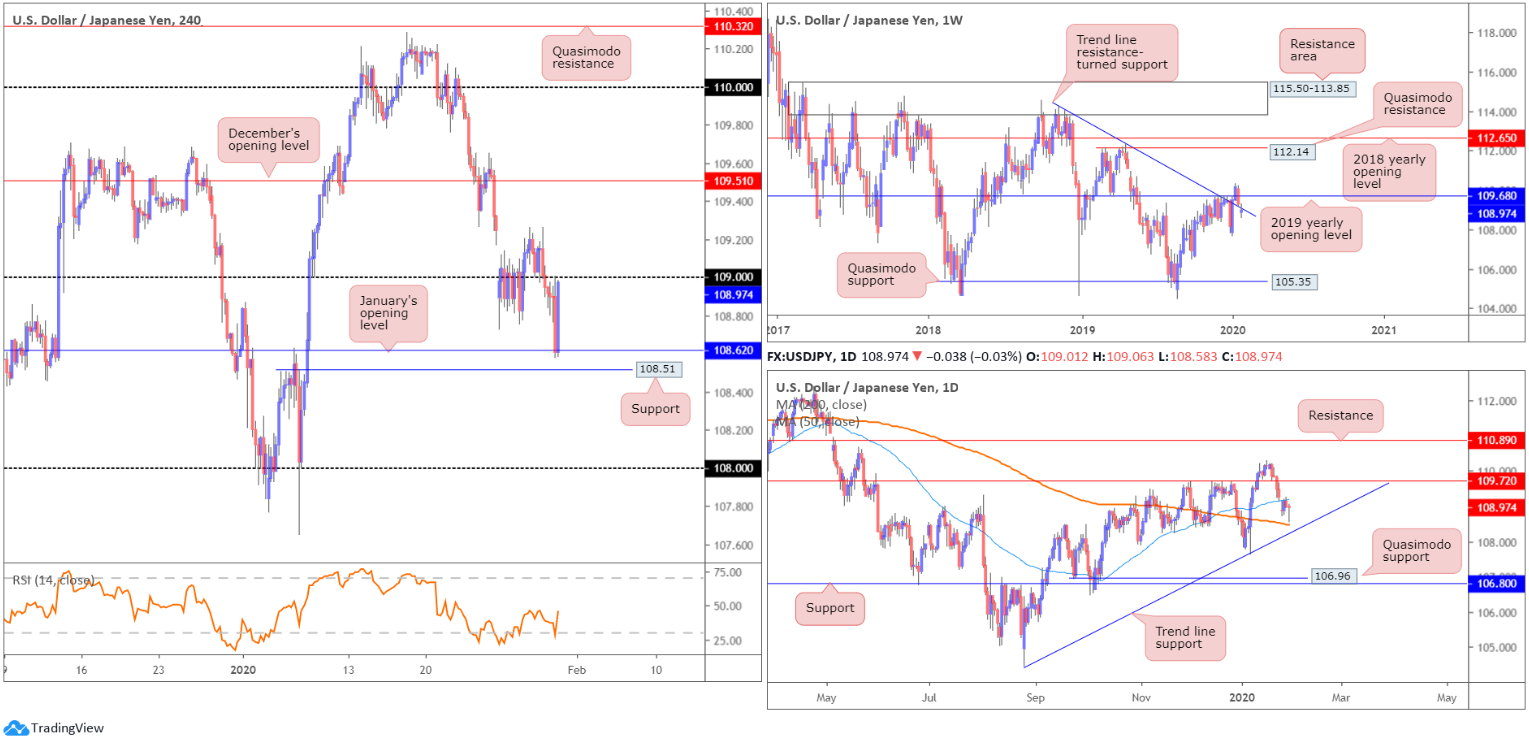
After dethroning 109 to the downside in early hours Thursday, a retest at the underside of the number took hold in US trade, followed through with a slide to lows at 108.58, levels not seen since January 8th. A risk-off combination of broad USD weakness, US equities exploring lower ground and US Treasury yields dipping, collectively weighed on the pair.
Recent hours, however, has seen USD/JPY recoup the majority of earlier losses off January’s opening level at 108.62 (fixed just north of H4 support at 108.51), settling the day a few points below 109. Note the relative strength index (RSI) is also seen chalking up divergence out of oversold terrain. As evident from the daily timeframe, movement is on course to form a hammer candlestick pattern, considered a bullish signal at troughs. In terms of support and resistance on this timeframe, nonetheless, the 50-day SMA (blue – 109.19) now serves as resistance, as does 109.72, while the 200-day SMA (orange – 108.47) and trend line configuration (taken from the low 104.44) represents support. Note the said 50-day SMA crossed above the 200-day SMA mid-December 2019, referred to as a ‘Golden Cross’.
The story on the weekly timeframe has price trading beneath the 2019 yearly opening level at 109.68 and a touch south of trend line resistance-turned support, extended from the high 114.23. Buying from here may set the long-term stage for a run to Quasimodo resistance at 112.14 and the 2018 yearly opening level at 112.65, whereas moves lower underscores the 107.65 Jan 6 low.
Areas of consideration:
Shorts from 109 are exposed to a potential whipsaw motion to the 50-day SMA (109.19), therefore trade this level with care. Waiting for additional confirmation is recommended, before committing.
In view of a decisive push back above 109 today, Wednesday’s high 109.26 could be problematic, though December’s opening level at 109.51 is the more likely resistance, followed by daily resistance plugged in at 109.72. As such, long trades north of 109, particularly on the back of a retest motion, are also possibly in the offing today.
USD/CAD:
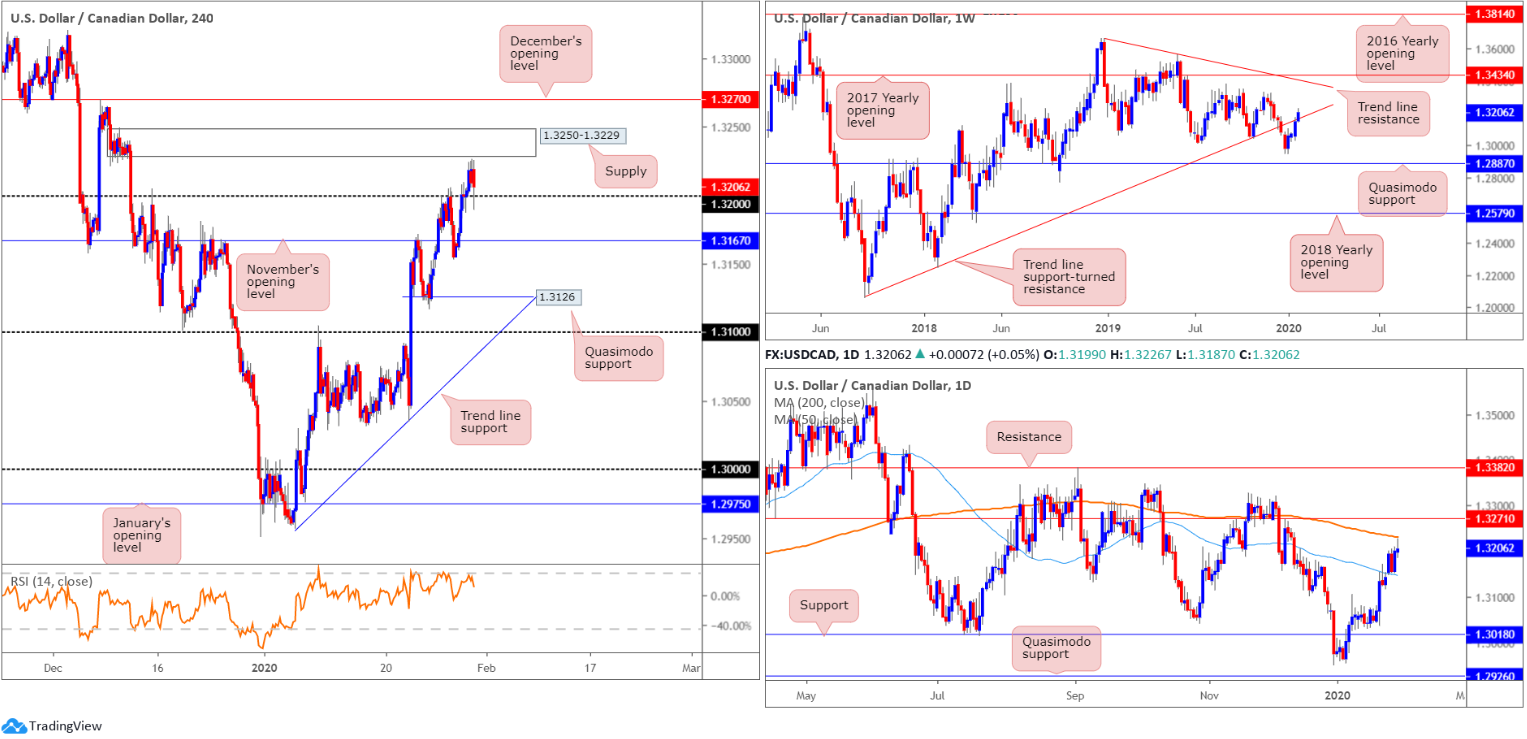
Missing H4 supply at 1.3250-1.3229 (strong momentum derived from the base) by a whisker, USD/CAD dipped lower in recent hours. Beyond the current supply, December’s opening level at 1.3270 is in the firing range. The 1.32 handle is holding after a brief spell to 1.3190, while the relative strength index (RSI) is fading overbought levels.
Recent BoC talk seemed to have something to do with the abrupt bid in the Canadian dollar, though the US dollar index also fell to daily support at 97.86 as well.
On a wider perspective, daily price came within a few points of striking the 200-day SMA (orange – 1.3229) yesterday, before rotating lower. Further selling could guide the pair toward the 50-day SMA (blue – 1.3146), while moves above the said 200-day SMA has nearby resistance at 1.3271. Both the 200/50-day SMAs point south, with the faster SMA trading beneath the slower SMA since mid-July 2019.
Weekly activity is seen attempting to climb above trend line support-turned resistance, extended from the low 1.2061. Continued bidding from here could reach tops around 1.3317, closely followed by trend line resistance (1.3661) and the 2017 yearly opening level at 1.3434. A rejection lower, on the other hand, may prompt a selloff to the 1.2951 December 30 low, followed by a Quasimodo formation at 1.2887. The immediate trend has faced north since bottoming in September 2017; however, this move could also be considered a deep pullback in a larger downtrend from the 1.4689 peak in early January 2016.
Areas of consideration:
The break higher on the weekly timeframe is a promising sign for further upside. The problem arises when traders attempt to find an entry on the lower timeframes. Daily price has the 200-day SMA and 1.3271 hindering buyers, while H4 price brings with it supply at 1.3250-1.3229 and December’s opening level at 1.3270.
USD/CHF:
For traders who read Thursday’s technical briefing you may recall the following (italics):
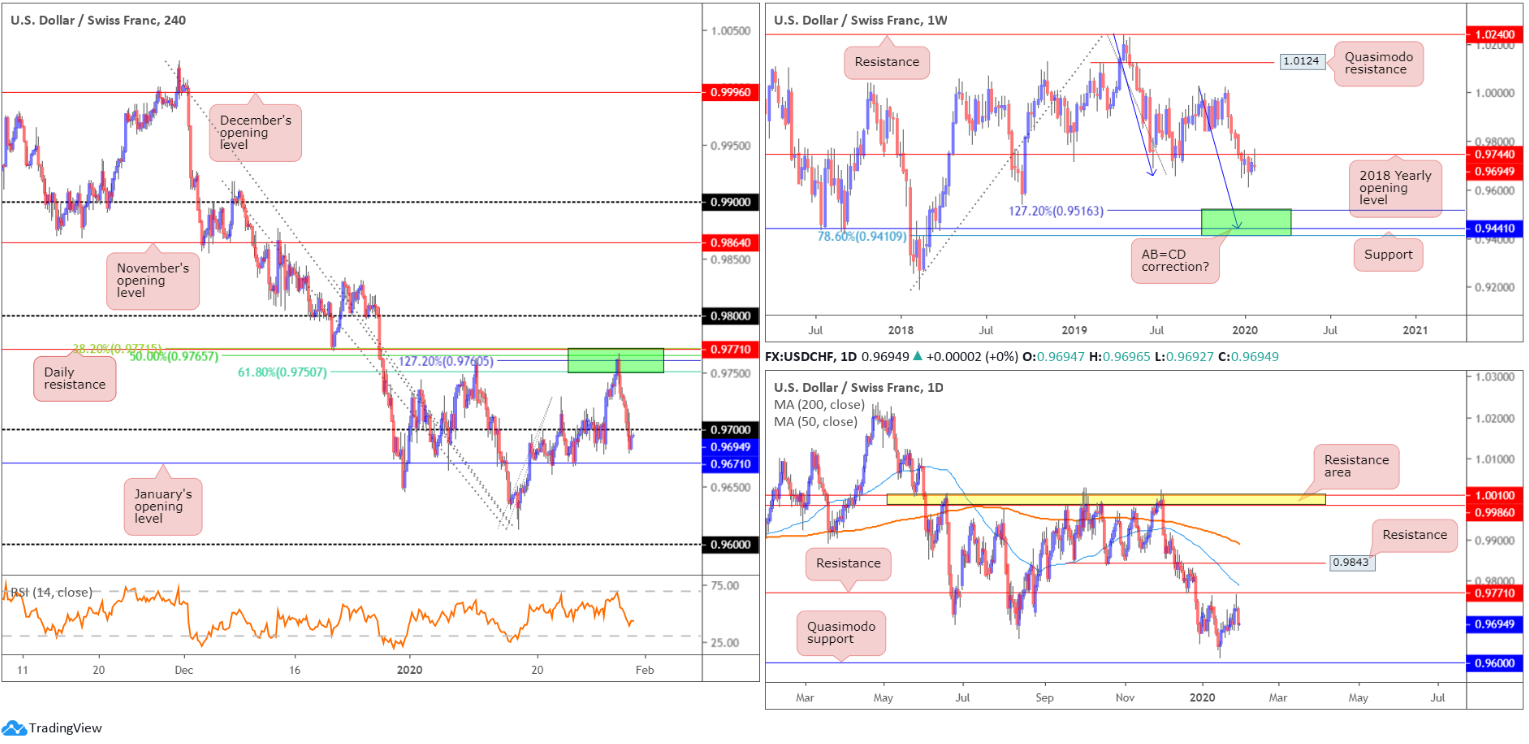
USD/CHF witnessed healthy bidding amid London hours Wednesday, based on broad-based USD buying. Things turned sour off session highs at 0.9766 in US trading, however, pressured lower from a strong area of Fibonacci confluence on the H4 timeframe and nearby daily resistance at 0.9771, between 0.9771/0.9750 (green). What also made this area appealing was the buy stops tripped above the 0.9762 January 10th high; this provided liquidity to sell into, and also the relative strength index (RSI) struck its overbought value. In terms of support, the 0.9729 January 22nd high could offer an intraday ‘floor’ today, with a break exposing the 0.97 handle.
On more of a broader perspective, weekly price is touching gloves with the 2018 yearly opening level at 0.9744, a resistance. Having seen this level serve well as support since January 2019, a turn lower from here is probable. The next downside target sits within 0.9410/0.9516, comprised of a 78.6% Fibonacci retracement at 0.9410, support at 0.9441 and a 127.2% AB=CD bullish correction (black arrows]) at 0.9516 – green.
According to structure on the daily timeframe, price pencilled in a shooting star candlestick pattern yesterday (considered a bearish signal), with the upper shadow missing resistance at 0.9771 by a hair. Pushing lower from this point has the 0.9613 January 16th low in position, stationed a few points above Quasimodo support at 0.9600.
As can be seen on the H4 timeframe this morning, USD/CHF extended its downside presence Thursday, brushing aside the 0.97 handle and reaching lows of 0.9679. January’s opening level at 0.9671 is next on tap as support on the H4 scale, with a break revealing the aforementioned 0.9613 January 16 low, closely followed by the 0.96 handle (also represents daily Quasimodo support). Data wise, the US economy expanded at a 2.1% annualised rate in Q4, according to the advance estimate released by the Bureau of Economic Analysis, while jobless claims marginally dropped. The said reports had limited impact, however.
Areas of consideration:
Traders short 0.9771/0.9750, based on the H4 timeframe, likely reduced risk to breakeven and cashed in a portion of the position at the tail end of Wednesday’s session. As underscored above, 0.9671 is the next support target in sight.
With higher-timeframes suggesting further selling, traders may watch for a retest at 0.97 to form today, with the expectation of a breach of 0.9671 and a run to 0.96ish.
Dow Jones Industrial Average:
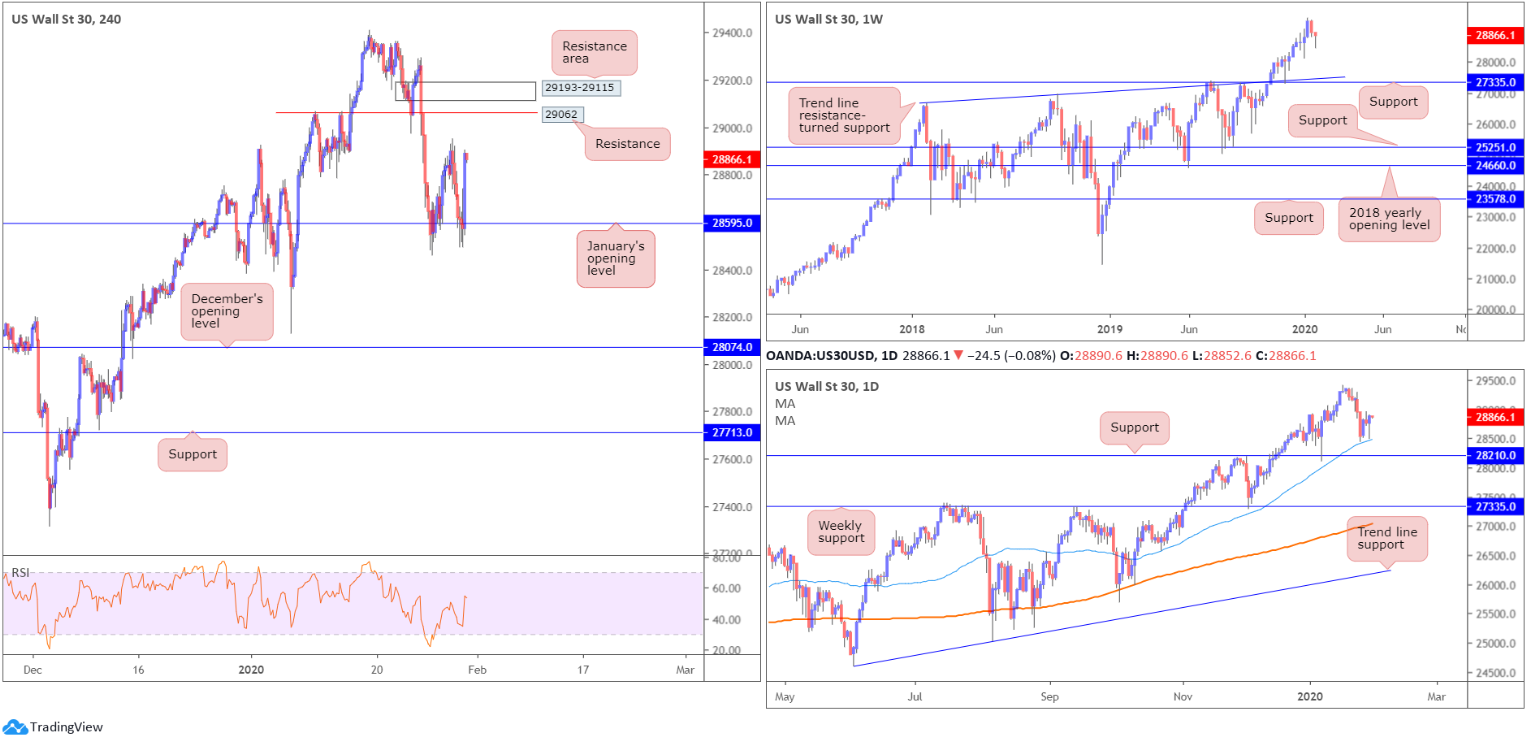
Wall Street’s major benchmarks staged an imposing recovery in the later phase of the session, trimming earlier losses. The market appears to have shifted focus away from the economic impact of the coronavirus to positive earnings. The Dow Jones Industrial Average added 124.99 points, or 0.43%; the S&P 500 climbed 10.26 points, or 0.31% and the tech-heavy Nasdaq 100 ended higher by 34.47 points, or 0.38%.
January’s opening level at 28595, despite price surpassing the level to nearby lows at 28497, proved itself a stable area of support once more. Aside from Wednesday’s 28952 high, resistance forms around 29062 and a resistance area at 29193-29115.
Higher-timeframe action has daily price recovering a touch above its 50-day SMA (blue – 28471), with yesterday’s movement wrapping up in the shape of a hammer candlestick formation (considered a bullish signal at troughs). Weekly price, also currently trading in the shape of a hammer pattern, exhibits scope to push as far south as trend line resistance-turned support (26670), and support coming in at 27335.
Areas of consideration:
January’s opening level at 28595 holding for a second time implies strong buying interest, even more so following daily action closing by way of a hammer candlestick pattern. The problem, other than 28595, is there’s limited support to take advantage of a possible run to H4 resistance at 29062/resistance area at 29193-29115. Traders will have to drill down to the lower timeframes and attempt to trade long off more local structure.
XAU/USD (GOLD):
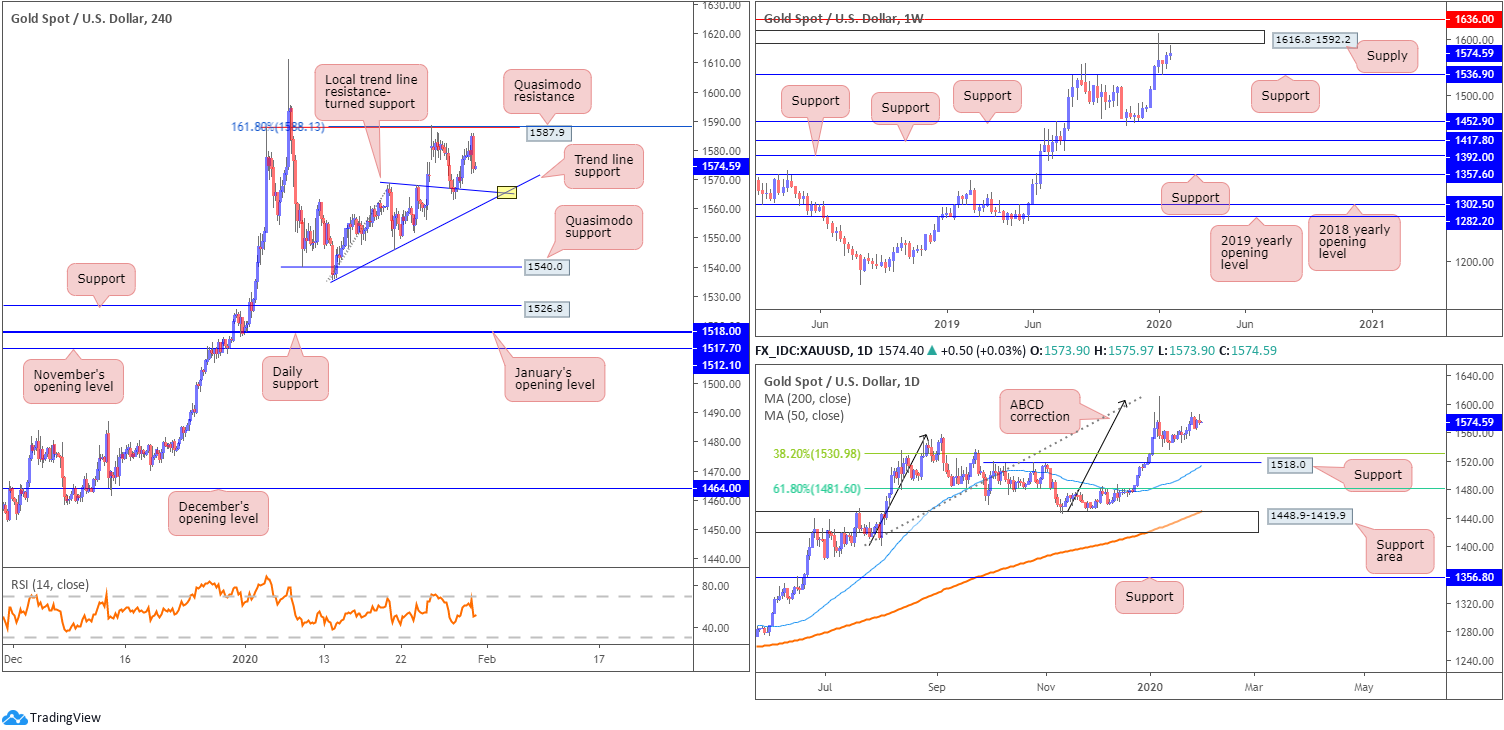
Thursday had bullion fading intraday highs at 1585.9, erasing $3, or 0.19%, on the session. H4 action is currently sandwiched between Quasimodo resistance at 1587.9/161.8% Fibonacci extension at 1188.1 and a local trend line resistance-turned support, taken from the high 1568.6. The point this level merges (yellow) with another trend line support, extended from the low 1535.7, is an interesting convergence, likely to hold if tested. Below the said trend line support, several intraday lows are seen followed by Quasimodo support at 1540.0.
Against the backdrop of shorter-term flow, weekly price holds south of supply at 1616.8-1592.2, though also recently found support off 1536.9. Above the noted supply, resistance resides close by at 1636.0.
According to the daily chart, price action turned higher just ahead of the 38.2% Fibonacci retracement at 1530.9, closely followed by 1518.0. The former offers an initial take-profit target for traders short the ABCD bearish correction (black arrows) at 1608.0.
Areas of consideration:
Potential shorts may emerge off H4 Quasimodo resistance at 1587.9, in the event of a retest, though traders are urged to pencil in the possibility of a fakeout to the underside of the weekly supply (1592.2), before turning lower. It may, therefore, be an idea to consider waiting for additional candlestick confirmation, such as a shooting star pattern or an engulfing formation, before committing (entry and risk levels can be defined according to this structure).
As for support, traders’ crosshairs are likely fixed on the point the two H4 trend lines converge, for an intraday bounce higher. Like the Quasimodo resistance above, it may be a good idea to consider waiting for additional candlestick confirmation, due to trend lines being prone to fakeouts.
The accuracy, completeness and timeliness of the information contained on this site cannot be guaranteed. IC Markets does not warranty, guarantee or make any representations, or assume any liability regarding financial results based on the use of the information in the site.
News, views, opinions, recommendations and other information obtained from sources outside of www.icmarkets.com.au, used in this site are believed to be reliable, but we cannot guarantee their accuracy or completeness. All such information is subject to change at any time without notice. IC Markets assumes no responsibility for the content of any linked site.
The fact that such links may exist does not indicate approval or endorsement of any material contained on any linked site. IC Markets is not liable for any harm caused by the transmission, through accessing the services or information on this site, of a computer virus, or other computer code or programming device that might be used to access, delete, damage, disable, disrupt or otherwise impede in any manner, the operation of the site or of any user’s software, hardware, data or property.


