
Key risk events today:
German Prelim GDP q/q; (CHF) KOF Economic Barometer; Canada GDP m/m; US Core PCE Price Index m/m; US Personal Spending m/m; Chicago PMI; US Revised UoM Consumer Sentiment.
(Previous analysis as well as outside sources – italics).
EUR/USD:
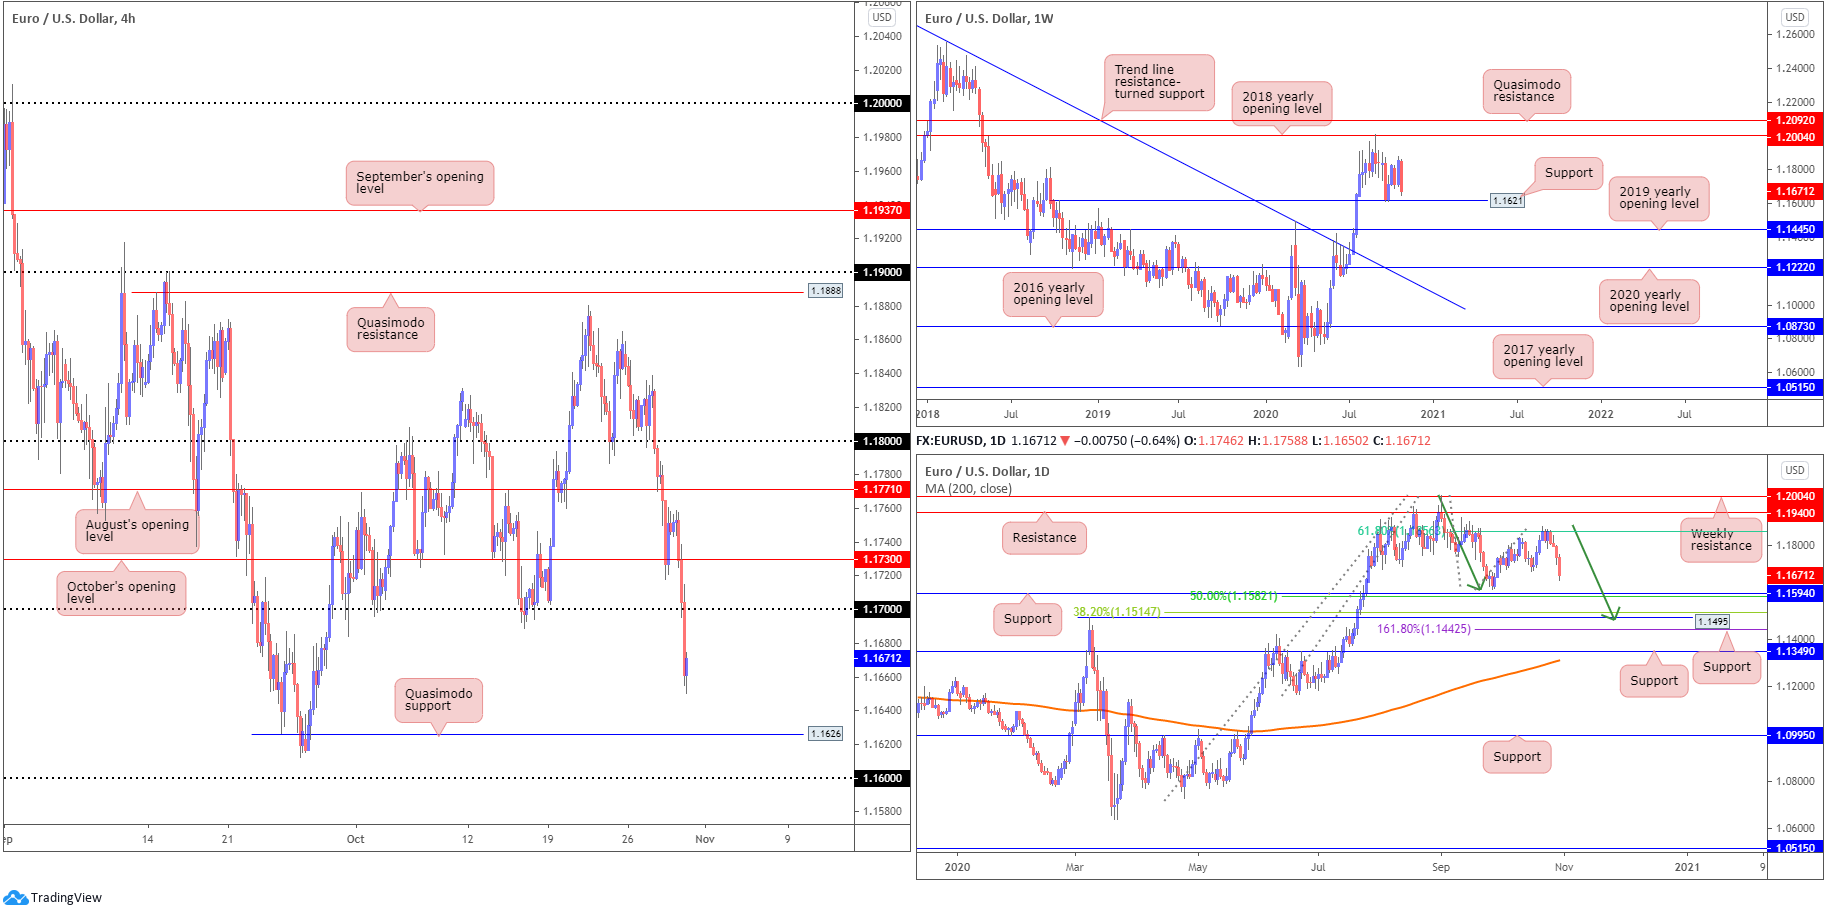
Europe’s shared currency, fuelled on surging COVID-19 cases as well as a downbeat evaluation of the Eurozone economic outlook from President Lagarde, extended losses against a broadly stronger buck on Thursday.
Bearish flow hauled H4 candles through the 1.17 handle, a level that’s offered a supportive tone since the beginning of October. According to the H4 chart, further selling could be on the cards until we shake hands with Quasimodo support at 1.1626, closely shadowed by the 1.16 handle.
Aligning closely with the H4 Quasimodo, we can also see weekly support at 1.1621. In addition, daily support comes in just under the 1.16 handle at 1.1594, accompanied by a 50.0% retracement ratio at 1.1582. Also print worthy is the potential daily AB=CD correction (green arrows) at 1.1476 and 1.618 BC projection at 1.1442.
Areas of consideration:
- Retesting the 1.17ish region as resistance today may spark a bearish theme, targeting at least H4 Quasimodo support from 1.1626.
- Between daily support at 1.1594 (and the 0% retracement ratio at 1.1582) and the 1.16 handle on the H4 gifts traders a reasonably tight area of support to work with in the event we cross lower today.
GBP/USD:
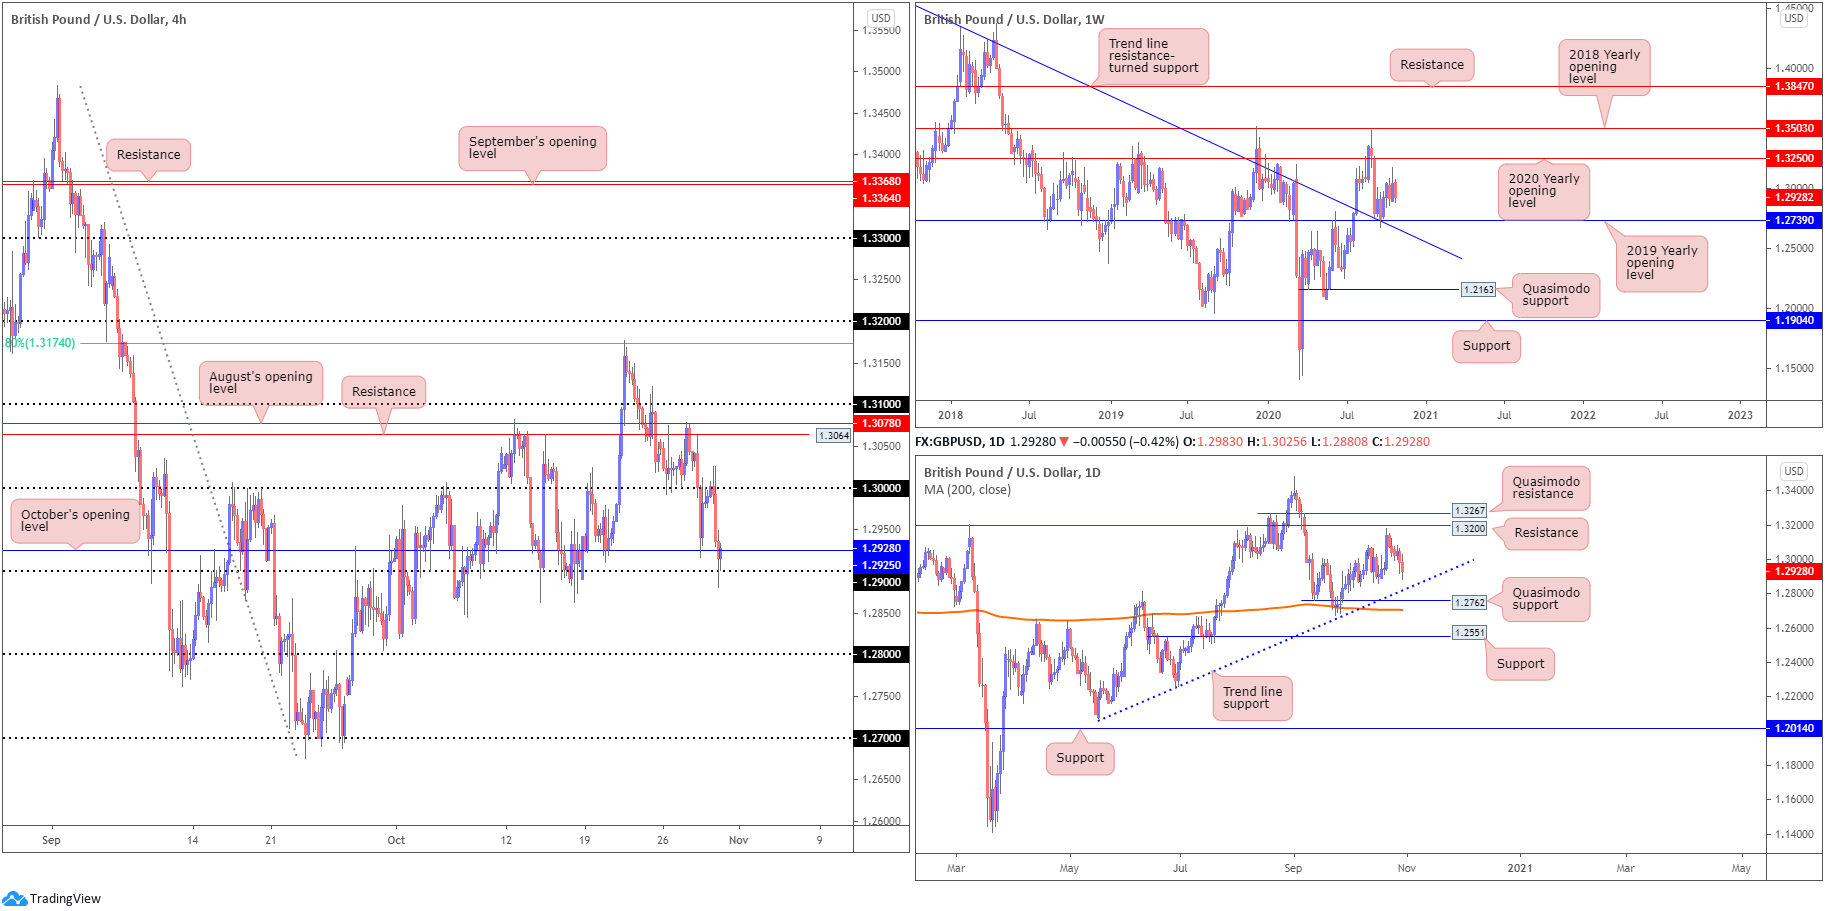
Cable traded on the backfoot Thursday, weighed by USD strength on risk aversion and negative Brexit vibes. Technically, we can see the key figure 1.30 held ground on the H4 and attracted enough sellers to drive to the 1.29 handle, consequently surpassing October’s opening value at 1.2925.
Although 1.29 holds as support, the higher timeframes suggest sellers still have some gas left in the tank.
The weekly timeframe reveals room for sellers to revisit support at 1.2739 (a 2019 yearly opening value blending with trend line resistance-turned support, extended from the high 1.5930). Similarly, price action on the daily timeframe demonstrates scope to depreciate further and cross swords with trend line support, extended from the low 1.2075, followed by Quasimodo support at 1.2762.
Areas of consideration:
- The 1.29 handle echoes instability, with a break under the aforementioned number potentially triggering a sell to 1.28 (limited [active] demand to the left of price seen). Conservative sellers, nonetheless, may opt to wait and see if a 1.29 retest (as a resistance) forms before committing.
AUD/USD:
For those who read Thursday’s technical briefing you may recall the following (italics):
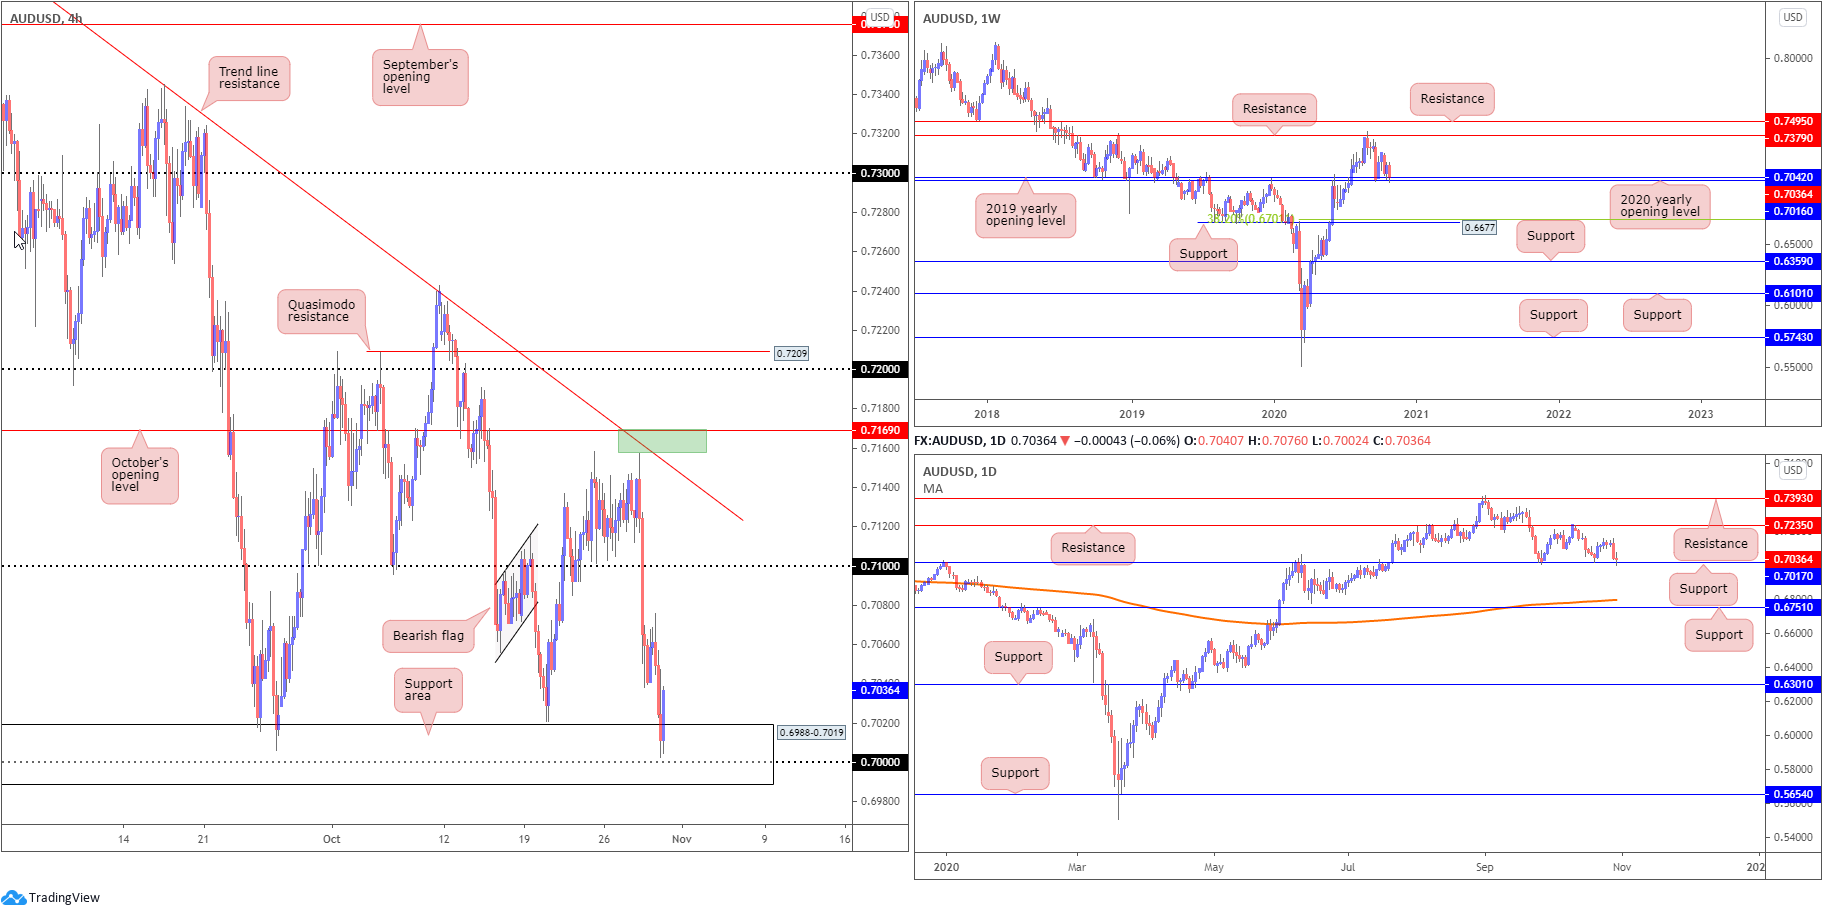
Owing to the overall trend in this market facing north right now, producing sizeable gains since early 2020, and the weekly and daily timeframes trading around support, buyers could make an appearance out of the H4 support area from 0.6988-0.7019 today.
As the US dollar index explores terrain north of 93.50, the risk-sensitive Australian dollar plunged into the H4 support zone mentioned above at 0.6988-0.7019 on Thursday (missing the key figure 0.70 by a hair) and has, as you can see, generated a bullish response. Technically, this should not really surprise, given the weekly timeframe displays support in the shape of the 2020 (0.7016) and 2019 (0.7042) yearly opening values, along with daily support priced in at 0.7017.
Areas of consideration:
- Traders long from the H4 support area at 0.6988-0.7019 will likely seek a H4 close above yesterday’s high at 0.7076 before reducing risk to breakeven, with many perhaps watching the 0.71 handle as a potential target zone.
USD/JPY:
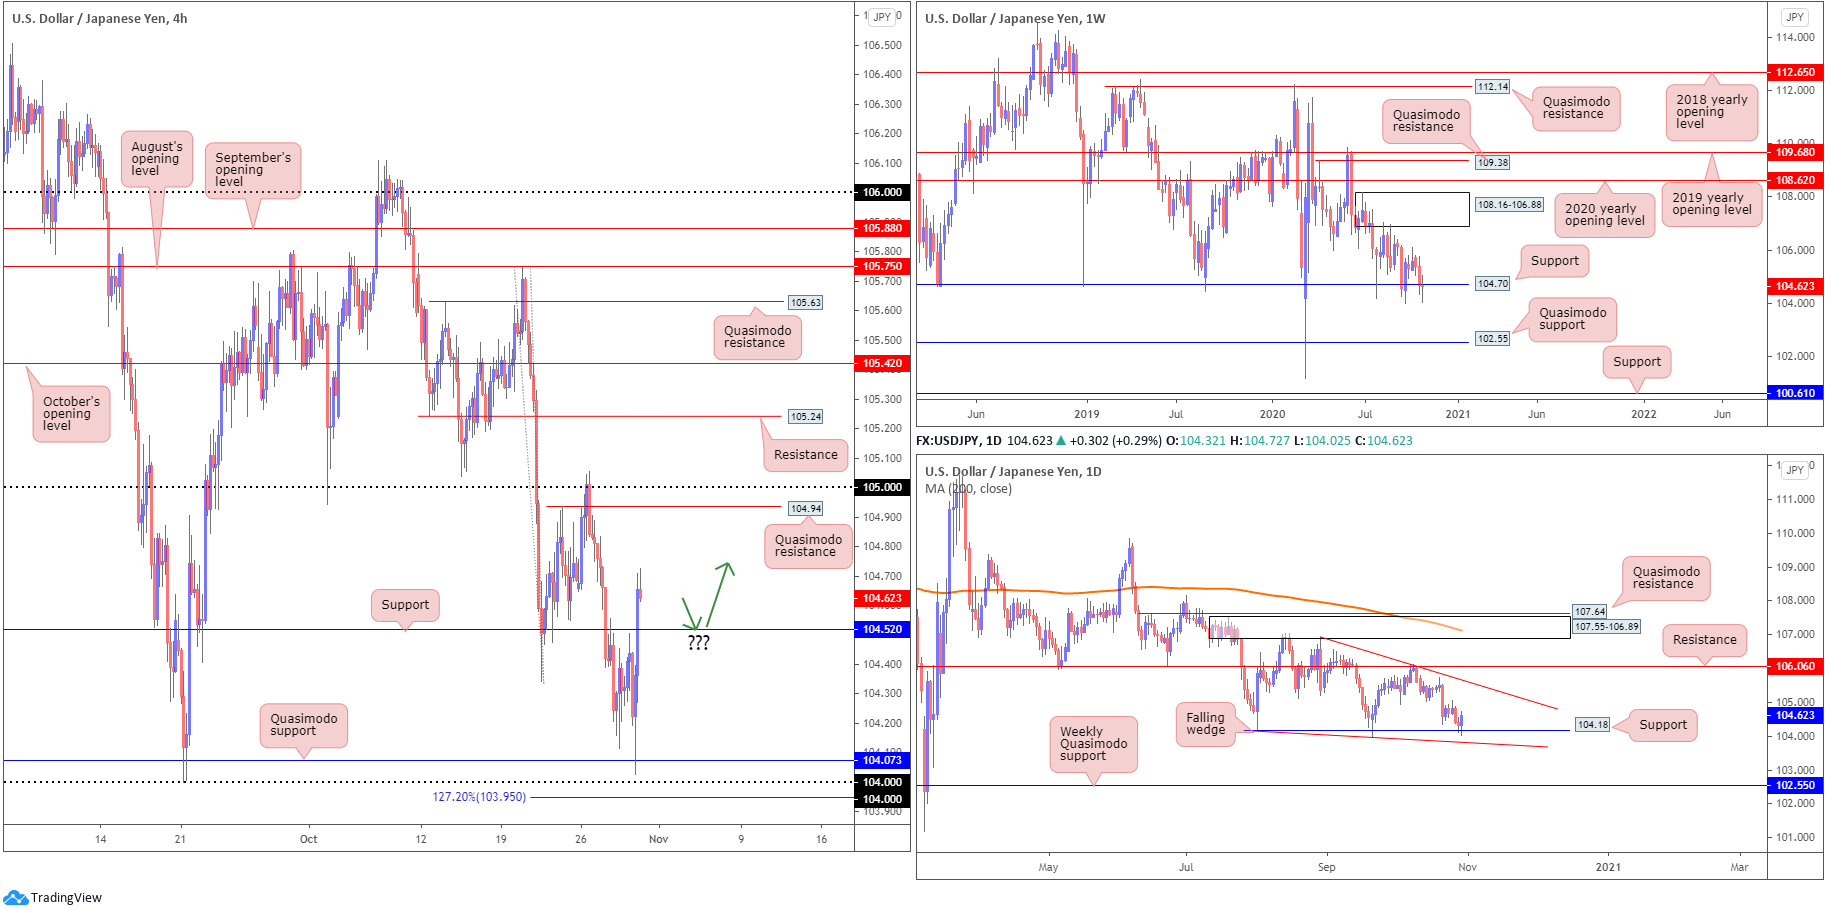
The US dollar staged a healthy comeback against the Japanese yen on Thursday, amid a recovery in risk sentiment and the US dollar index securing position north of 93.50.
Technically, we came off H4 Quasimodo support at 104.07, a level positioned closely to the 104 handle and a 127.2% Fibonacci projection point at 103.95. After clearing 104.50ish (resistance-turned support), H4 is approaching Quasimodo resistance plotted at 104.94, shadowed by the 105 handle.
What’s interesting from a technical perspective is we’re also rebounding from daily support coming in at 104.18, with daily flow smothering Wednesday’s candle (representing a bullish outside day reversal). Also worthy of attention is weekly price attempting to keep hold of support at 104.70.
Areas of consideration:
- A correction/retest at H4 support drawn from 104.52 today, given traders may recognise we’re coming from higher timeframe supports, could encourage a bullish scenario to target the 105 region. Do be aware that support levels should never be considered definite price levels, therefore a fakeout through support is a possibility before buyers show interest. Conservative traders are likely to want to see additional bullish candlestick confirmation before taking action.
USD/CAD:
USD/CAD had quite a day Thursday.
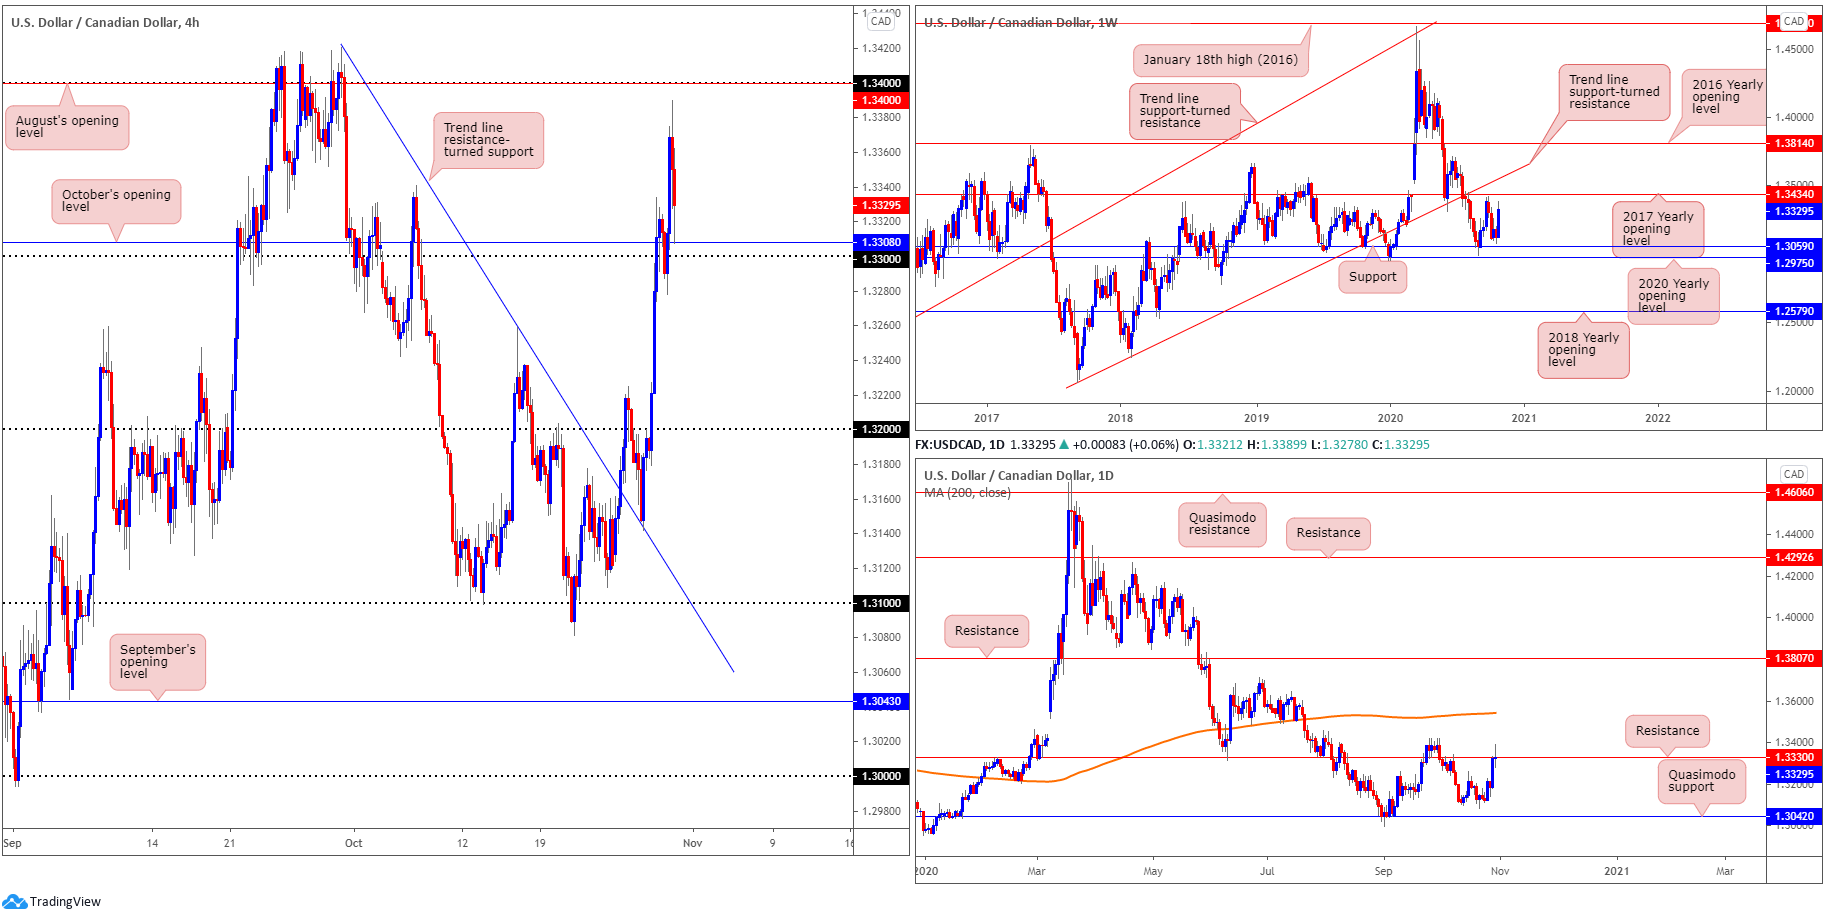
WTI tumbled to lows at $34.95 a barrel and the US dollar index found comfort above 93.50. This led USD/CAD to peaks at 1.3389, though in recent hours an aggressive correction unfolded, movement that retested October’s opening value at 1.3308 (sited just north of 1.33). Defending this level today shines the spotlight on yesterday’s peaks as well as the 1.34 handle (and August’s opening value).
Higher timeframe action, based on the weekly timeframe, exhibits scope to approach the 2017 yearly opening value at 1.3434, after missing support at 1.3059 earlier in the week. From the daily timeframe, however, buyers and sellers are battling for position around resistance at 1.3330. Breaching this level, although there are some tops to contend with around the 1.3420ish neighbourhood, could see buyers hone in on the 200-day SMA (orange – 1.3542).
Areas of consideration:
- Overall, seeing room for weekly price to push beyond 1.34, we could have H4 bullish scenarios take shape off October’s opening value at 1.3308/the 1.33 handle.
- A decisive dip through the 1.33 region, on the other hand, helps confirm bearish intent off daily resistance, therefore swinging the pendulum in favour of a bearish follow-through to around the 1.32 level.
USD/CHF:
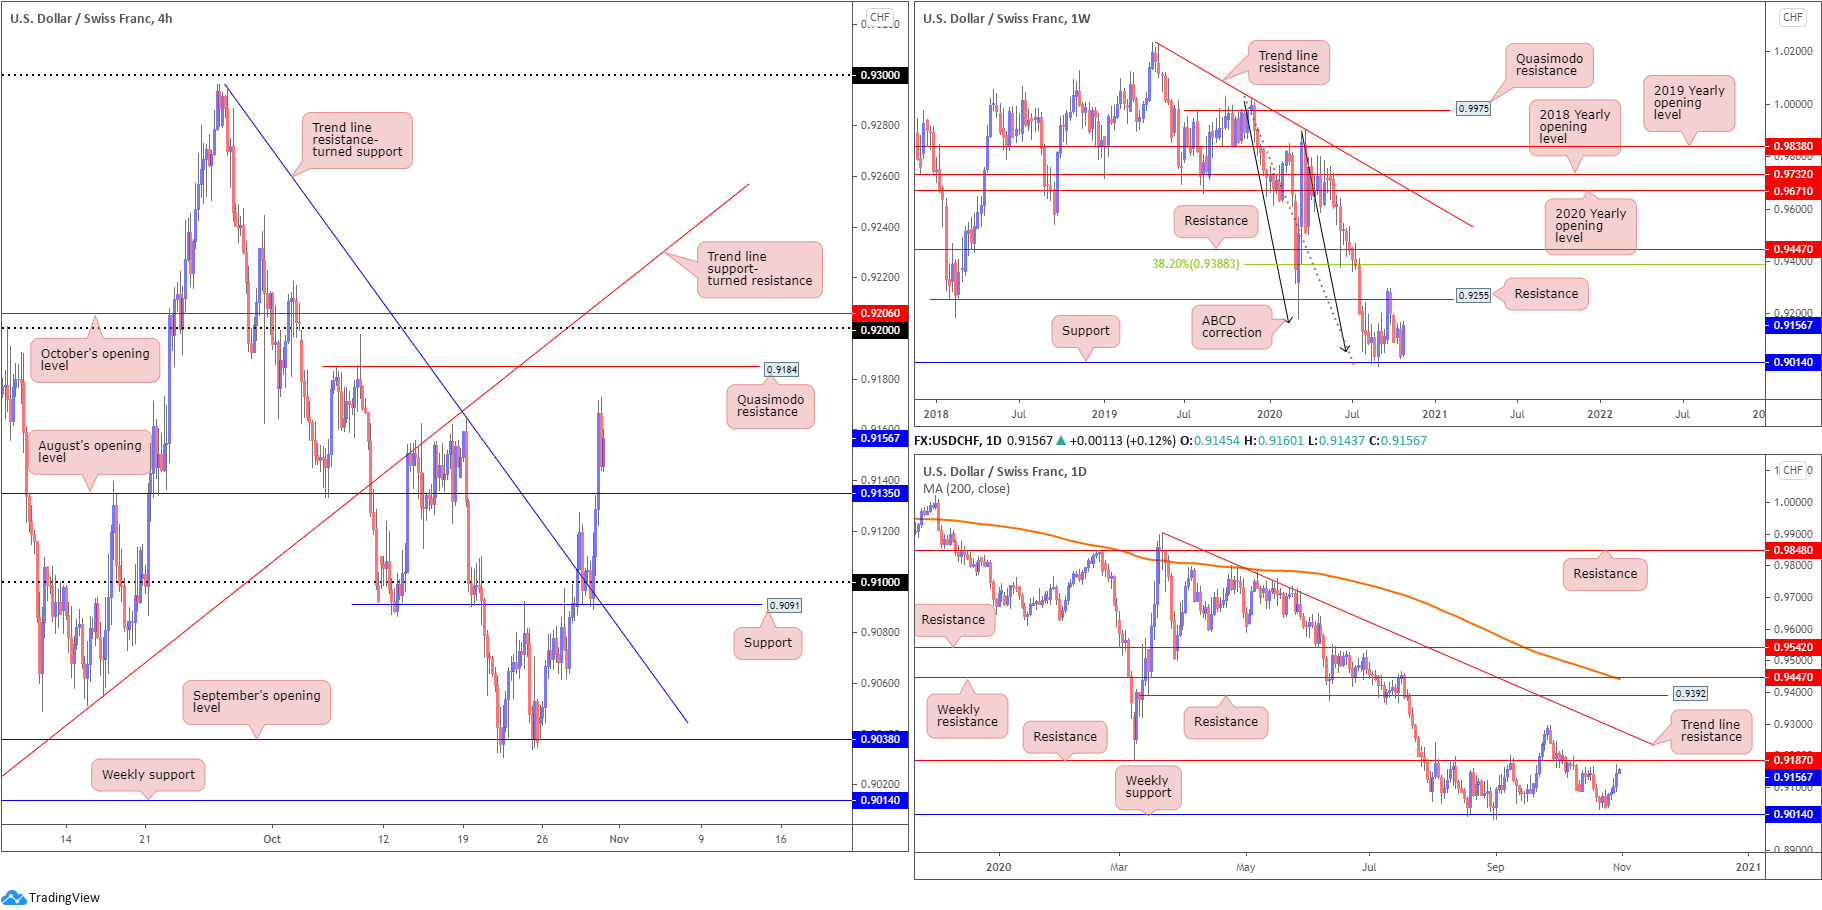
Following a short-lived retest at 0.91 (assisted by H4 support at 0.9091 and trend line resistance-turned support [0.9295]), USD/CHF bulls entered a strong offensive phase Thursday, overthrowing August’s opening value at 0.9135 and grasping highs at 0.9172.
Registering a fourth consecutive daily gain, H4 has eyes on Quasimodo resistance at 0.9184, closely followed by the 0.92 handle and October’s opening value at 0.9206.
Further afield, this week has witnessed weekly price reclaim the previous week’s losses ahead of support at 0.9014. For those who read previous analysis on this pair, you will also note current support is bolstered by ABCD support at 0.9051 (black arrows). Further buying throws resistance at 0.9255 back into the spotlight.
The story on the daily timeframe reveals we’re closing in on resistance coming in at 0.9187, with a break exposing trend line resistance, extended from the high 0.9901.
Areas of consideration:
- Retesting August’s opening value at 0.9135 could be a scenario we see play out today, possibly interesting buyers, with room to advance to H4 Quasimodo resistance at 0.9184 (and also space to rally on the higher timeframes).
- Should a rally come to pass, bearish themes are also possible off H4 Quasimodo resistance at 0.9184, as traders will likely recognise the level converges with daily resistance at 0.9187.
Dow Jones Industrial Average:
US equity benchmarks finished Thursday higher across the board at the close of trade.
The Dow Jones Industrial Average added 139.16 points, or 0.52%, the S&P 500 advanced 39.08 points, or 1.19% and the Nasdaq traded higher by 180.72 points, or 1.64%.
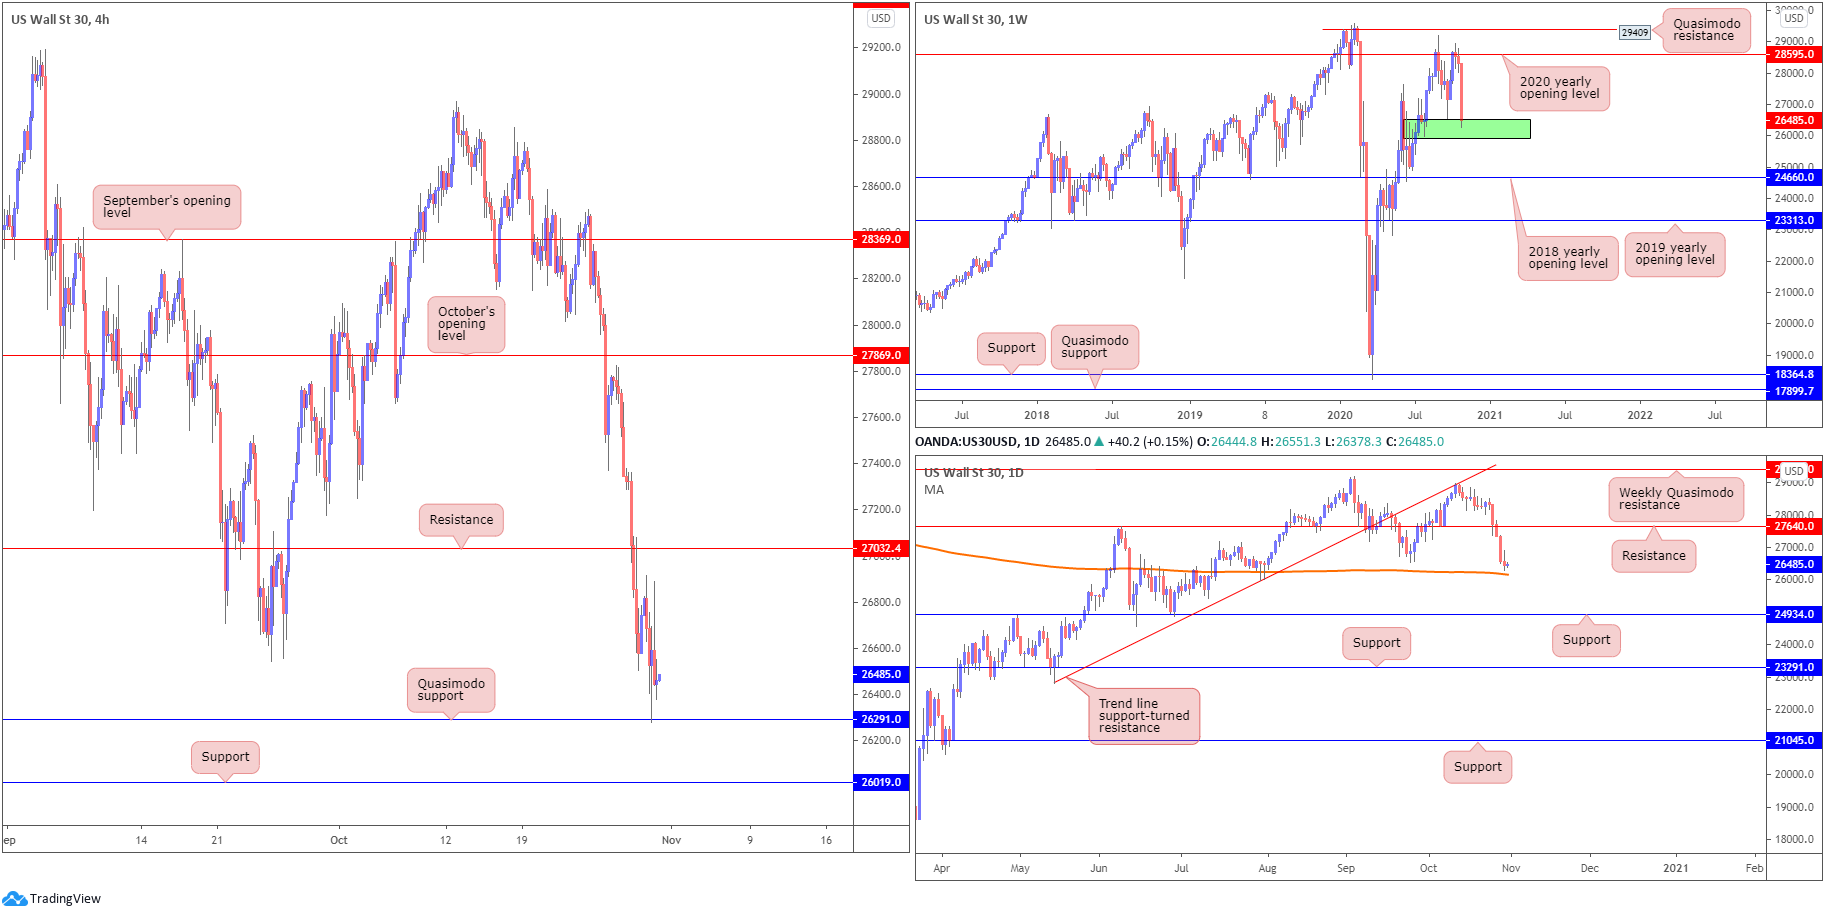
Down more than 6% this week, weekly price is seen occupying the upper base of demand at (green) 25916-26523, which if a break eventually comes to pass could direct price flow towards the 2018 yearly opening value at 24660. Alongside the weekly demand area, we can also see daily price approaching the 200-day SMA (orange – 26162). Support at 24934, however, is next on tap should sellers remain in the driving seat.
Quasimodo support on the H4 timeframe at 26291 recently became active, a level which if violated could lead to the H4 candles approaching support at 26019. A 26291 rejection, on the other hand, possibly draws resistance at 27032 into the fray.
Areas of consideration:
- H4 Quasimodo support at 26291, knowing the area shares space with weekly demand at 25916-26523, could be enough to entice a recovery attempt today.
- Dropping lower, nevertheless, the 200-day SMA is seen nearby at 26162, with H4 support plotted just beneath it at 26019, a location buyers may also emerge from.
XAU/USD (GOLD:
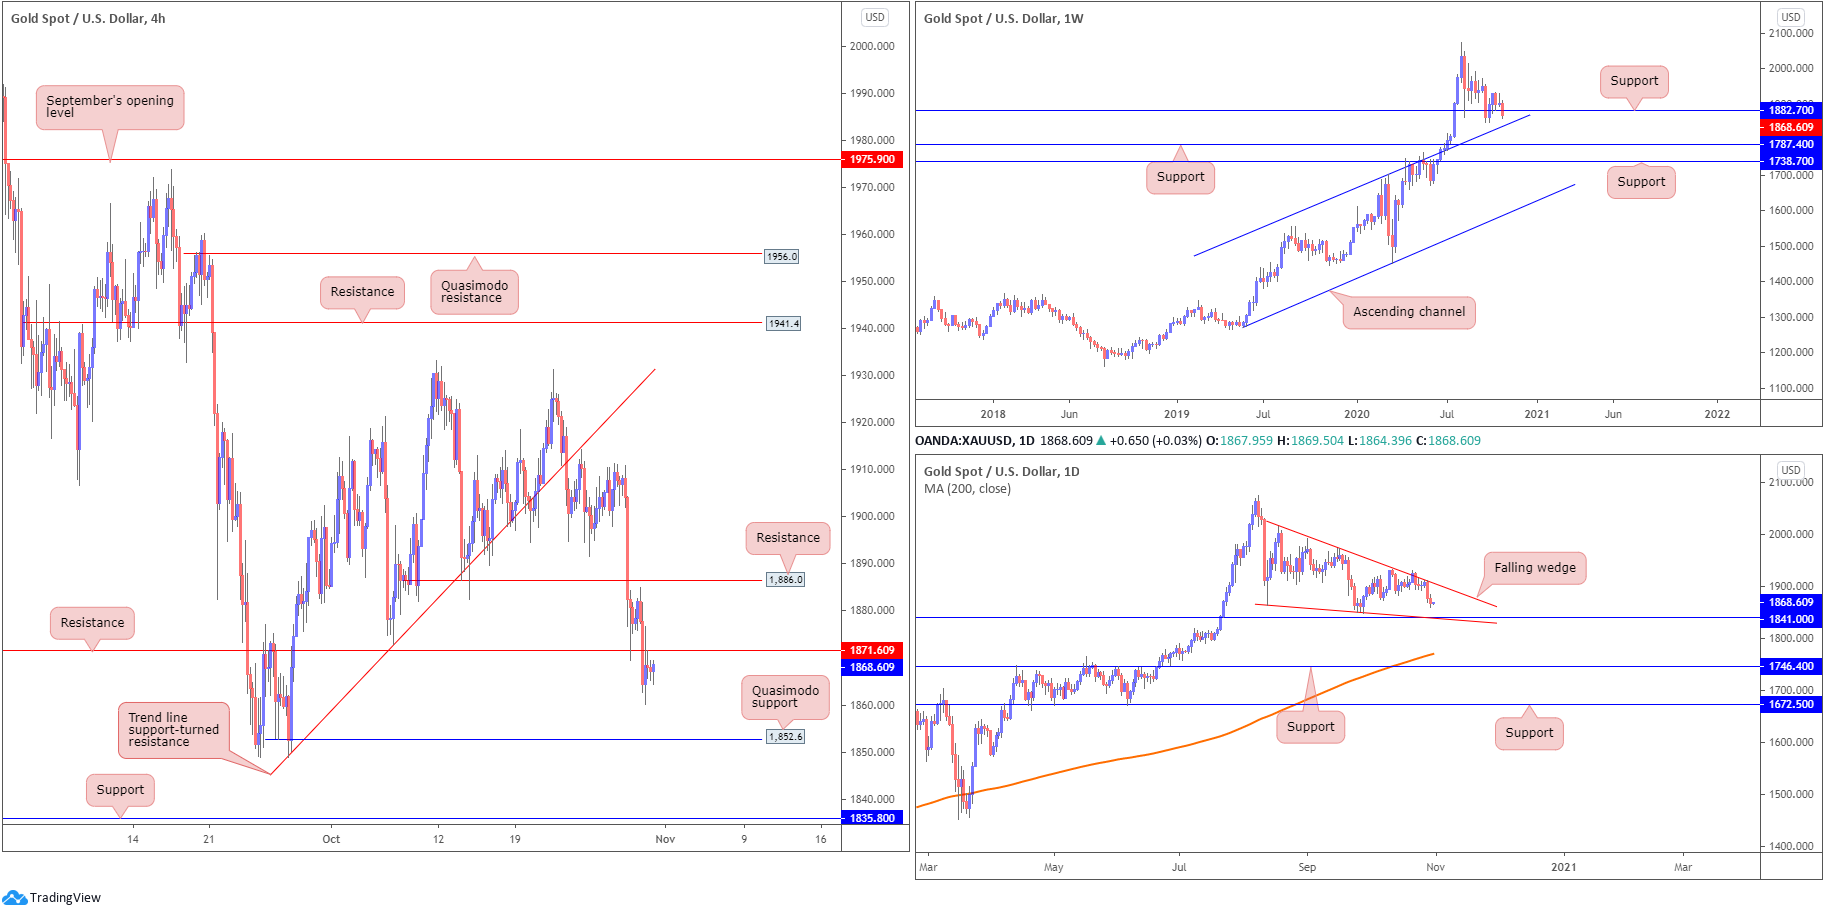
From the weekly timeframe, the precious metal dipped through support at $1,882 in recent trading and is now within striking distance of channel resistance-turned support, taken from the high $1,703. Traders are also urged to pencil in supports at $1,787 and $1,738 in the event buyers fail to make an appearance.
The daily timeframe, however, appears to be in the process of creating a falling wedge pattern between $2,015 and $1,862 (the lower boundary also lines up closely with support at $1,841), which may be interpreted as a continuation signal in the event of a breakout north.
The technical landscape on the H4 chart shows price pushed through support at $1,871 on Thursday and, as you can see, retested the level as resistance. This, from a technical perspective, unbolted the trapdoor for a possible run to Quasimodo support at $1,852.
Areas of consideration:
- Higher timeframes demonstrate room to explore lower levels right now, consequently highlighting a potential bearish theme off H4 resistance from $1,871, targeting at least Quasimodo support at $1,852. Conservative sellers, those concerned by the fact gold remains entrenched within a clear-cut uptrend at the moment, may consider waiting for additional H4 (or H1) candlestick confirmation before taking action.
The accuracy, completeness and timeliness of the information contained on this site cannot be guaranteed. IC Markets does not warranty, guarantee or make any representations, or assume any liability regarding financial results based on the use of the information in the site.
News, views, opinions, recommendations and other information obtained from sources outside of www.icmarkets.com.au, used in this site are believed to be reliable, but we cannot guarantee their accuracy or completeness. All such information is subject to change at any time without notice. IC Markets assumes no responsibility for the content of any linked site.
The fact that such links may exist does not indicate approval or endorsement of any material contained on any linked site. IC Markets is not liable for any harm caused by the transmission, through accessing the services or information on this site, of a computer virus, or other computer code or programming device that might be used to access, delete, damage, disable, disrupt or otherwise impede in any manner, the operation of the site or of any user’s software, hardware, data or property


