
EUR/USD:
Despite final US GDP for Q4 recording a lower-than-expected figure, the US dollar prodded its way to higher ground Thursday, registering a third consecutive daily gain and conquering its 97.00 psychological mark (US dollar index). While some desks are suggesting the dollar’s rally is a function of dovish signs from other central banks, recent upside has, unquestionably, weighed on the single currency, similarly trading in the red for a third successive session by 0.17%.
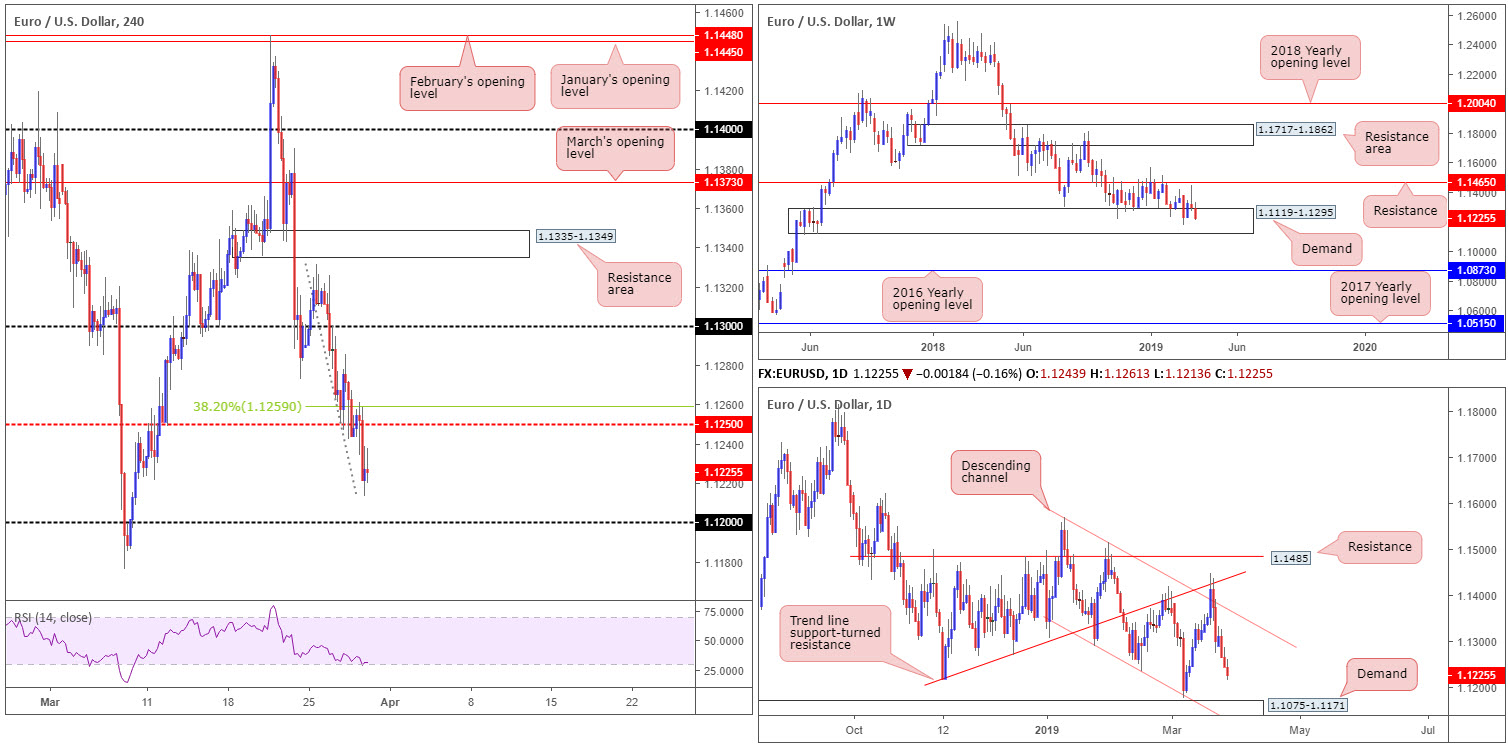
As highlighted in previous reports, the research team underlined the possibility of further selling taking shape on the H4 timeframe, targeting the 1.12 handle. Nursing yesterday’s losses 20 points north of 1.12, where do traders go from here?
Weekly price remains tunnelling its way through demand coming in at 1.1119-1.1295. Overall, the long-term trend on the weekly timeframe continues to face a southerly direction, with traders’ crosshairs now likely fixed on 1.1176: the 2019 yearly low. The next area of interest beyond the current demand, however, falls in around the 2016 yearly opening level priced in at 1.0873.
Upon closer investigation, the daily timeframe shows price action gearing up to challenge demand at 1.1075-1.1171, after fading (albeit following a minor fakeout north) the upper limit of a descending channel (high: 1.1569 low: 1.1289) last week. Note this demand area is sited a few points south of the yearly low mentioned above at 1.1176 and also positioned a handful of points beneath the round number 1.12 highlighted on the H4 timeframe.
Areas of consideration:
By all counts, the pendulum appears to be swinging in favour of further selling today, at least until connecting with 1.12. A pullback to the 1.1250 point on the H4 timeframe, which happens to be shadowed closely by a 38.2% H4 Fibonacci resistance level at 1.1259, may function as a valid platform to sell today. A handsome H4 (or H1) bearish candlestick pattern (entry/risk levels can be determined according to this structure) printed from this neighbourhood would, in light of the overall picture, certainly add weight to a move being seen lower from here.
Traders also want to keep 1.1171/1.12 in view as a potential area buyers may occupy. Recall, not only do we have the top edge of daily demand present here at 1.1171, we also have the market’s yearly low lurking at 1.1176.
Today’s data points: US Core PCE Price Index m/m; US Personal Spending m/m; Chicago PMI; US Revised UoM Consumer Sentiment; FOMC Member Quarles Speaks.
GBP/USD:
UK PM May is set to push ahead with a critical vote on part of her Brexit deal today – the Withdrawal Agreement, though government will exclude the political declaration dealing with Britain’s future relations with the EU. Concerns over Britain’s exit, alongside a robust US dollar and strengthening Treasury yields, elbowed the British pound considerably lower Thursday, down more than 1.00% vs. its US counterpart.
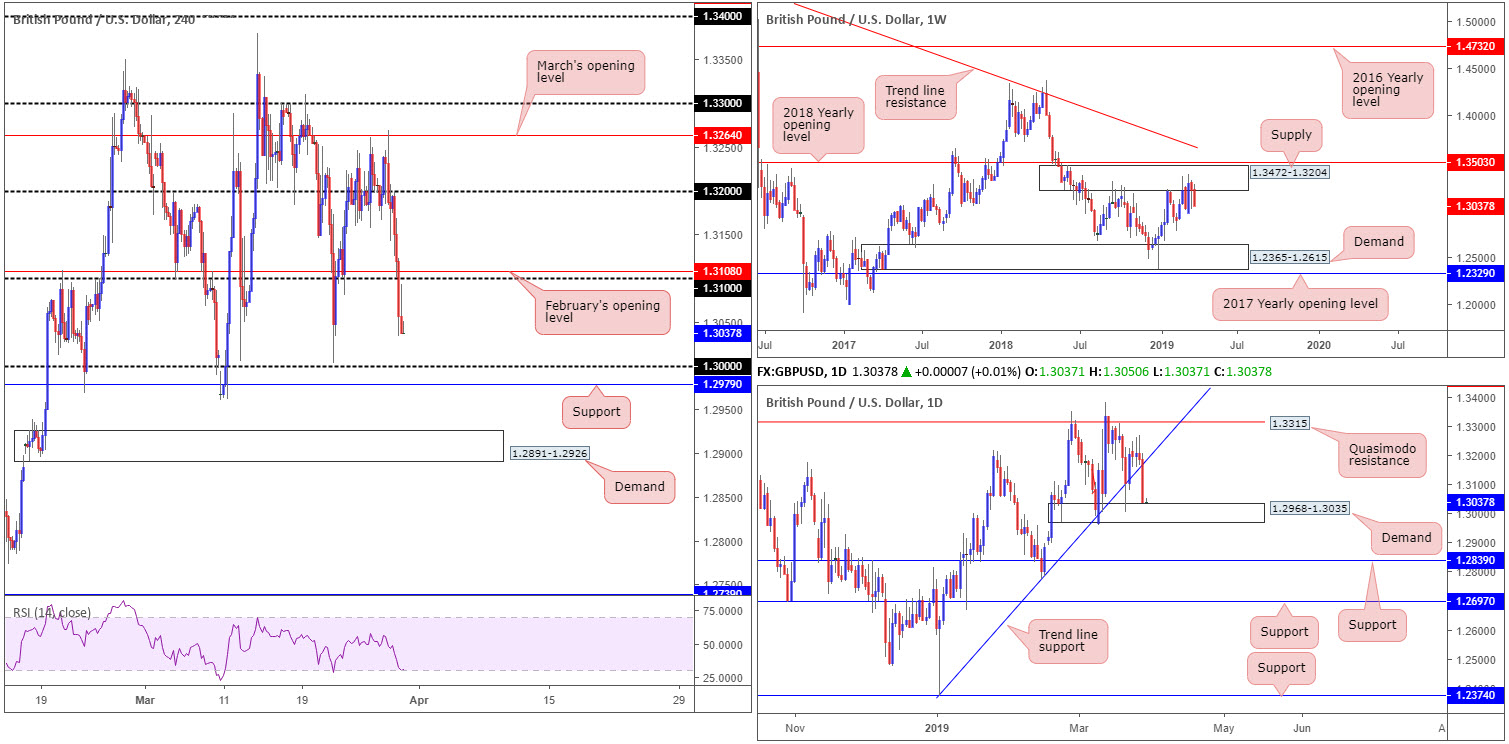
Tech flows have the H4 candles languishing beneath 1.31, poised to revisit key figure 1.30 and nearby support priced in at 1.2979. Beyond here, traders are potentially eyeing a rather sexy demand base coming in at 1.2891-1.2926. It might also interest some traders to note the RSI indicator is seen testing its oversold value.
Decorating the weekly chart is supply drawn from 1.3472-1.3204. Since the end of February this has been home to many traders as price continues to flip between gains/losses. According to structure on this timeframe, yesterday’s bout of selling should not have come as a surprise, with the next OBVIOUS downside target not seen on this timeframe until demand at 1.2365-1.2615. Closer analysis of the daily timeframe, nevertheless, has the pair shaking hands with the top edge of demand at 1.2968-1.3035, following yesterday’s strong break of trend line support (extended from the low 1.2373).
Areas of consideration:
Between 1.2979 (the H4 support mentioned above) and key figure 1.30 on the H4 timeframe is a region buying may arise, as the zone resides within the walls of the current daily demand zone underlined above at 1.2968-1.3035. In view of political events due to take place today, and the weekly timeframe pointing to lower levels, traders are urged to seek additional trading confirmation before pulling the trigger for a long out of 1.2979/1.30. Confirmation can be used to shed light on buyer intent and govern entry and risk levels, with 1.32 as the next upside target.
Today’s data points: UK Current Account; UK Final GDP q/q; UK Net Lending to Individuals m/m; US Core PCE Price Index m/m; US Personal Spending m/m; Chicago PMI; US Revised UoM Consumer Sentiment; FOMC Member Quarles Speaks.
AUD/USD:
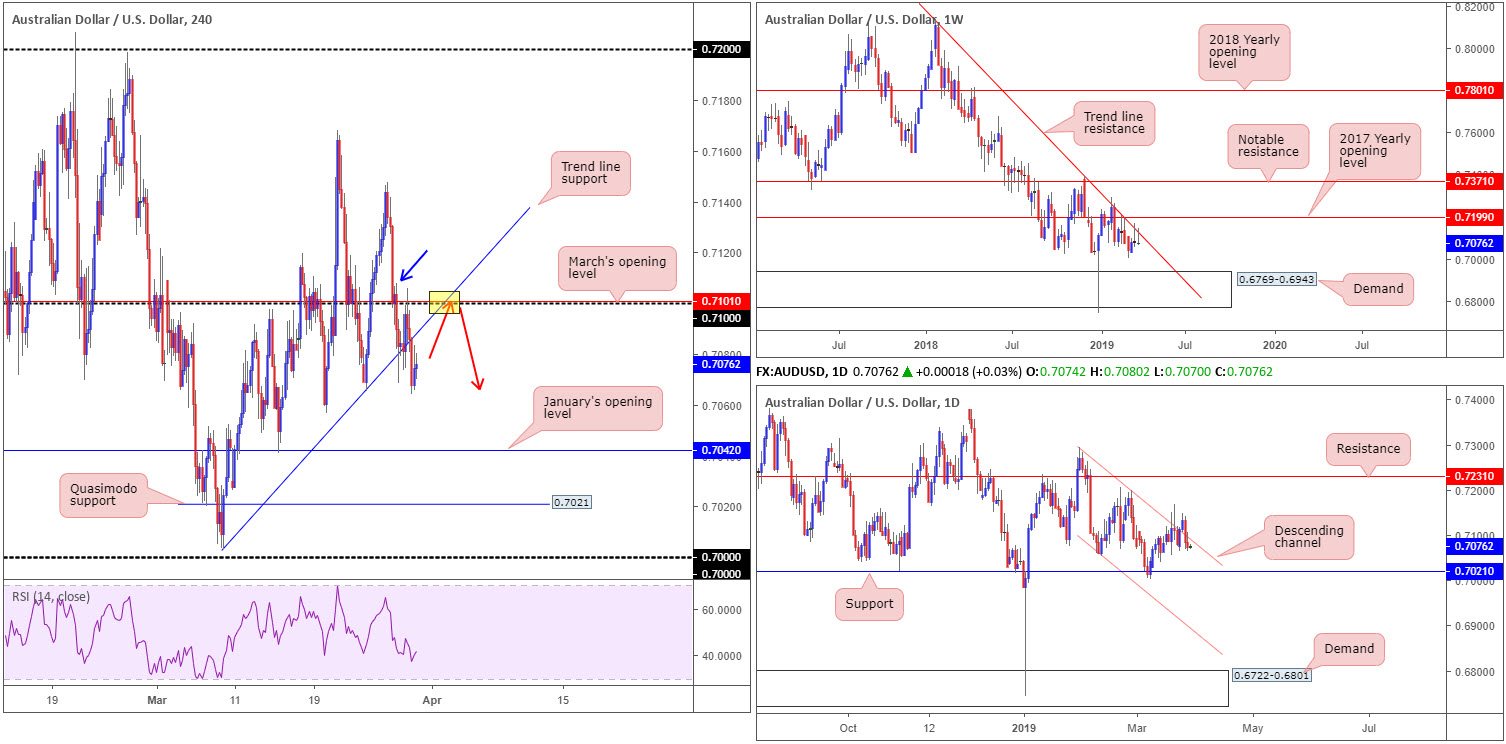
Having seen US Treasury yields and the US dollar gain traction for a third consecutive day Thursday, the Australian dollar struggled to sustain gains beyond its key figure 0.71 (March’s opening level at 0.7101) on the H4 timeframe and concluded the day engulfing nearby trend line support (extended from the low 0.7003). Potentially setting the stage for a push towards January’s opening level at 0.7042 today/next week, shadowed by Quasimodo support at 0.7021, traders are likely targeting shorts on this timeframe today.
Increasing our vision to weekly structure reveals the unit is testing the underside of a long-standing trend line resistance (etched from the high 0.8135), currently trading in the shape of a bearish pin-bar formation. The market could observe additional selling take shape from here as downside appears reasonably free until connecting with demand at 0.6769-0.6943.
In conjunction with weekly flow, the daily timeframe crossed back into a descending channel pattern Wednesday (high: 0.7295 low: 0.7060) and remained in play Thursday. On the assumption sellers remain in the driving seat, the next downside target in sight is support coming in at 0.7021.
Areas of consideration:
In light of recent moves on the higher timeframes, and break beneath the current H4 trend line support, this shines the spotlight on a retest play either off the underside of the recently broken trend line or 0.71. Trading the point at which both structures merge (yellow) is ideal.
Traders have the choice of entering short at 0.71ish (assuming you wait for the point at which both aforesaid structures merge) and placing stop-loss orders above a nearby supply at 0.7108 (blue arrow). Traders looking to add a little more confirmation to the mix, nonetheless, may opt to wait for a bearish candlestick signal to emerge before pressing the sell button (entry and risk levels can be decided according to the pattern’s rules of engagement).
Today’s data points: US Core PCE Price Index m/m; US Personal Spending m/m; Chicago PMI; US Revised UoM Consumer Sentiment; FOMC Member Quarles Speaks.
USD/JPY:
Outlook unchanged.
A modest gain in US Treasuries and the US dollar climbing higher for a third straight session lifted the USD/JPY northbound amid London and US hours Thursday.
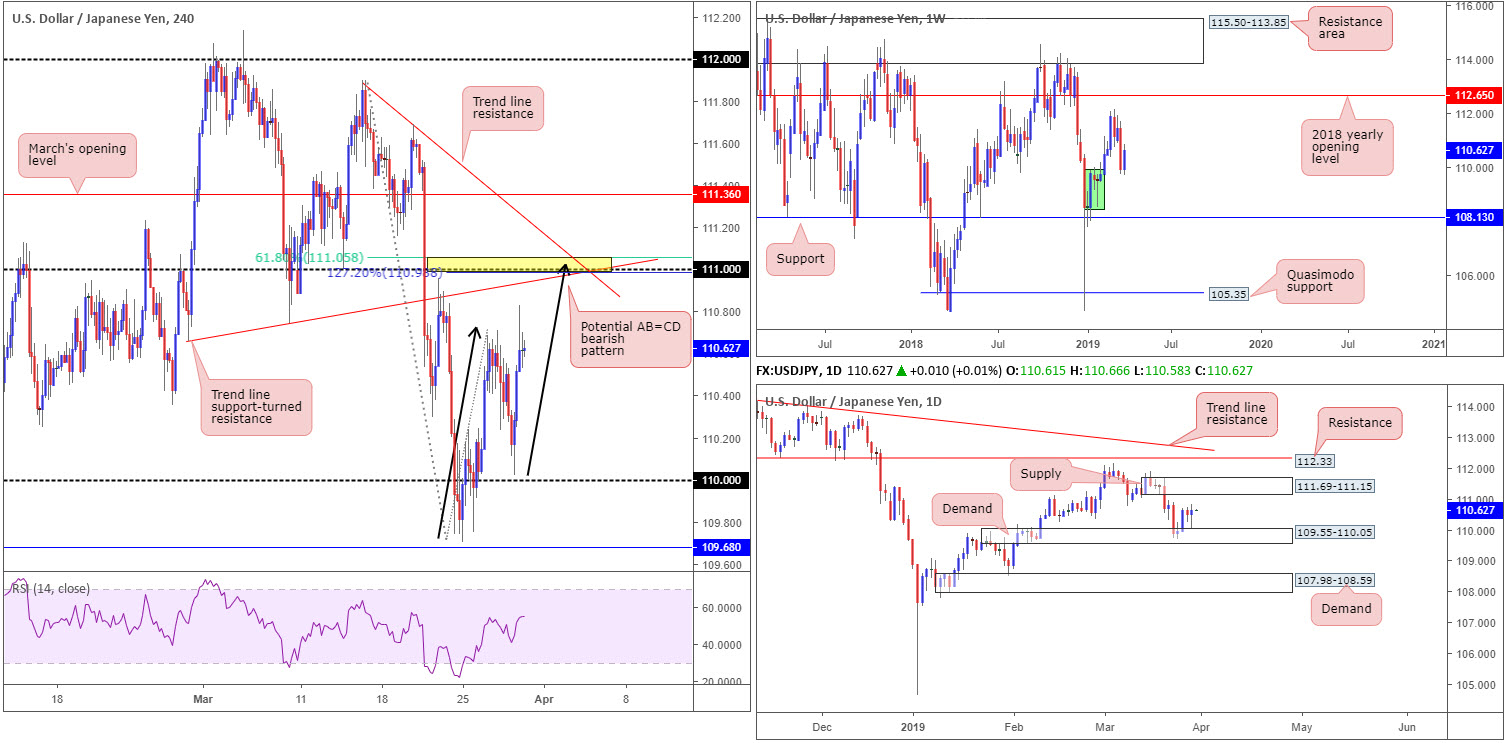
Testing the top edge of daily demand at 109.55-110.05, H4 action is now seen trading within close proximity to 111, which is a level the research team still favours as strong resistance. This psychological number, marked yellow, boasts a merging AB=CD 127.2% bearish pattern at 110.98 (black arrows), a trend line support-turned resistance (drawn from the low 110.66), another trend line resistance (from the high 111.90) and a 61.8% Fibonacci resistance at 111.05. What’s also notable from 111 is the lower edge of a daily supply is seen overhead at 111.69-111.15.
Areas of consideration:
Although the market ranged more than 80 points on the day, the team’s outlook remains unchanged going forward.
Keeping it simple this morning, the 111 handle is, according to our markings, a high probability sell zone with a healthy dose of H4 and daily confluence.
Entry at 111.00 with the stop-loss order set at 20 points is an option, though some traders may prefer waiting for additional confirmation which will likely offer different entry and exit parameters. Ultimately, the last demand formed on approach to 111 should be considered as a first port of call in terms of taking profit and reducing risk to breakeven.
Today’s data points: US Core PCE Price Index m/m; US Personal Spending m/m; Chicago PMI; US Revised UoM Consumer Sentiment; FOMC Member Quarles Speaks.
USD/CAD:
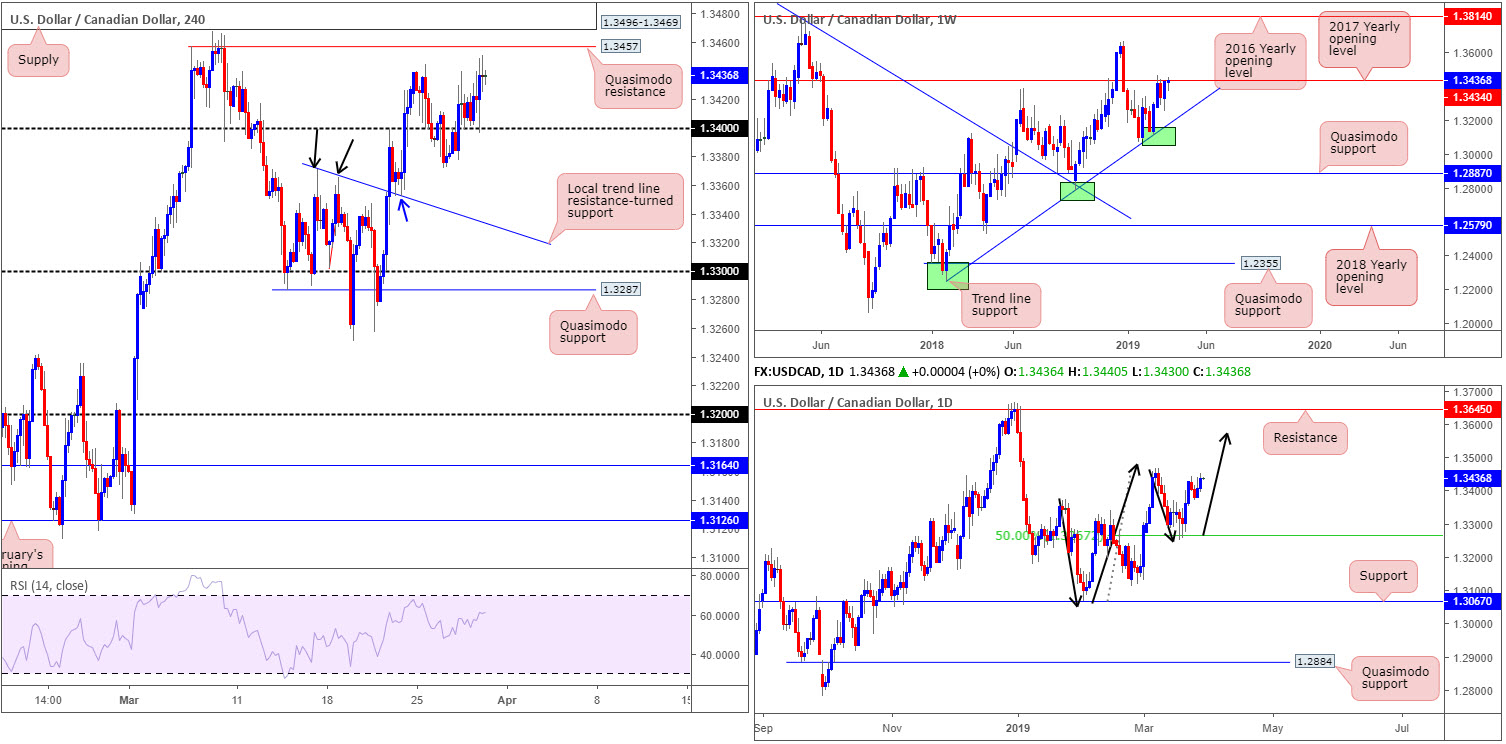
WTI sliding to a session low at $58.23 and the US dollar index swallowing its 97.00 mark to the upside, saw USD/CAD bulls press higher for a second consecutive session Thursday, up 0.21%.
Weekly players are attempting to push aside bulky resistance at 1.3434: the 2017 yearly opening level. In the event the buyers succeed, the 1.3664 Dec 31 (2018) high appears next in line as viable resistance, followed by the 2016 yearly opening level at 1.3814. On the other side of the spectrum, daily action indicates it may be poised to approach higher ground. The higher high sported on March 7th at 1.3467 followed by a 50.0% retracement to 1.3265 which held firm, places the buyers in good stead to overthrow the said high and possibly discover higher levels.
H4 trade observed the pair revisit its 1.34 handle before exploring higher ground yesterday. Further buying is difficult on this scale, with overhead resistance residing close by in the shape of a Quasimodo formation at 1.3457 along with a nearby supply zone coming in at 1.3496-1.3469.
Areas of consideration:
With reasonably durable resistance overhead on the H4 timeframe, as well as weekly and buyers yet to make a concrete push over their respective resistance, it may not be the best time to consider buying this market.
In fact, the research team feels a short from the H4 Quasimodo resistance mentioned above at 1.3457 may be in store, positioning stop-loss orders above H4 supply at 1.3496-1.3469 (conservative) and targeting 1.34 as an initial take-profit zone.
Today’s data points: US Core PCE Price Index m/m; US Personal Spending m/m; Chicago PMI; US Revised UoM Consumer Sentiment; FOMC Member Quarles Speaks; Canadian GDP m/m and RMPI m/m.
USD/CHF:
Outlook unchanged.
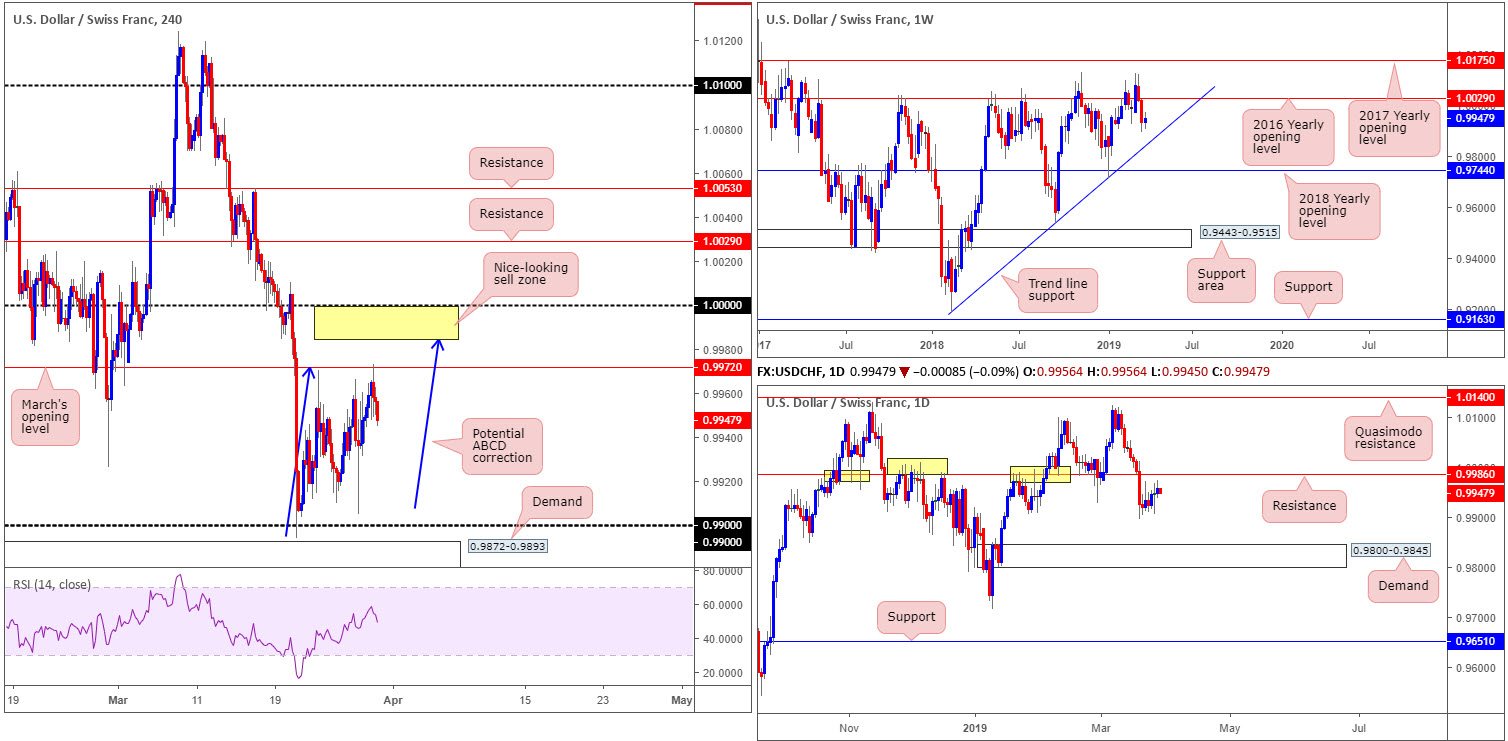
Despite the USD/CHF registering a third consecutive gain Thursday, heading into Asia Pac we can see recent gains dwindling as H4 price action continues to decline from March’s opening level at 0.9972. On the whole, the research team believes downside is limited, given the 1.0000 (parity) key figure likely to act as a magnet to price.
In terms of support, the round number at 0.99 is in sight, as is nearby demand plotted at 0.9872-0.9893. It might also interest some traders to note a potential bearish ABCD (blue arrows) correction pattern that’s seen terminating a few points south (0.9985) of 1.0000.
In terms of where the market stands on the weekly timeframe this morning, price action remains poised to approach trend line support (taken from the low 0.9187) after having seen the unit push lower from the 2016 yearly opening level at 1.0029. Daily flow, aside from the 0.9905 Jan 28 low that’s holding as temporary support, also demonstrates potential to charge as far south as demand plotted at 0.9800-0.9845. Another possibility, of course, is a retest of nearby resistance coming in at 0.9986.
Areas of consideration:
The daily resistance mentioned above at 0.9986 is of interest as a possible sell zone. Traders may also like the fact it merges, assuming H4 price continues to push higher, with the ABCD bearish pattern mentioned above at 0.9985.
Between 1.0000 (parity) and 0.9985 (yellow), therefore, is a reasonably solid sell zone to have on the watchlist. As round numbers are prone to fakeouts, though, entering on additional confirmation is a point worth considering – entry and risk levels can then be determined according to your chosen confirmation method.
Today’s data points: US Core PCE Price Index m/m; US Personal Spending m/m; Chicago PMI; US Revised UoM Consumer Sentiment; FOMC Member Quarles Speaks.
Dow Jones Industrial Average:
As high-level trade talks kicked-off in Beijing, US stocks advanced Thursday with the DJIA ending the session up 0.44%.
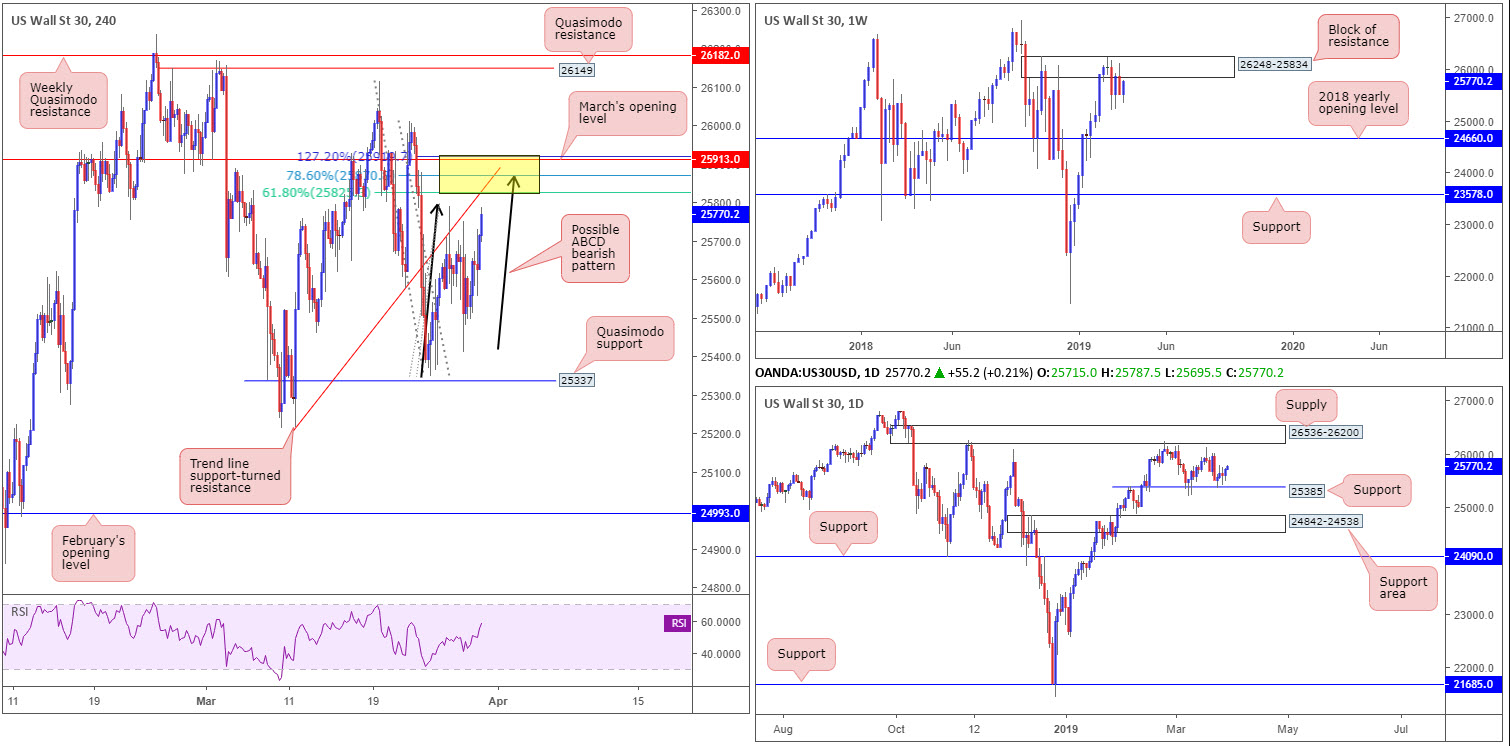
Looking at technical structure on the weekly timeframe, since early February traders have called a block of resistance at 26248-25834 home. Last week’s response from this barrier was of notable strength, closing not too far off its lows, though this has yet to generate much follow through so far this week. Further downside from this point could eventually see the index knocking on the door of its 2018 yearly opening level at 24660.
Support at 25385 on the daily timeframe elbowed its way into the fight Monday and extended gains Tuesday. Wednesday saw the unit mildly pullback from session highs at 25749 and form an indecision candle, though Thursday turned higher. A push beneath 25385 will likely bring in a nearby daily support area seen at 24842-24538.
Despite mixed vibes out of the bigger picture, a nice-looking area of confluence (yellow) on the H4 timeframe is seen between 25922/25828 (comprised of a trend line support-turned resistance [taken from the low 25215], a ABCD 127.2% bearish pattern at 25922, 61.8% and 78.6% Fibonacci resistances at 25828 and 25872, respectively, and March’s opening level at 25913). In addition to this, traders may also want to acknowledge within this area stands the lower edge of weekly resistance mentioned above at 25834.
Areas of consideration:
Entering short from within the yellow zone marked on the H4 timeframe at 25922/25828 is an option today should it be tested. Conservative traders will likely look for signs of seller intent before pulling the trigger – maybe a H4 bearish candlestick pattern, or even drilling down to the lower timeframes and trading local structure. Traders who feel the structure offered on the H4 timeframe, along with the lower edge of weekly resistance at 25834, is sufficient, may simply short at 25828ish and position stop-loss orders a few points beyond 25922.
Today’s data points: US Core PCE Price Index m/m; US Personal Spending m/m; Chicago PMI; US Revised UoM Consumer Sentiment; FOMC Member Quarles Speaks.
XAU/USD (GOLD):
A modest recovery observed in US Treasury yields Thursday pointed to improved market sentiment, subsequently weighing on traditional safe-haven markets.
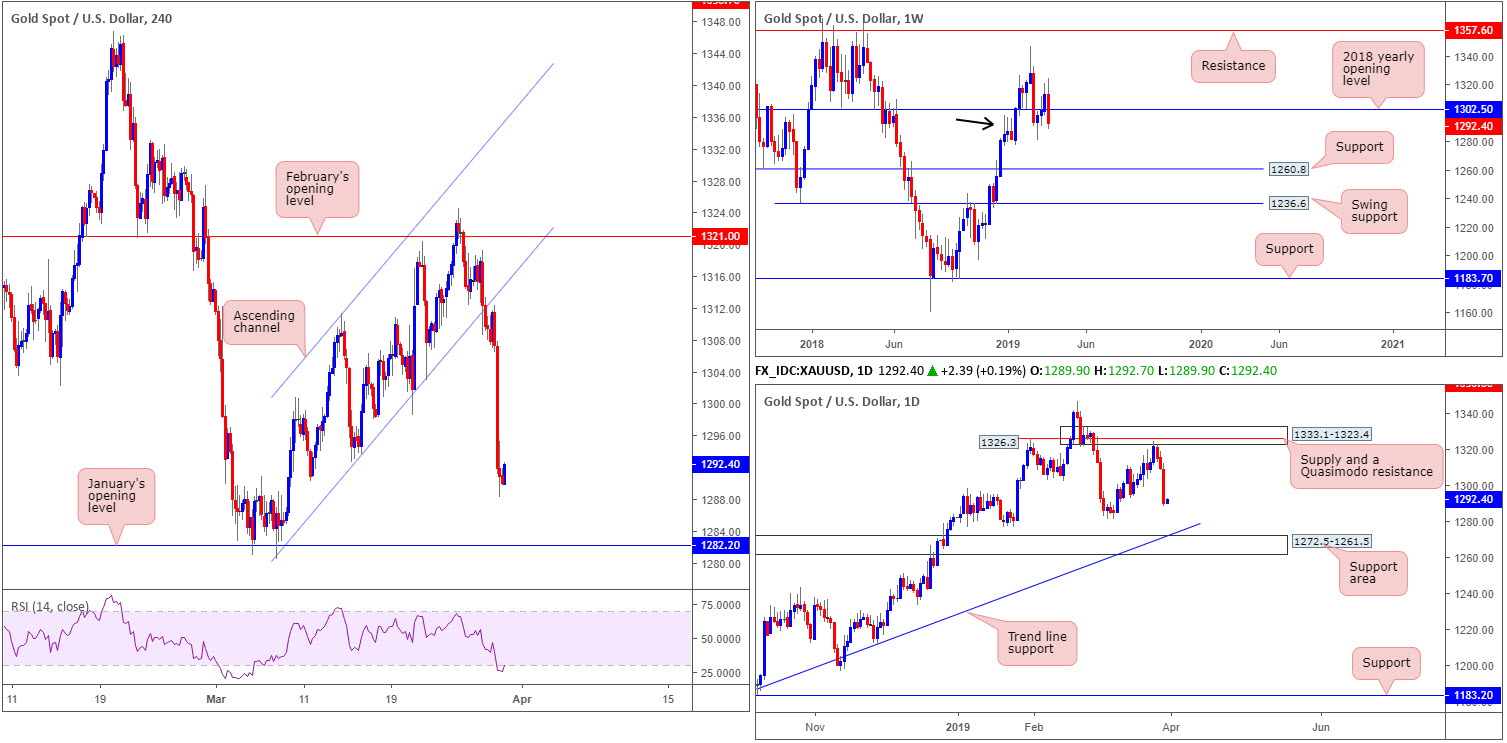
Down 1.50 per cent on the day, in the shape of a near-full-bodied daily bearish candle, H4 price is seen poised to challenge January’s opening level at 1282.2. Another point worth taking on board here is the RSI indicator seen testing oversold waters. Note on the daily timeframe, support is also visible at the 1281.0 March 7 low, followed by a support area at 1272.5-1261.5 and merging trend line support (extended from the low 1160.3).
On a wider perspective, weekly movement crossed beneath the 2018 yearly opening level at 1302.5, though demand (black arrow) is seen in motion at 1276.9-1295.8. A break south of this area has support at 1260.8 to target.
Areas of consideration:
As the yellow metal recently re-entered the jaws of weekly demand at 1276.9-1295.8, a bounce from January’s opening level on the H4 timeframe at 1282.2 and merging support seen at the 1281.0 March 7 low (daily timeframe) could be an option today.
An added bonus would be H4 price chalking up a candlestick signal off 1281.0/1282.2, consequently identifying buyer intent and also serving as a base to determine entry and risk levels.
The accuracy, completeness and timeliness of the information contained on this site cannot be guaranteed. IC Markets does not warranty, guarantee or make any representations, or assume any liability with regard to financial results based on the use of the information in the site.
News, views, opinions, recommendations and other information obtained from sources outside of www.icmarkets.com.au, used in this site are believed to be reliable, but we cannot guarantee their accuracy or completeness. All such information is subject to change at any time without notice. IC Markets assumes no responsibility for the content of any linked site. The fact that such links may exist does not indicate approval or endorsement of any material contained on any linked site.
IC Markets is not liable for any harm caused by the transmission, through accessing the services or information on this site, of a computer virus, or other computer code or programming device that might be used to access, delete, damage, disable, disrupt or otherwise impede in any manner, the operation of the site or of any user’s software, hardware, data or property.


