
Key risk events today:
German Prelim GDP q/q; Canada GDP m/m.
(Previous analysis as well as outside sources – italics).
EUR/USD:
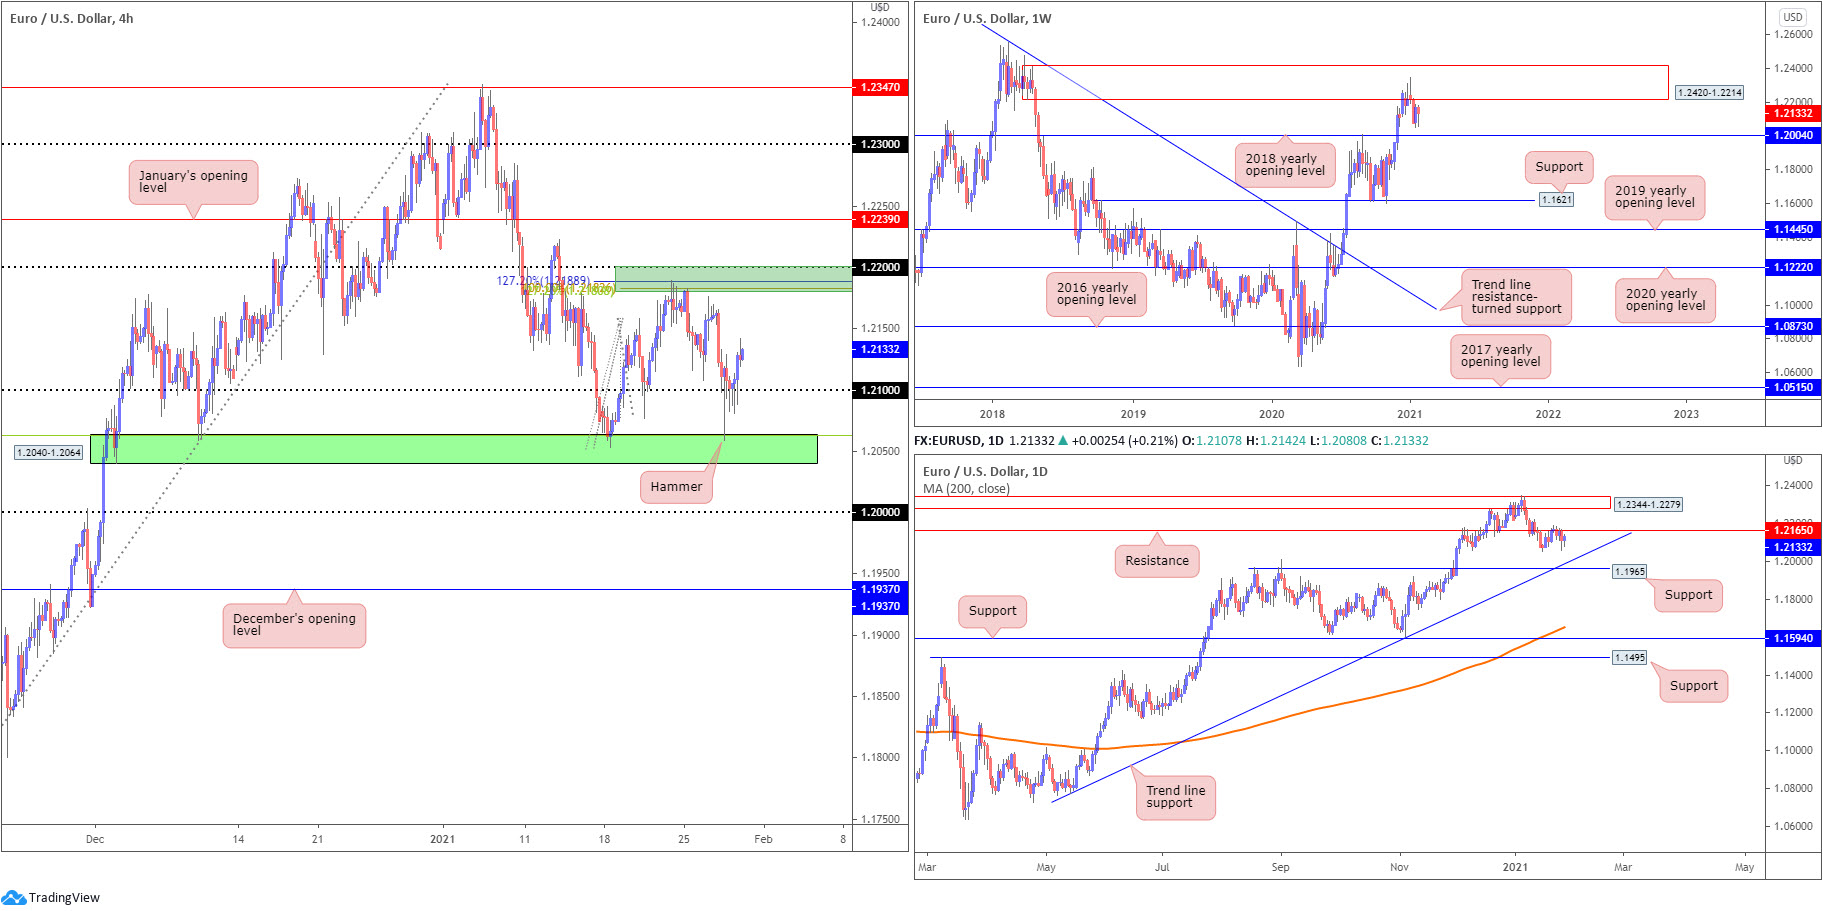
Amidst a broadly weak USD (a reaction to risk), Europe’s single currency clawed higher on Thursday. This followed Wednesday’s hammer pattern that whipsawed through 1.21 into the jaws of H4 demand at 1.2040-1.2064. Any sustained move north of 1.21 today throws H4 resistance at 1.22-1.2180 (composed of the 1.22 figure and a collection of Fibonacci ratios) back into the mix.
As noted in Thursday’s technical briefing (italics):
The 1.22 figure is also noteworthy resistance on the H4. This is due to the level fixed just south of the lower side of weekly supply at 1.2420-1.2214. Consequently, 1.2214-1.22 is an area to be watchful of.
Daily resistance at 1.2165—an active S/R level since June 2010—is a base also in the spotlight. Downside targets on the daily timeframe are seen at trend line support, taken from the low 1.0774, plotted just north of support at 1.1965, a previous Quasimodo resistance level. North of 1.2165, supply drawn from 1.2344-1.2279 (nestled within the walls of weekly supply mentioned above at 1.2420-1.2214) could work its way back in sight.
Areas of consideration:
- 21 (support) based on the H4 timeframe, though offers limited confluence.
- H4 resistance at 1.22-1.2180.
- The round number and weekly supply combination form possible resistance at 1.22-1.2214.
- Daily resistance at 1.1265.
GBP/USD:
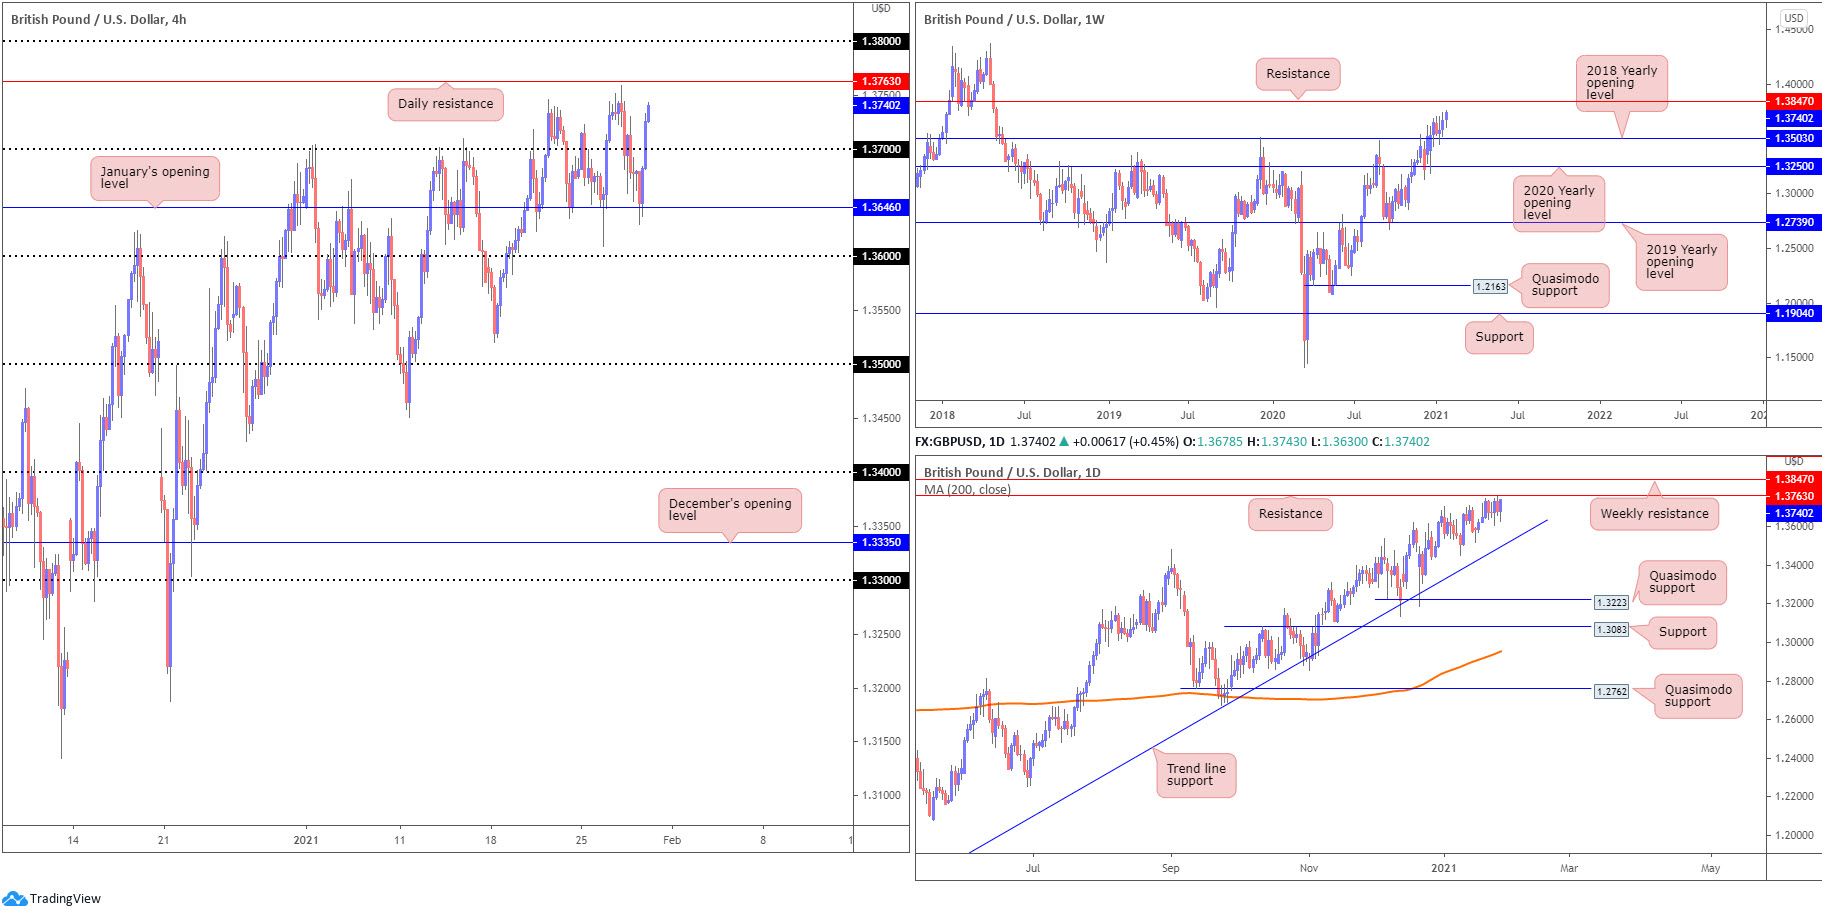
A decisive U-turn in risk appetite Thursday weighed on the USD and ultimately elevated GBP/USD from January’s opening value at 1.3646 on the H4 (a level that’s proven effective support over the last week). Recently overthrowing the 1.37 figure could have sterling refresh 2021 highs today and shake hands with daily resistance at 1.3763.
Further afield on the weekly timeframe, the unit is seen firmly off session lows. Support rests at 1.3503—the 2018 yearly opening value—while resistance is expected to make an appearance from 1.3847. That is, of course, if buyers muster enough strength to derail daily resistance mentioned above at 1.3763.
Areas of consideration:
- Retesting 1.37 as support on the H4 could spark additional bullish interest, in line with the current uptrend since early 2020. Upside targets fall in at 1.3763, 1.38 and 1.3847.
- Daily resistance at 1.3763 is a worthwhile note, with a break exposing weekly resistance at 1.3847.
AUD/USD:
Renewed USD softness invited some interesting moves on AUD/USD Thursday.
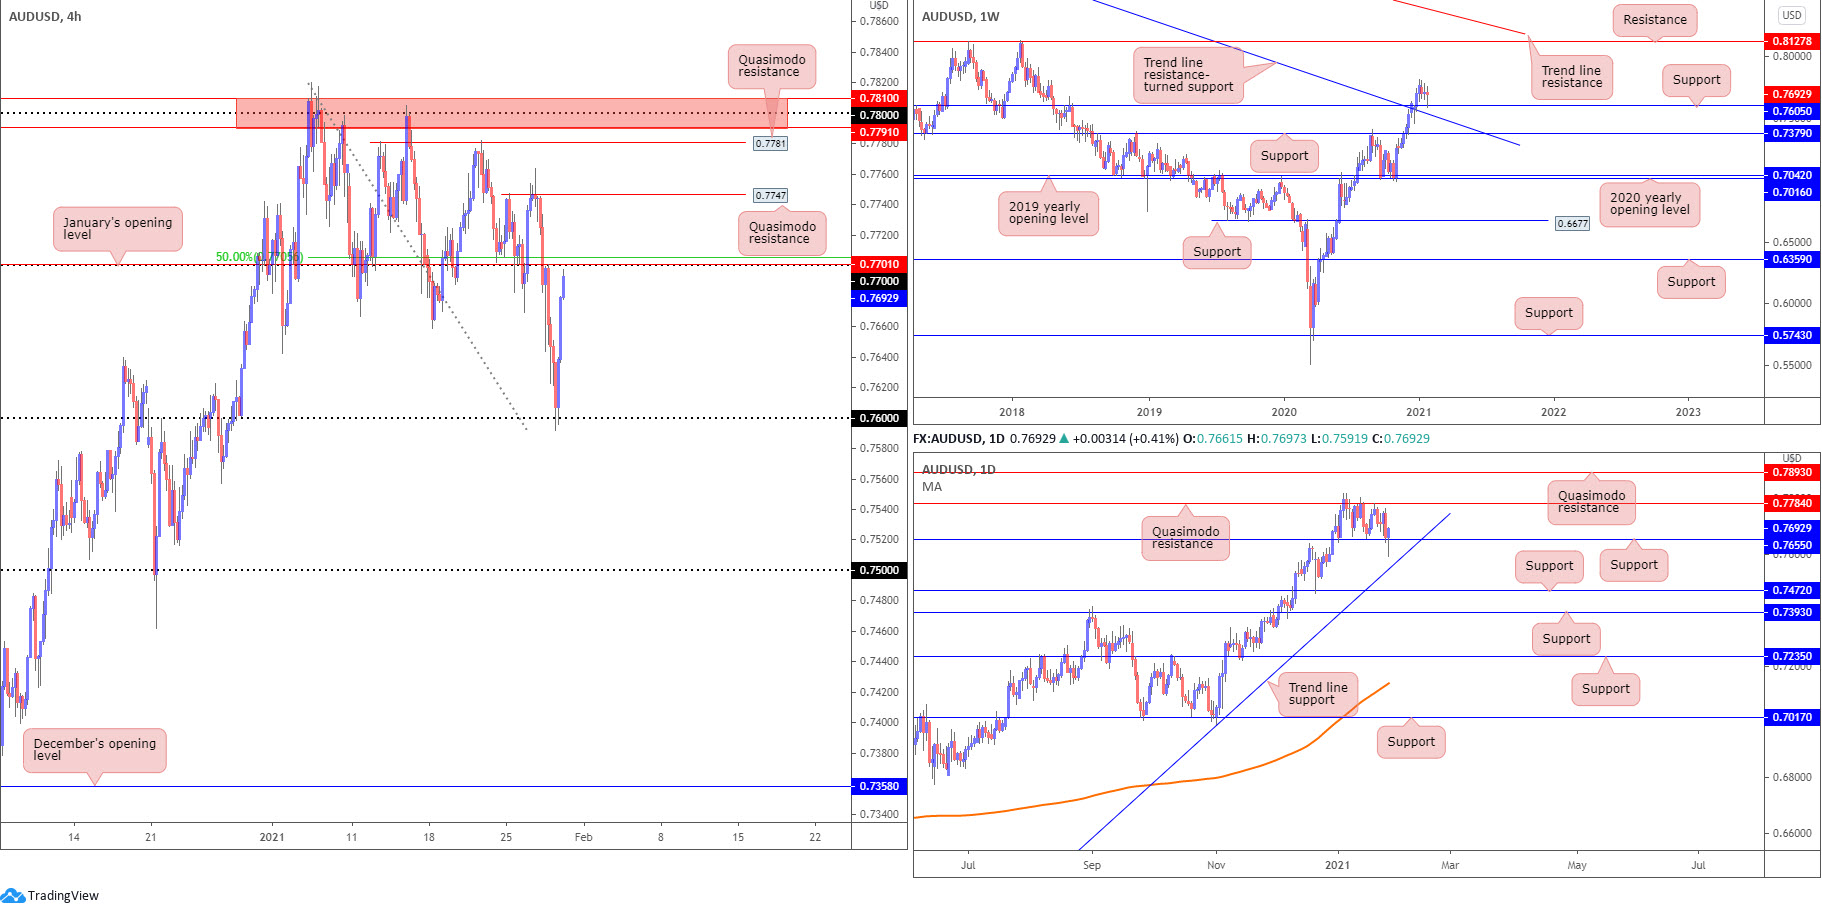
H4 slipped to lows at 0.7591 and consequently tested the resolve of the 0.76 figure. As evident from the chart, H4 pencilled in a strong 100-pip pullback and is within touching distance of testing the underside of 0.77, alongside January’s opening value at 0.7701 and the 50.0% retracement ratio at 0.7704. North of here, Quasimodo resistance at 0.7747 can be seen as the next port of call.
From the weekly timeframe, we can see Thursday retested support at 0.7605, a previous Quasimodo resistance. Not only does this higher timeframe level merge with the 0.76 figure on the H4, weekly players will acknowledge nearby trend line resistance-turned support, taken from the high 1.1080.
A closer reading of price action on the daily timeframe shows price produced a hammer candle off support at 0.7655, with a recovery likely to take aim at Quasimodo resistance drawn from 0.7784.
Areas of consideration:
- The trend in this market has been decisively higher since 2020.
- 76 round number merging with weekly support at 0.7605.
- (H4) 0.77 is a level to be mindful of, converging with January’s opening value from 0.7701 and a 50.0% retracement level at 0.7704. However, noting monthly price retesting support at 0.7605 and daily price forming a hammer candle pattern off support at 0.7655, this could lead a H4 breakout north of 0.77.
USD/JPY:
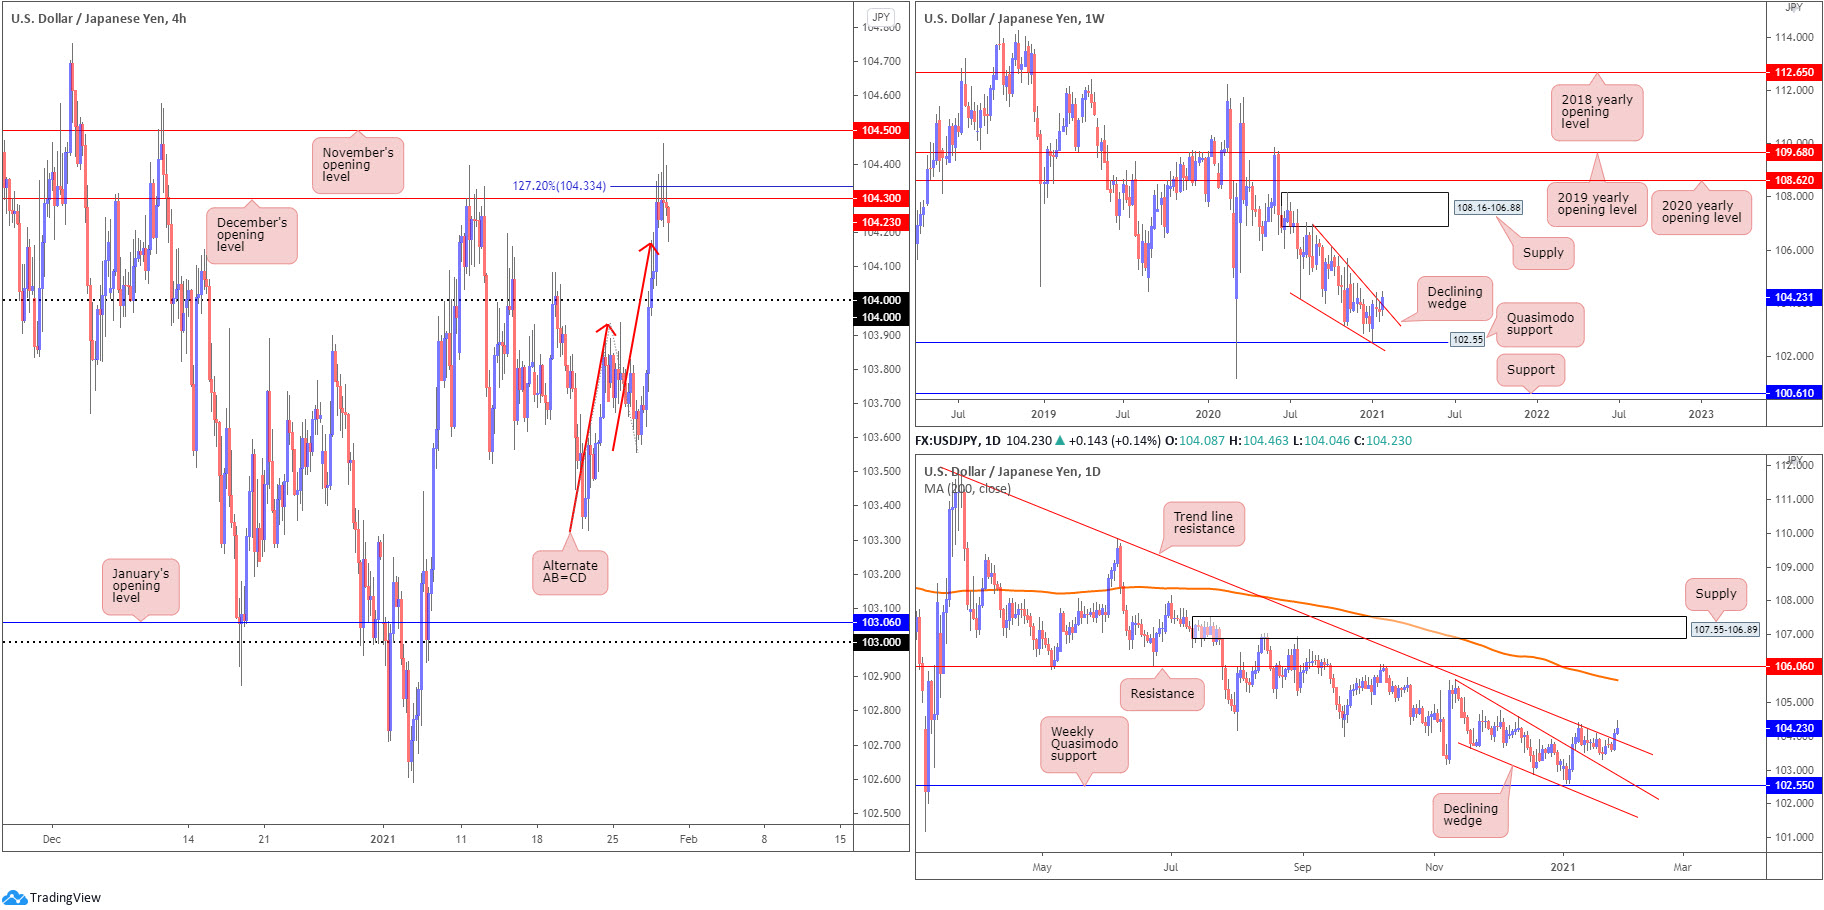
The US dollar clocked fresh monthly highs against the Japanese yen on Thursday, with H4 crossing swords not only with December’s opening value at 104.30, but also an alternate AB=CD (red arrows) bearish formation at the 127.2% Fibonacci extension point from 104.33. Since then, we have seen buyers step aside, kicking the 104 figure back into the light as a possible support level.
Against the backdrop of the H4 timeframe, Thursday’s advance added upside impetus to the recent breakout above the weekly declining wedge (106.94/104.18). Traders will also acknowledge daily price, albeit on course to conclude in the shape of a shooting star, trades above trend line resistance, extended from the high 111.71.
Areas of consideration:
- Although the weekly timeframe’s breakout above the declining wedge has likely caught the attention of longer-term buyers, a cautious stance may still be seen until a more decisive weekly close emerges (let’s remember daily price is forming a bearish shooting star candle).
- The 104 figure on the H4 timeframe represents possible support, following Thursday’s rejection off December’s opening value at 104.30 and nearby alternate AB=CD.
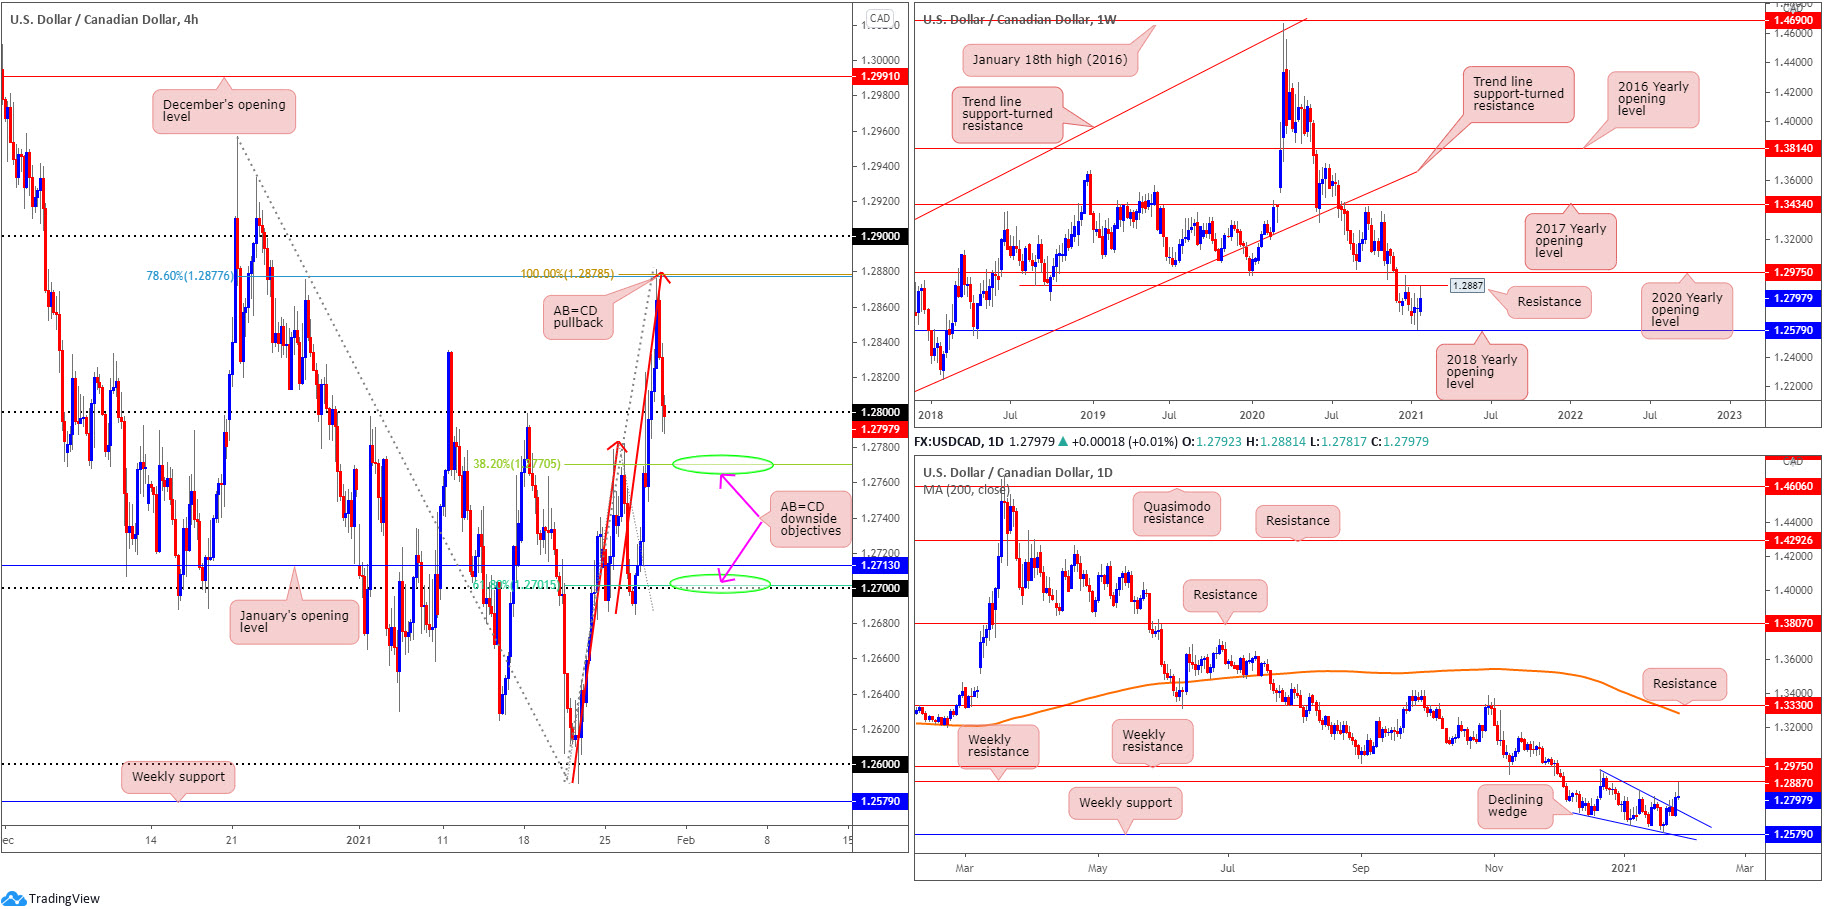
USD/CAD:
After touching gloves with multi-week tops, USD/CAD pared earlier gains on Thursday. Technically aided by a H4 AB=CD pullback at 1.2878, along with a 78.6% Fibonacci retracement ratio at 1.2877, the pair has since slipped beneath the 1.28 figure. Harmonic traders are also likely to acknowledge the 38.2% and 61.8% Fibonacci retracement ratios at 1.2770 and 1.2701, respectively—AB=CD downside objectives.
Of note on the bigger picture, in the shape of a daily gravestone doji candle, Thursday came within touching distance of testing weekly resistance at 1.2887, a previous Quasimodo support level.
Traders may also recall daily price recently broke out above a daily declining wedge (1.2957/1.2688), boasting an upside target at around 1.3031. It is also important to remind ourselves, however, that long-term flow (trend) has been pointing lower since topping in March (2020).
Areas of consideration:
- With 1.28 poised to give way on the H4, the 38.2% and 61.8% H4 Fibonacci retracement ratios at 1.2770 and 1.2701, respectively, could be targeted today.
- The daily timeframe’s bearish gravestone doji has likely nudged candlestick enthusiasts, particularly as the pattern formed within touching distance of weekly resistance at 1.2887.
- The breakout above the daily declining wedge, nevertheless, may still convince buyers to get involved and invade weekly resistance at 1.2887.
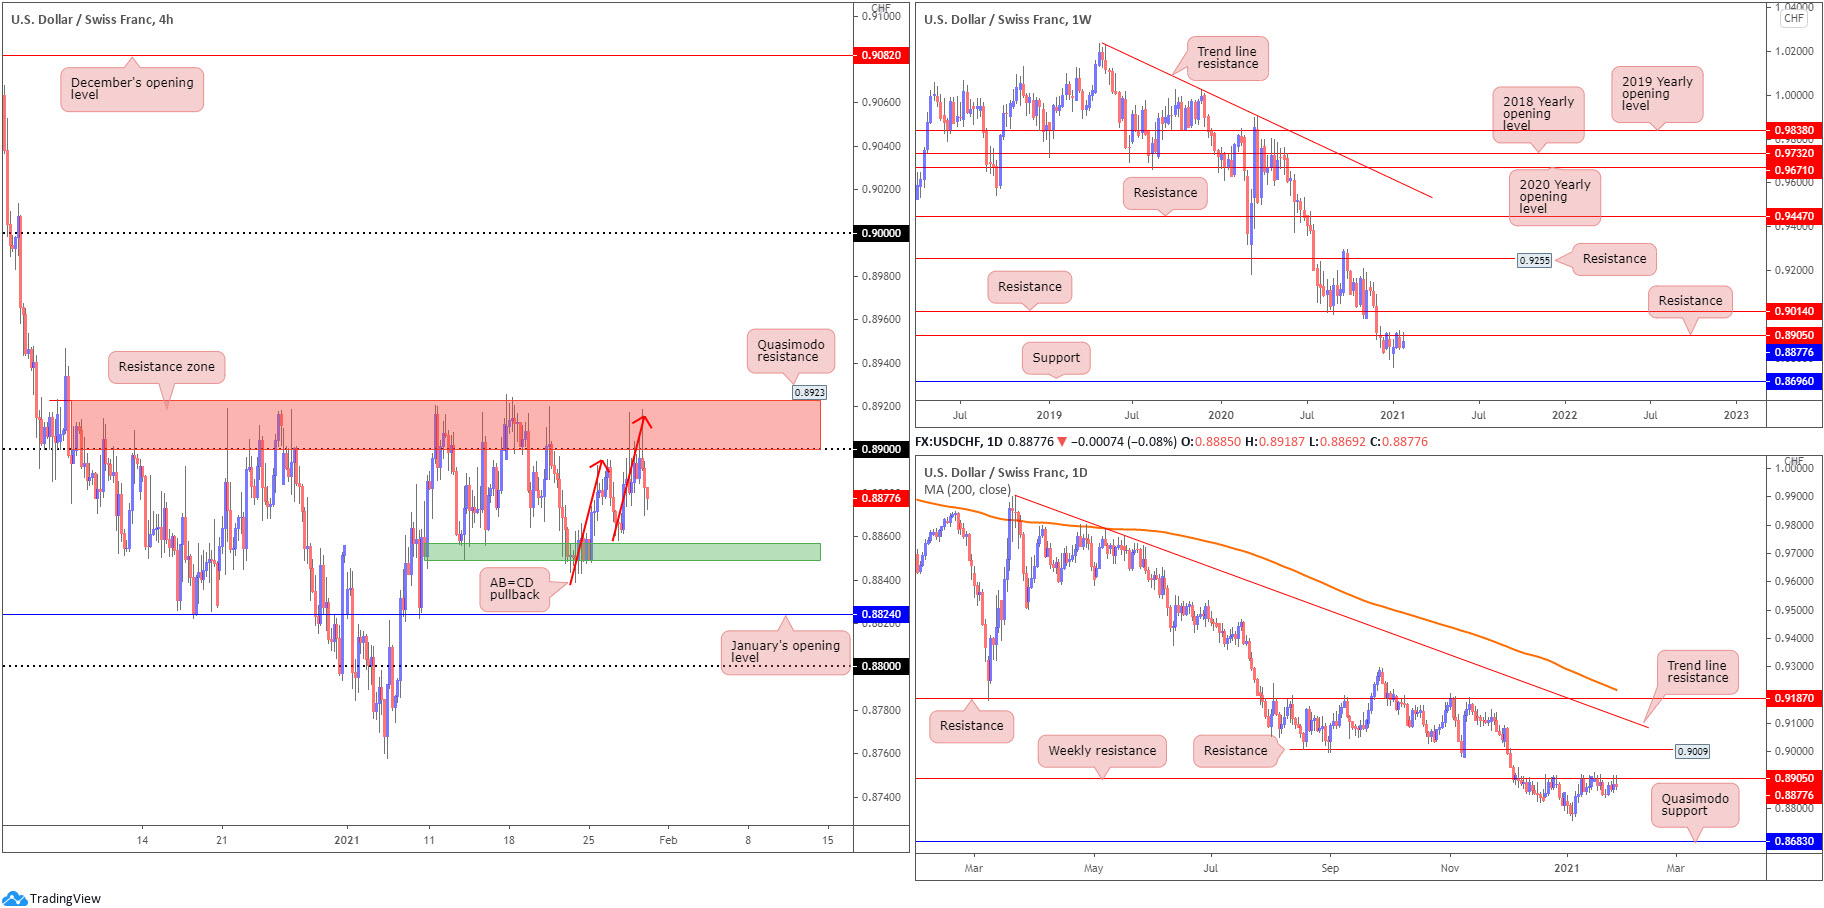
USD/CHF:
For those who read Thursday’s technical briefing you may recall the following points (italics):
Latest action saw USD/CHF spike into H4 resistance at 0.8923-0.89 (Quasimodo resistance and psychological resistance) and produce an AB=CD pullback (red arrows) at 0.8914.
The technical picture from the weekly timeframe reveals the unit has been trending southbound since May 2019, with price action currently retesting the underside of resistance at 0.8905 (converges with the H4 resistance zone mentioned above at 0.8923-0.89).
As evident from the H4 chart this morning, H4 price continues to echo a bearish vibe following the AB=CD forming at H4 resistance (0.8923-0.89), an area merging with weekly resistance at 0.8905. Recent selling, of course, was also exacerbated by broad-based USD weakness (DXY).
In terms of downside targets on the H4 scale, 0.8850 is seen as possible support, followed by January’s opening value at 0.8824, with follow-through selling pointing at the 0.88 figure.
Areas of consideration:
- Retesting H4 resistance at 0.8923-0.89, in the shape of a H4 AB=CD configuration, is interesting, particularly as the level combines with weekly resistance at 0.8905. Bearish scenarios may form should H4 close south of 0.8850. Although short-term downside targets rest between 0.8824 (January’s opening value) and the 0.88 figure, longer-term targets to be aware of are the multi-month troughs around 0.8757 (formed early January), with further selling to possibly take aim at weekly support drawn from 0.8696 and daily Quasimodo support at 0.8683.
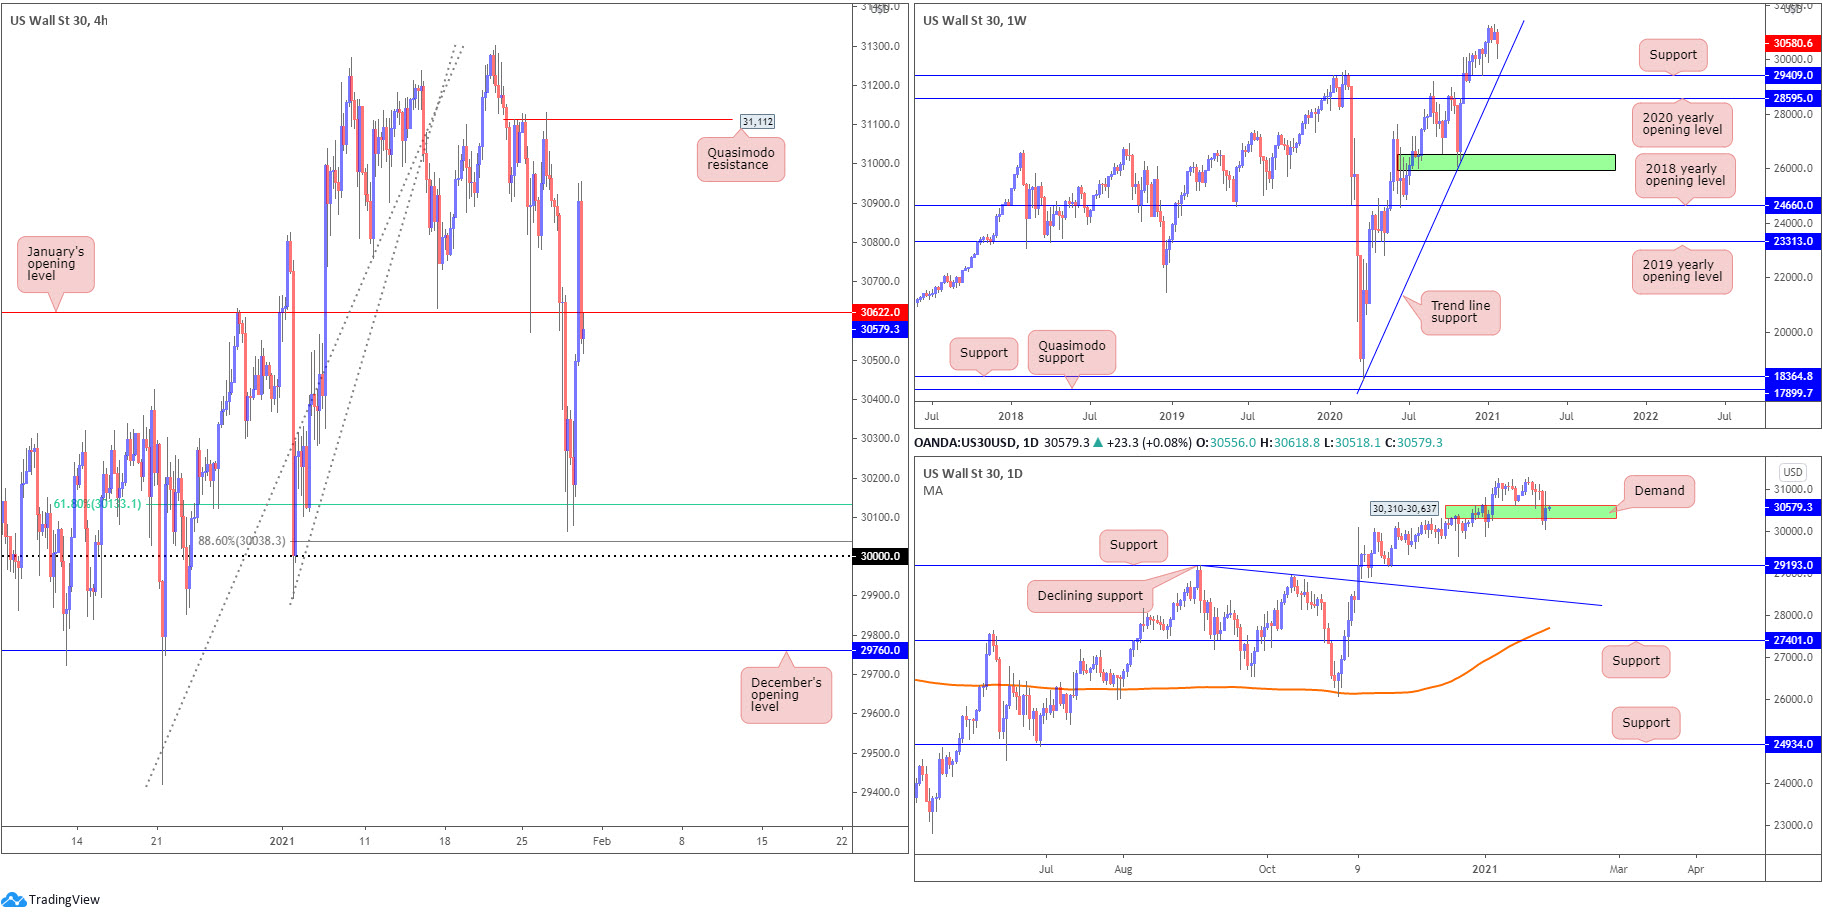
Dow Jones Industrial Average:
US stocks finished higher on Thursday.
The Dow Jones Industrial Average added 300.19 points, or 0.99%; the S&P 500 advanced 36.61 points, or 0.98% and the Nasdaq jumped 66.56 points, or 0.50%.
From a technical perspective, the weekly chart has price circling all-time highs at 31,301. As noted in previous analysis, weekly trend line support, extended from the low 18,213, is worth noting, though do be aware support at 29,409 could also enter the fight.
In a market trending decisively higher since the beginning of 2020, demand on the daily timeframe at 30,310-30,637, although having its lower edge challenged yesterday, remains in the fight.
In what was a volatile trading day, Thursday concluded south of January’s opening value at 30,622. To the downside, support can be seen between 88.6% and 61.8% Fibonacci retracement ratios at 30,038-30,133, sited just north of the 30,000 figure. Above 30,622, Quasimodo resistance at 31,112 is on the hit list.
Areas of consideration:
- H4 support between 88.6% and 61.8% Fibonacci retracement ratios at 30,038-30,133, as well as the 30,000 figure.
- H4 Quasimodo resistance at 31,112.
- Daily demand at 30,310-30,637.
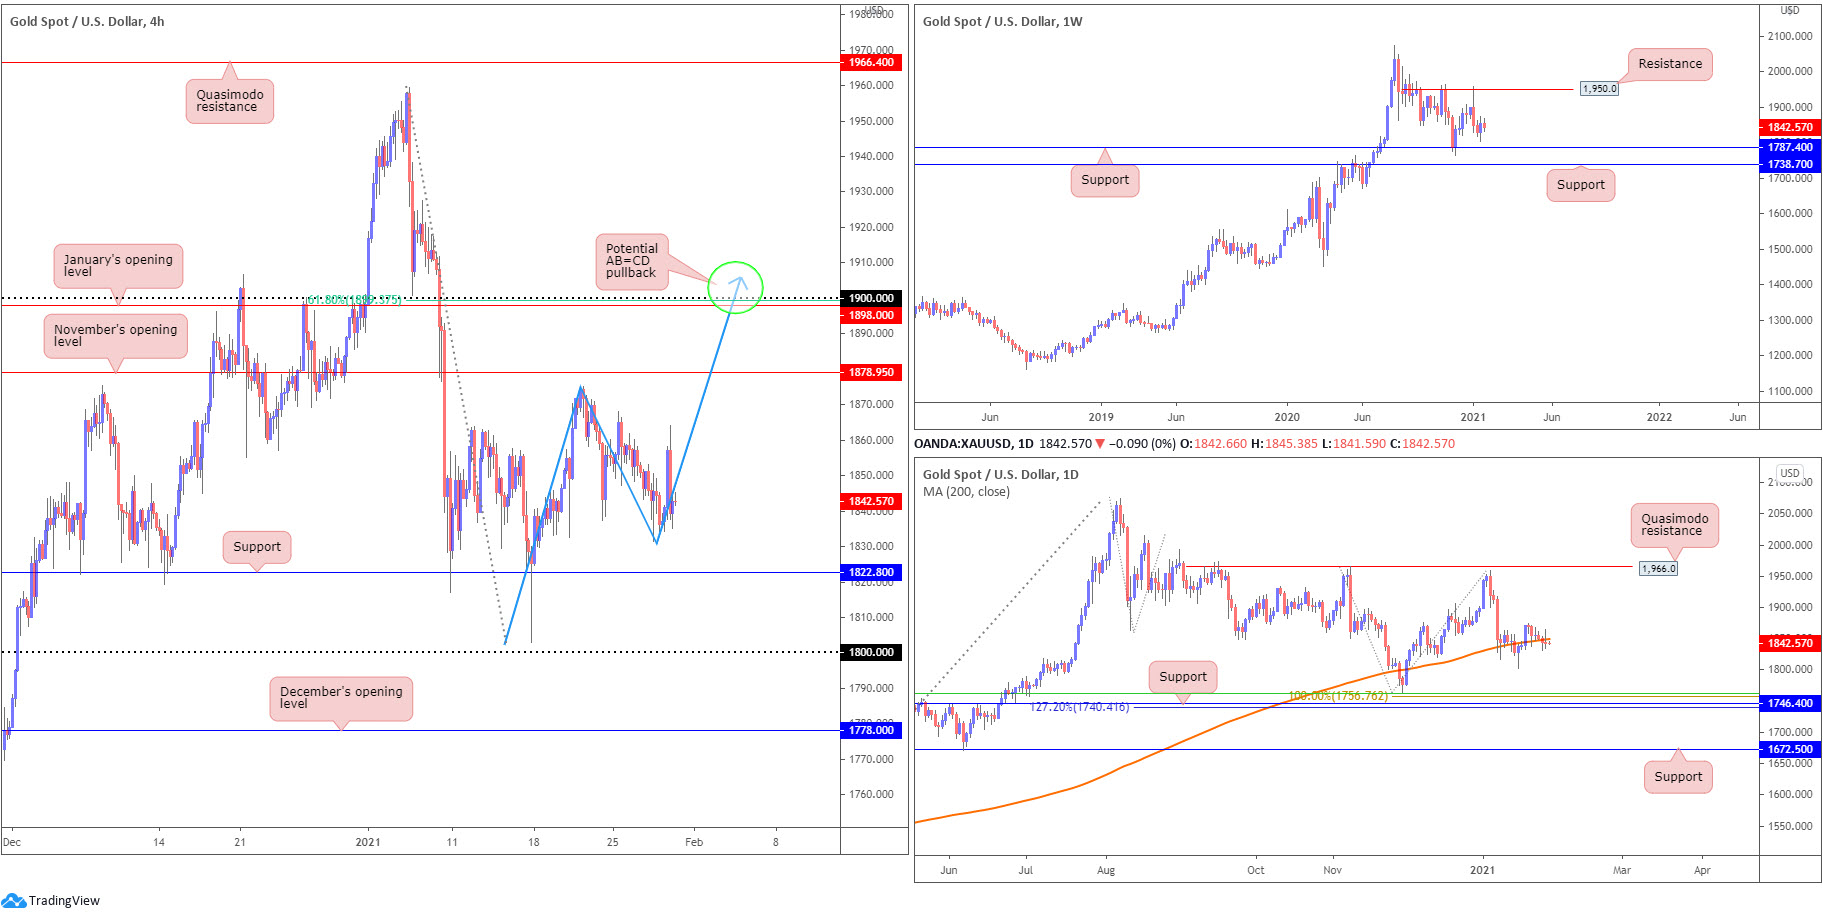
XAU/USD (GOLD):
Concluding Thursday off best levels, XAU/USD prices enter Friday mostly unmoved. With that, the following analysis will echo thoughts aired in Thursday’s technical briefing (italics).
Last week’s weekly bullish outside reversal candle, as you can see, has failed to provide impetus so far this week. This implies weekly support at $1,787—set north of another support at $1,738—is perhaps to call for attention.
Price action on the daily timeframe has modestly slipped through the 200-day SMA (orange – $1,849). Any sustained selling south of this dynamic value is likely to be interpreted as a bearish cue. Below the noted SMA, support is arranged around $1,746, sited south of a 100% Fibonacci extension point at $1,756, a 50.0% retracement ratio at $1,762 and above a 127.2% Fibonacci extension point at $1,740.
Across the page on the H4 chart, $1,822 is seen as immediate support, with a break exposing $1,800. To the upside, November’s opening value at $1,878 represents possible resistance, followed by January’s opening value at $1,898, a 61.8% Fibonacci ratio at $1,899, the $1,900 figure and a potential AB=CD pullback (blue arrows) at $1,906.
Areas of consideration:
- The 200-day SMA breach has likely caught the eye of sellers, particularly with room seen on the weekly timeframe to approach support at $1,787.
- H4 support at $1,822 is in view, with November’s opening value at $1,878 seen to the upside.
- H4 AB=CD pullback around $1,900 may interest sellers should November’s opening value at $1,878 step aside.
The accuracy, completeness and timeliness of the information contained on this site cannot be guaranteed. IC Markets does not warranty, guarantee or make any representations, or assume any liability regarding financial results based on the use of the information in the site.
News, views, opinions, recommendations and other information obtained from sources outside of www.icmarkets.com.au, used in this site are believed to be reliable, but we cannot guarantee their accuracy or completeness. All such information is subject to change at any time without notice. IC Markets assumes no responsibility for the content of any linked site.
The fact that such links may exist does not indicate approval or endorsement of any material contained on any linked site. IC Markets is not liable for any harm caused by the transmission, through accessing the services or information on this site, of a computer virus, or other computer code or programming device that might be used to access, delete, damage, disable, disrupt or otherwise impede in any manner, the operation of the site or of any user’s software, hardware, data or property.


