
Key risk events today:
Swiss KOF Economic Barometer; Canada GDP m/m; US Core PCE Price Index m/m; US Personal Spending m/m; BoE Gov Bailey Speaks; Chicago PMI; US Revised UoM Consumer Sentiment; Jackson Hole Symposium.
(Previous analysis as well as outside sources – italics).
EUR/USD:
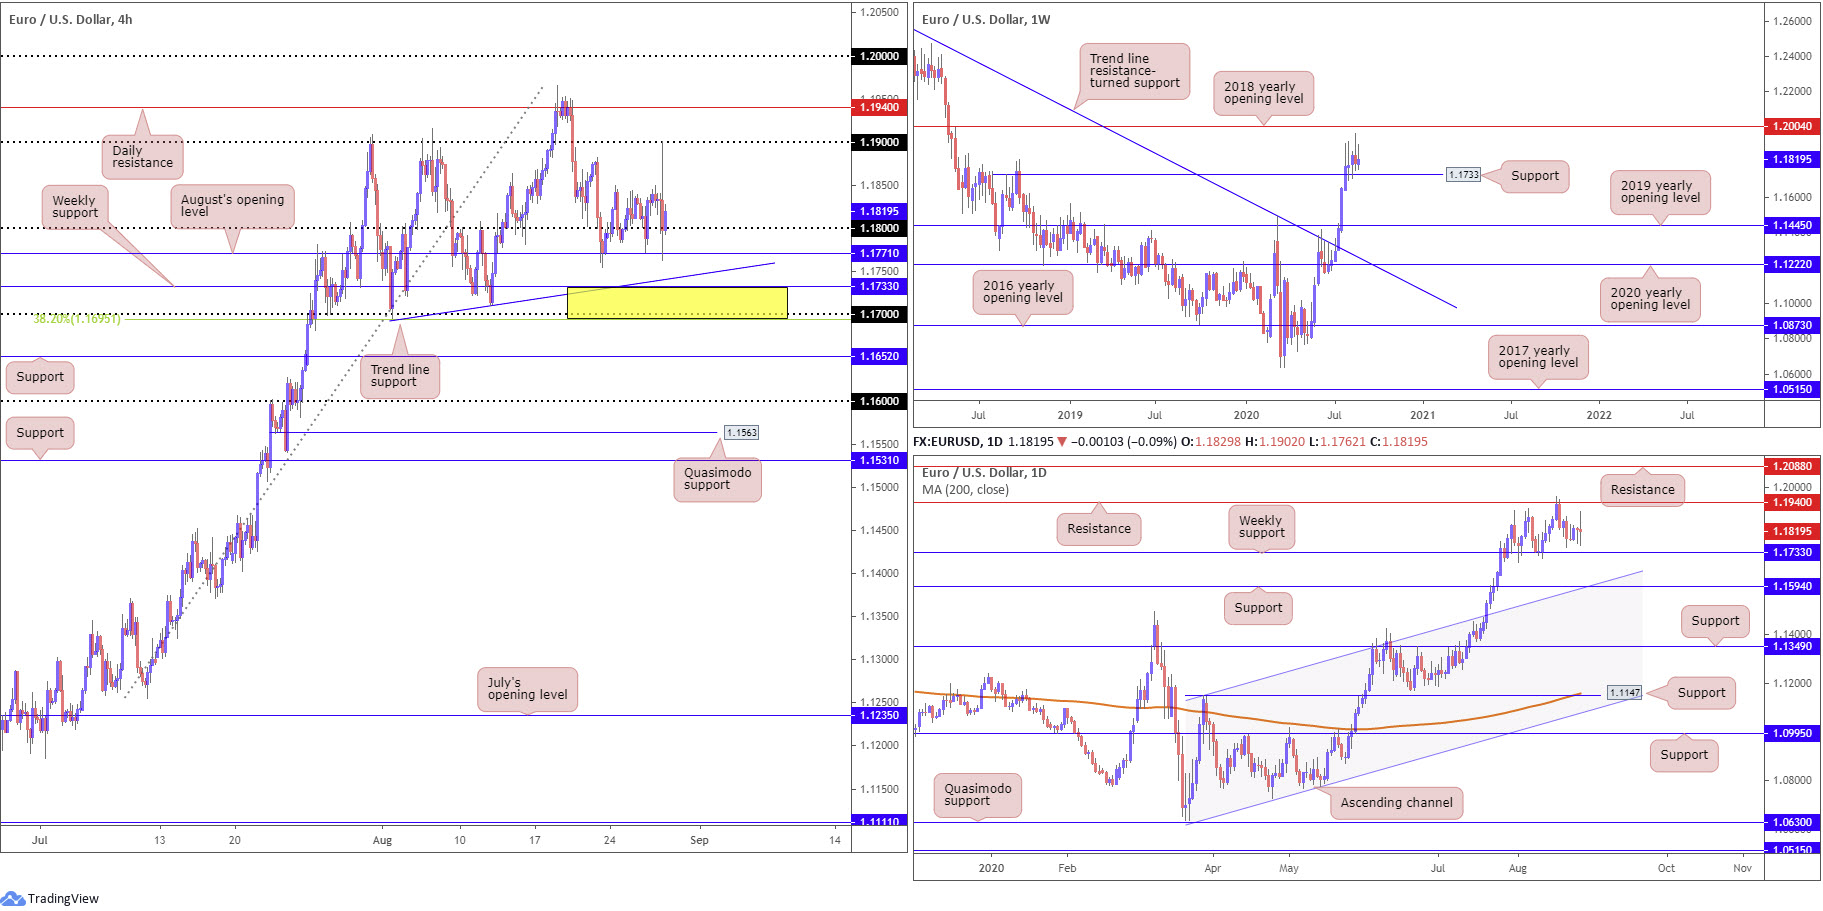
Thursday witnessed FOMC Chairman Jerome Powell announce the Fed’s switch to target average inflation as a new strategy, which sparked extreme volatility. During the course of the day, price action spiked to the 1.19 handle and is currently settling off the 1.18 region, closely supported by August’s opening level at 1.1771 on the H4 timeframe.
South of 1.1771, weekly support at 1.1733 may be in the offing. Based on the H4 timeframe, we can also see trend line support, extended from the low 1.1695, the round number 1.17 and a 38.2% Fibonacci retracement ratio plotted at 1.1695.
Technical action has been quiet this week, therefore our weekly outlook remains unchanged:
Having the US dollar index mildly snap an eight-week bearish phase, EUR/USD curled south of the 2018 yearly opening level at 1.2004 last week, also modestly snapping an eight-week bullish phase.
Support at 1.1733, a prior Quasimodo resistance level is now back on the radar, which may be of interest to buyers, considering the recent break of trendline resistance (July 13), extended from the high 1.2555. A 1.1733 breach, on the other hand, unlocks a possible bearish theme towards the 2019 yearly opening level at 1.1445.
Technical structure on the daily timeframe put forward in the recent weekly report also remains unchanged:
Resistance at 1.1940 was brought to attention in recent trading, putting an end to a six-day bullish phase. Deprived of notable support, Friday headed lower and concluded the week within striking distance of weekly support mentioned above at 1.1733. Breaking 1.1733 on the daily timeframe may witness sellers strengthen their grip and approach support coming in at 1.1594, a level fusing with channel resistance-turned support, taken from the high 1.1147.
Areas of consideration:
August’s opening level at 1.1771 and the 1.18 band on the H4 maintains a reasonably solid position as a support area, though buyers still appear to lack enthusiasm.
The more prominent area of support, as underscored in Monday’s technical briefing, rests between the 1.1695/1.1733 region (yellow). Not only does the zone gift appealing H4/weekly confluence, the current trend in this market points north.
GBP/USD:
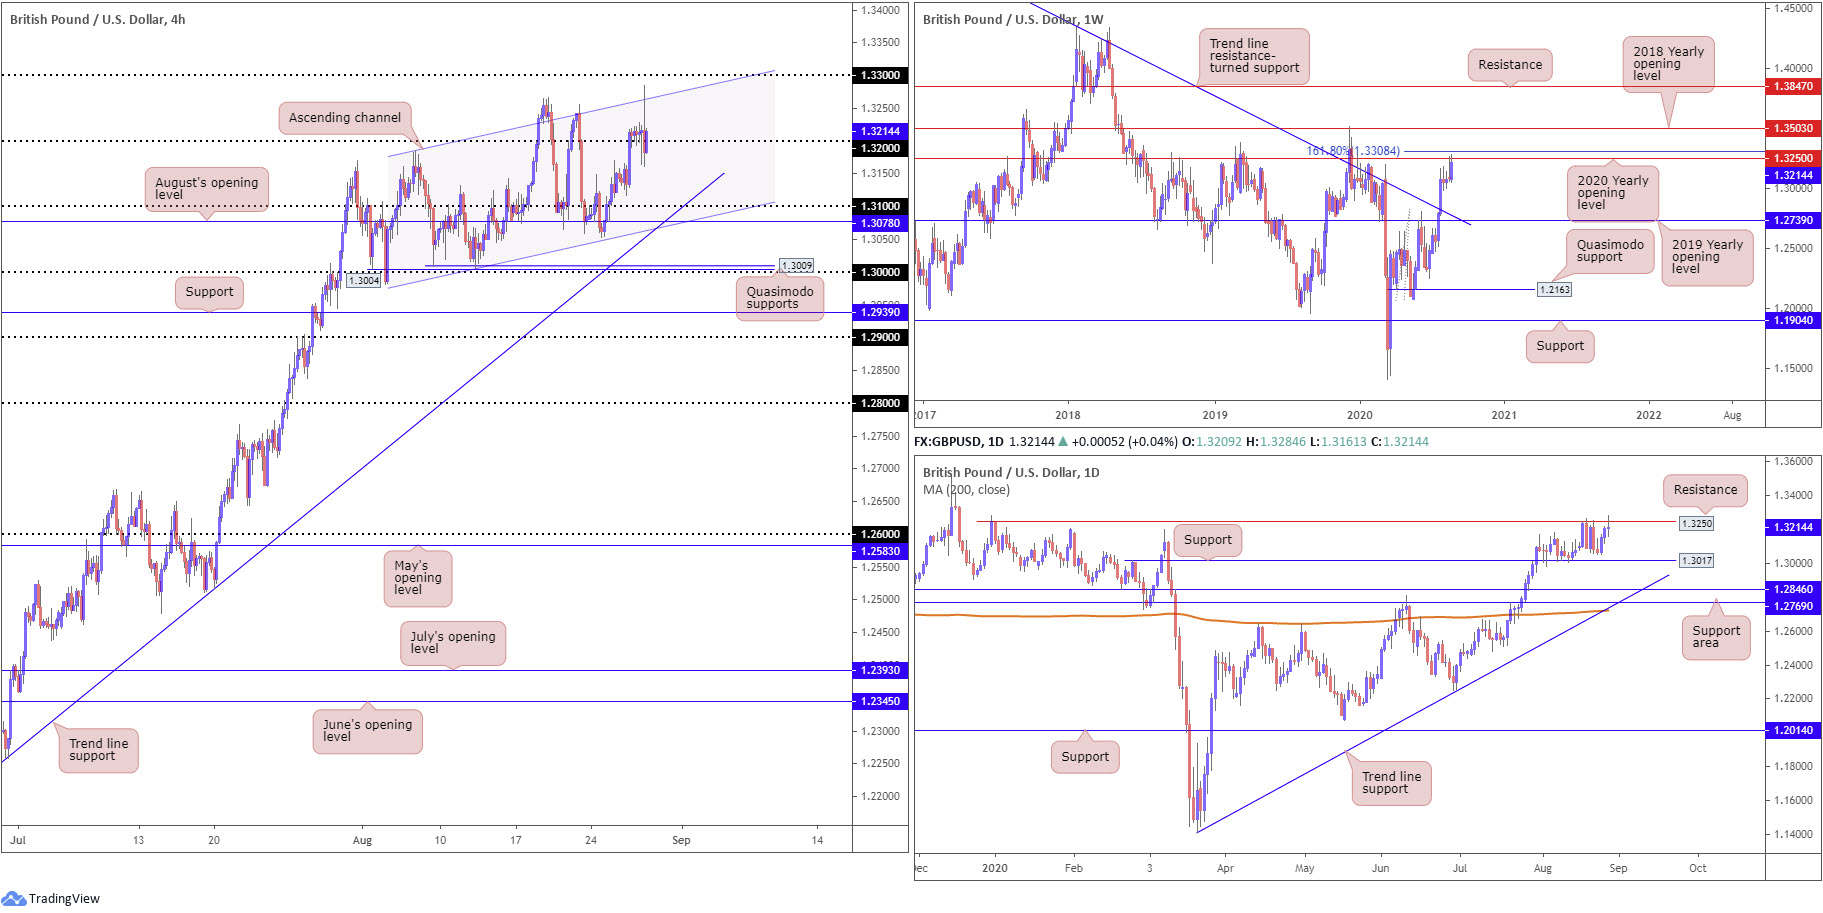
Sterling popped to fresh YTD peaks at 1.3284 Thursday following Federal Reserve Chair Jerome Powell unveiling a new approach to inflation. Technically, price action was unable to sustain gains north of H4 channel resistance, taken from the high 1.3185, leading to a pullback towards the 1.32 vicinity.
The story on the higher timeframes has weekly price toying with the 2020 yearly opening level at 1.3250, a level sited just under a 161.8% Fibonacci extension point at 1.3308. This follows last week’s gravestone doji candlestick formation. Also worth remembering is the July 27 trend line resistance (1.5930) break.
A closer reading of price action on the daily timeframe shows the unit testing resistance at 1.3250, a barrier sharing the same space with resistance on the weekly timeframe, the 2020 yearly opening level. To the downside, the spotlight shines towards a support marked at 1.3017, a prior Quasimodo resistance level, followed by an area of support between 1.2769/1.2846. This, as you can see, is also closely positioned with trend line support, taken from the low 1.1409, and a 200-day SMA (orange – 1.2722).
Areas of consideration:
While the current uptrend suggests we could see further upside take over, higher timeframe resistance at 1.3250 poses a problem for buyers at the moment.
We may see buyers attempt to make a stand off 1.32 today, though, again, upside beyond 1.3250 could prove difficult.
AUD/USD:
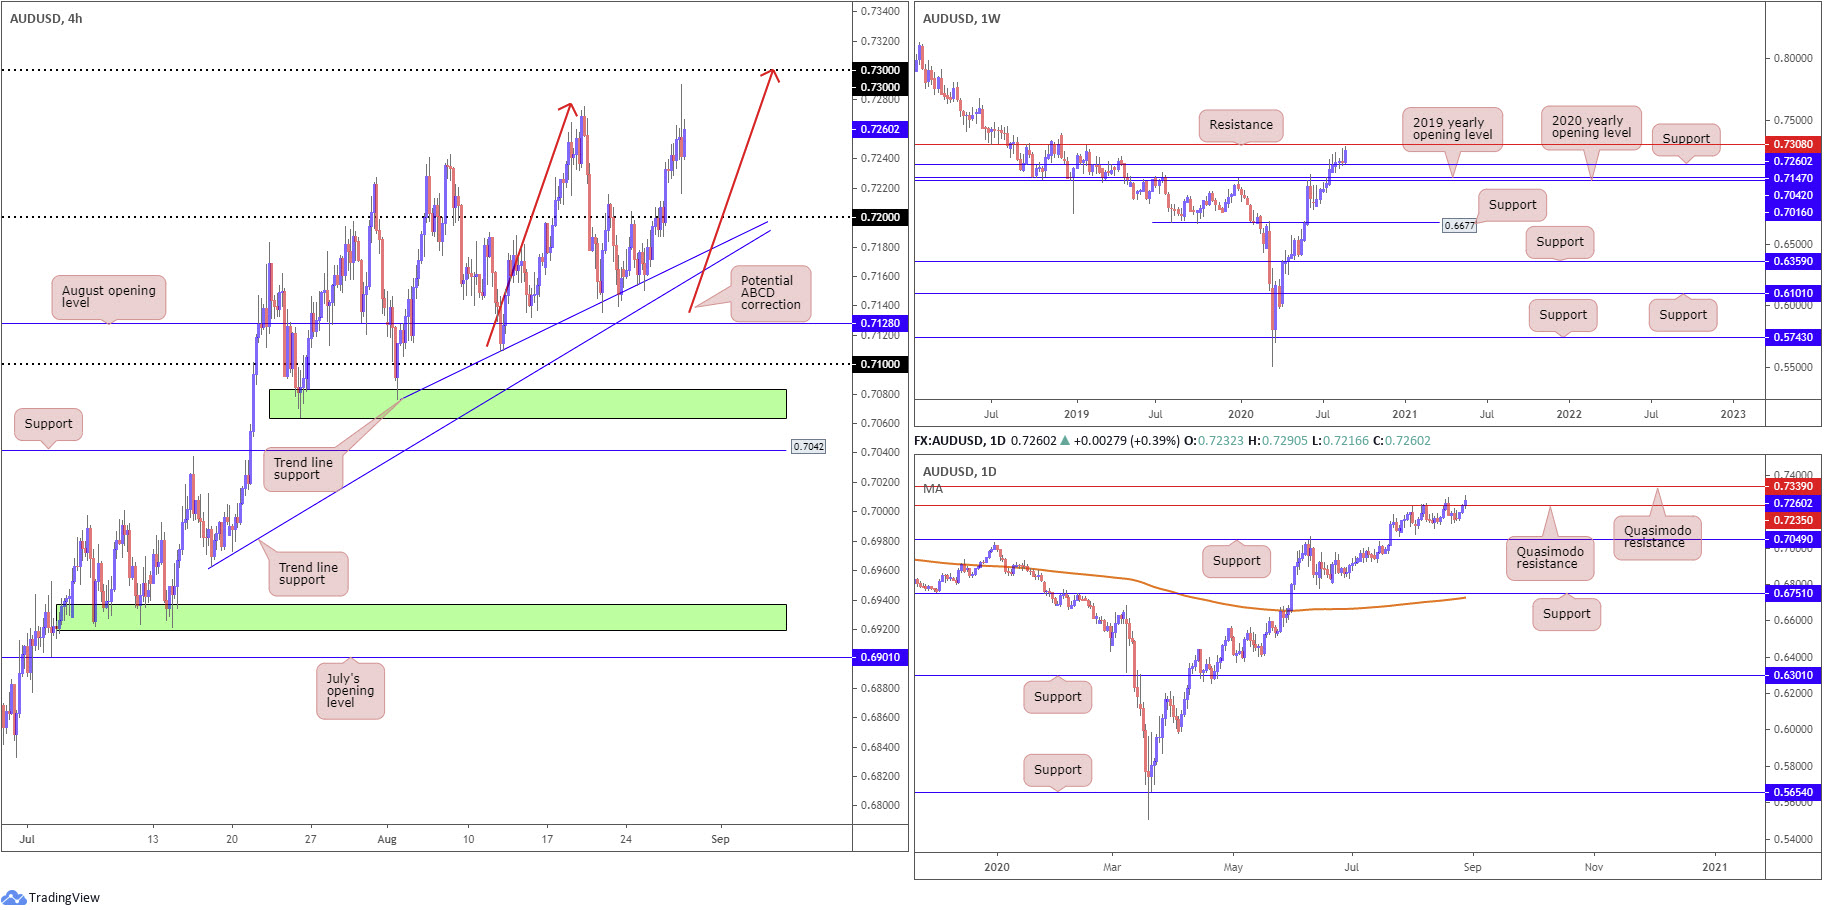
Registering a third consecutive advance on Thursday, AUD/USD run to fresh YTD peaks at 0.7290. This also likely tripped stops beyond last Wednesday’s high at 0.7275 and shined the spotlight on the 0.73 handle, a psychological level aligning with potential H4 ABCD (red arrows) bearish structure and weekly resistance at 0.7308.
In terms of where we stand on the daily timeframe right now, Quasimodo resistance at 0.7235 was taken out during yesterday’s advance, which could eventually have price welcome another Quasimodo resistance at 0.7339.
Areas of consideration:
With daily Quasimodo resistance at 0.7235 out of the picture, and weekly resistance calling for attention around 0.7308, we could see an advance to the 0.73ish region today. Intraday buyers, however, may have to drill down to the lower timeframes to secure a position due to the lack of H4 support, unless we retreat back to 0.72.
0.73 forms not only an upside target, it also represents robust resistance (H4 ABCD resistance and weekly resistance confluence) for those who favour countertrend trading strategies (AUD/USD has been trending higher since bottoming in March).
USD/JPY:
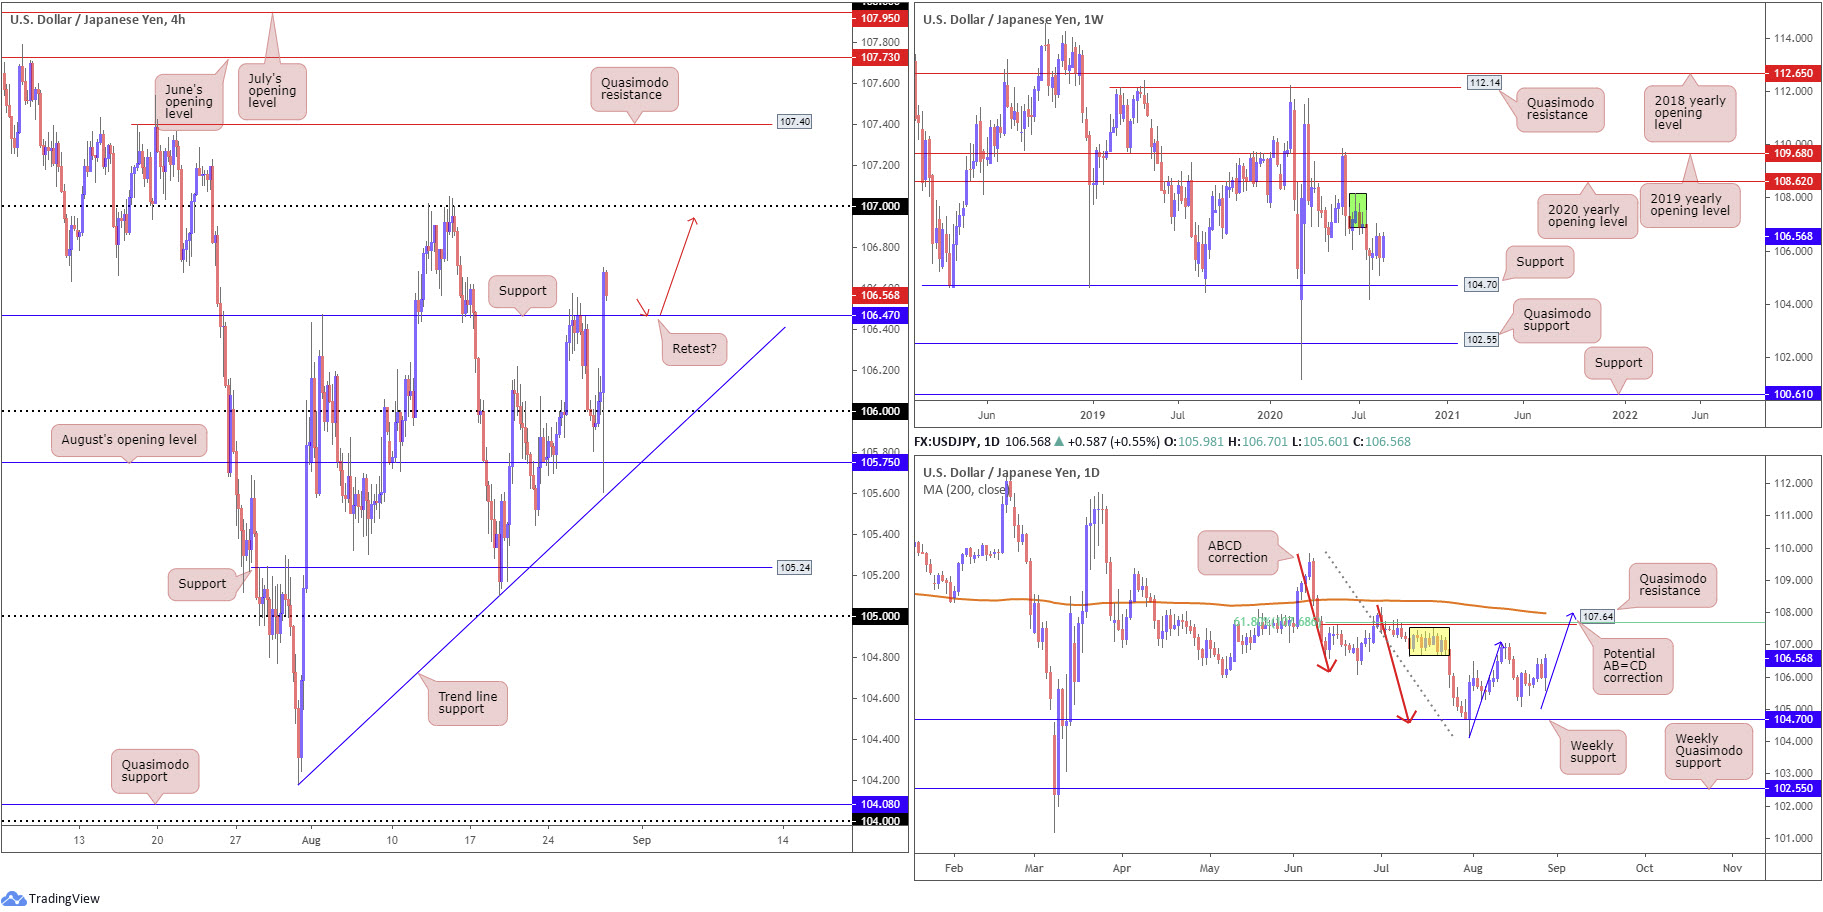
Yield on the 10-year US Treasury note strongly advanced Thursday, and the safe-haven Japanese yen tumbled against the buck as equities adopted a positive tone, leading to USD/JPY strongly recovering from August’s opening level at 105.75 on the H4 timeframe.
Reclaiming 106+ status and the daily timeframe forming a bullish outside day reversal, overhead resistance can be found at 107 on the H4 scale. Price action traders will also acknowledge Quasimodo resistance residing nearby the 107 region (107.01 – red arrow).
From the weekly timeframe, we can see supply remains prominent at 108.16-106.88 (dark green) after price made its way off support at 104.70 at the end of July. The 2020 yearly opening level at 108.62 may enter view should additional upside take over.
From the daily timeframe, however, the August 19 recovery from 105.10 (ahead of weekly support mentioned above at 104.70) represents the beginnings of a D-leg to a possible AB=CD bearish correction (blue arrows) at 108.00. Serving nearby the AB=CD structure, traders will also find Quasimodo resistance positioned nearby at 107.64, along with a 61.8% Fibonacci retracement ratio at 107.68 and the 200-day SMA (orange – 107.98).
Areas of consideration:
H4 support at 106.47 could receive candle action today, perhaps putting forward a potential platform for buyers, targeting 107 handle as an initial port of call. 106.47 buyers, although the daily timeframe indicates fresh buying could take shape, will need to be aware of possible selling emerging from the underside of weekly supply at 106.88.
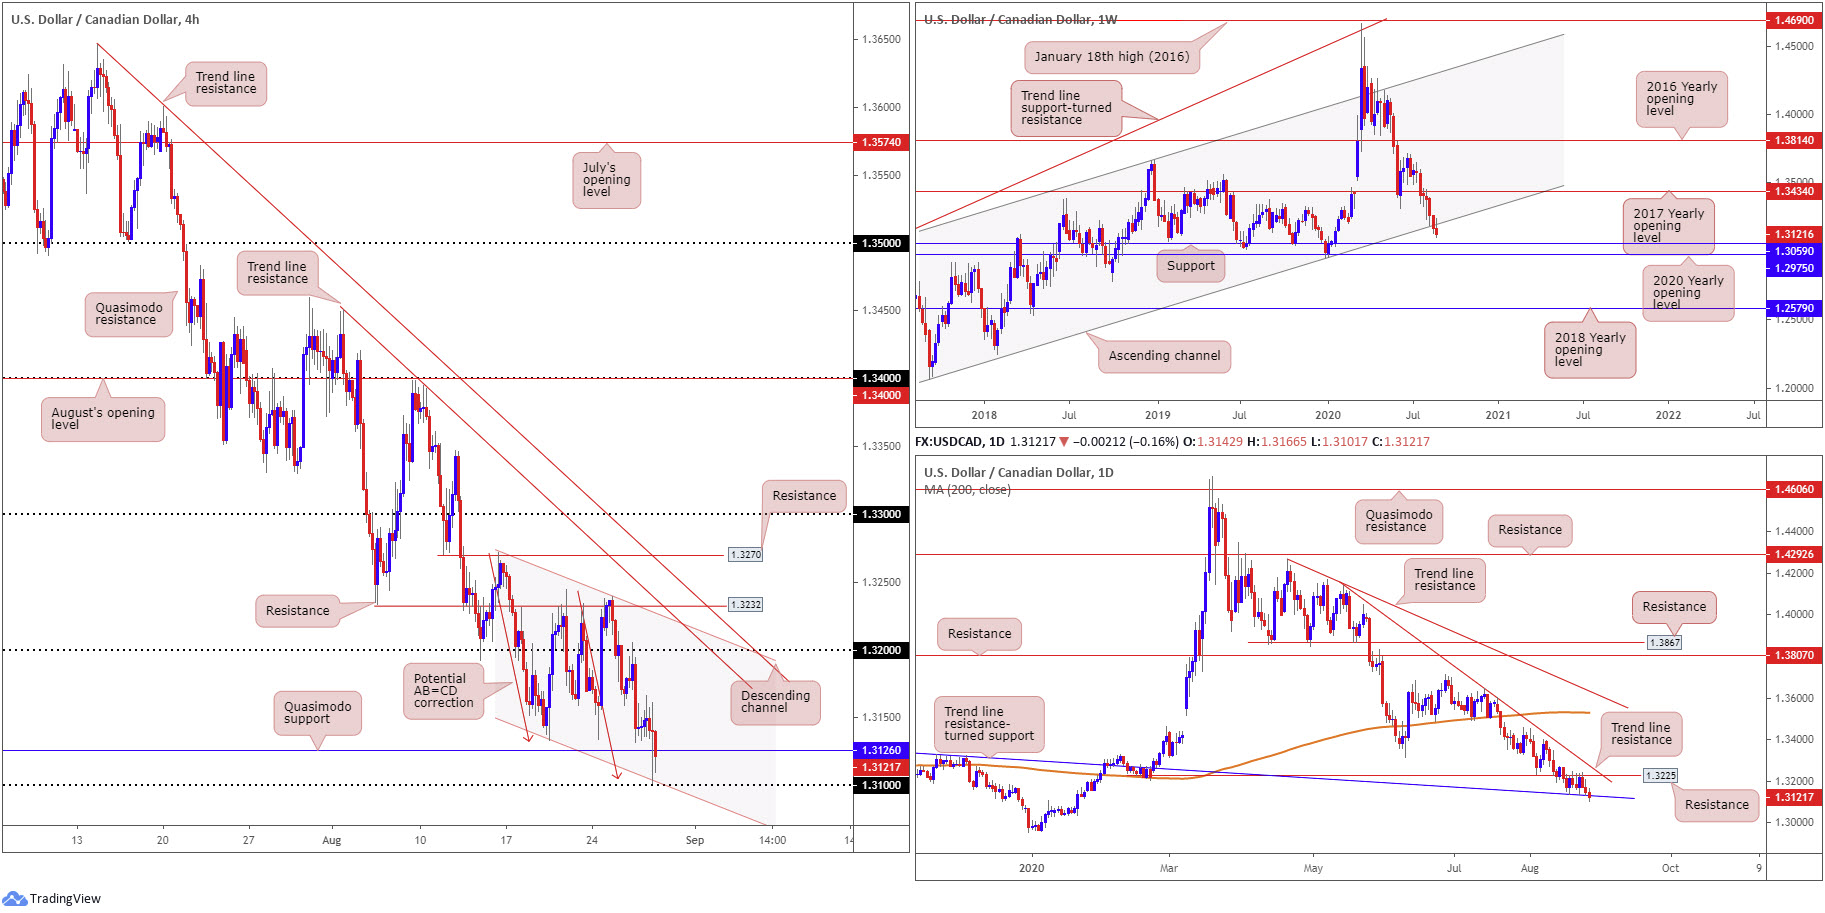
USD/CAD:
In recent hours, USD/CAD explored area south of H4 Quasimodo support at 1.3126, probing to fresh multi-month lows ahead of the 1.31 handle. Technically appealing off 1.31 is the AB=CD approach (red arrows) at 1.3105 and a channel support, taken from the low 1.3133.
From the weekly timeframe, sellers are seen strengthening grip under long-term channel support, taken from the low 1.2061, potentially leaning towards support at 1.3059. Daily price, on the other hand, is seen engaging with trend line resistance-turned support, extended from the high 1.3382, a level sharing the same space as H4 Quasimodo support highlighted above.
Areas of consideration:
While weekly players appear comfortable south of channel support, the H4 Quasimodo support at 1.3126 and daily trendline support combination could hinder further selling. However, the bounce from the aforementioned H4/daily levels is unlikely to be anything to get excited about given the immediate trend firmly pointing to the downside.
Intraday selling opportunities, as a result, could arise following a H4 close below 1.31, targeting weekly support at 1.3059 as an initial take-profit zone.
The accuracy, completeness and timeliness of the information contained on this site cannot be guaranteed. IC Markets does not warranty, guarantee or make any representations, or assume any liability regarding financial results based on the use of the information in the site.
News, views, opinions, recommendations and other information obtained from sources outside of www.icmarkets.com.au, used in this site are believed to be reliable, but we cannot guarantee their accuracy or completeness. All such information is subject to change at any time without notice. IC Markets assumes no responsibility for the content of any linked site.
The fact that such links may exist does not indicate approval or endorsement of any material contained on any linked site. IC Markets is not liable for any harm caused by the transmission, through accessing the services or information on this site, of a computer virus, or other computer code or programming device that might be used to access, delete, damage, disable, disrupt or otherwise impede in any manner, the operation of the site or of any user’s software, hardware, data or property.


