
Waiting for lower timeframe confirmation is our main tool to confirm strength within higher timeframe zones, and has really been the key to our trading success. It takes a little time to understand the subtle nuances, however, as each trade is never the same, but once you master the rhythm so to speak, you will be saved from countless unnecessary losing trades. The following is a list of what we look for:
- A break/retest of supply or demand dependent on which way you’re trading.
- A trendline break/retest.
- Buying/selling tails/wicks – essentially we look for a cluster of very obvious spikes off of lower timeframe support and resistance levels within the higher timeframe zone.
We typically search for lower-timeframe confirmation between the M15 and H1 timeframes, since most of our higher-timeframe areas begin with the H4. Stops are usually placed 1-3 pips beyond confirming structures.
EUR/USD:
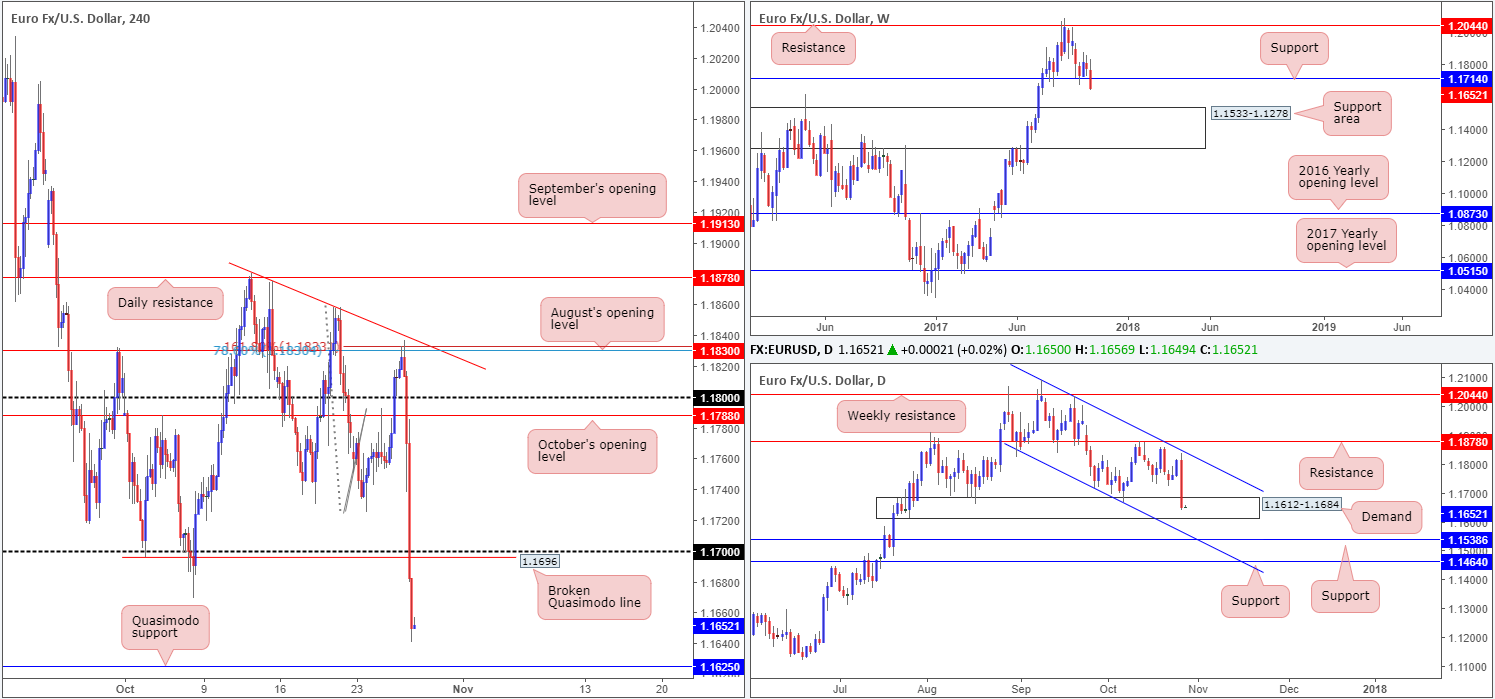
Trade update: Closed short position from 1.1830 at 1.1803 for a small gain.
The value of the euro weakened in aggressive fashion on Thursday, after the ECB announced that it would cut its bond purchases in half to 30 billion euros a month from January. Down 1.35% on the day, the pair is now seen trading ahead of a H4 Quasimodo support etched from 1.1625.
Over on the higher timeframes, we can see that weekly support at 1.1714 suffered a blow during yesterday’s descent. Assuming the sellers hold ground, the next downside target can be seen at a weekly support area coming in at 1.1533-1.1278. On the other side of the coin, nevertheless, daily price is now crossing swords with demand pegged at 1.1612-1.1684.
Suggestions: A long at the H4 Quasimodo support mentioned above at 1.1625, considering its position within the current daily demand, is an option today. With weekly support recently suffering a blow though, traders need to remain aware that this market may look to pierce through the aforementioned daily demand and challenge daily support at 1.1538 (essentially marks the top edge of the noted weekly support area). For that reason, we’re only expecting a run-of-the-mill bounce from 1.1625 today, which should be traded cautiously.
Data points to consider: US advance GDP q/q at 1.30pm; US revised UoM consumer sentiment at 3pm GMT+1.
Levels to watch/live orders:
- Buys: 1.1625 region (cautious long – weekly selling pressure overhead).
- Sells: Flat (stop loss: N/A).
GBP/USD:
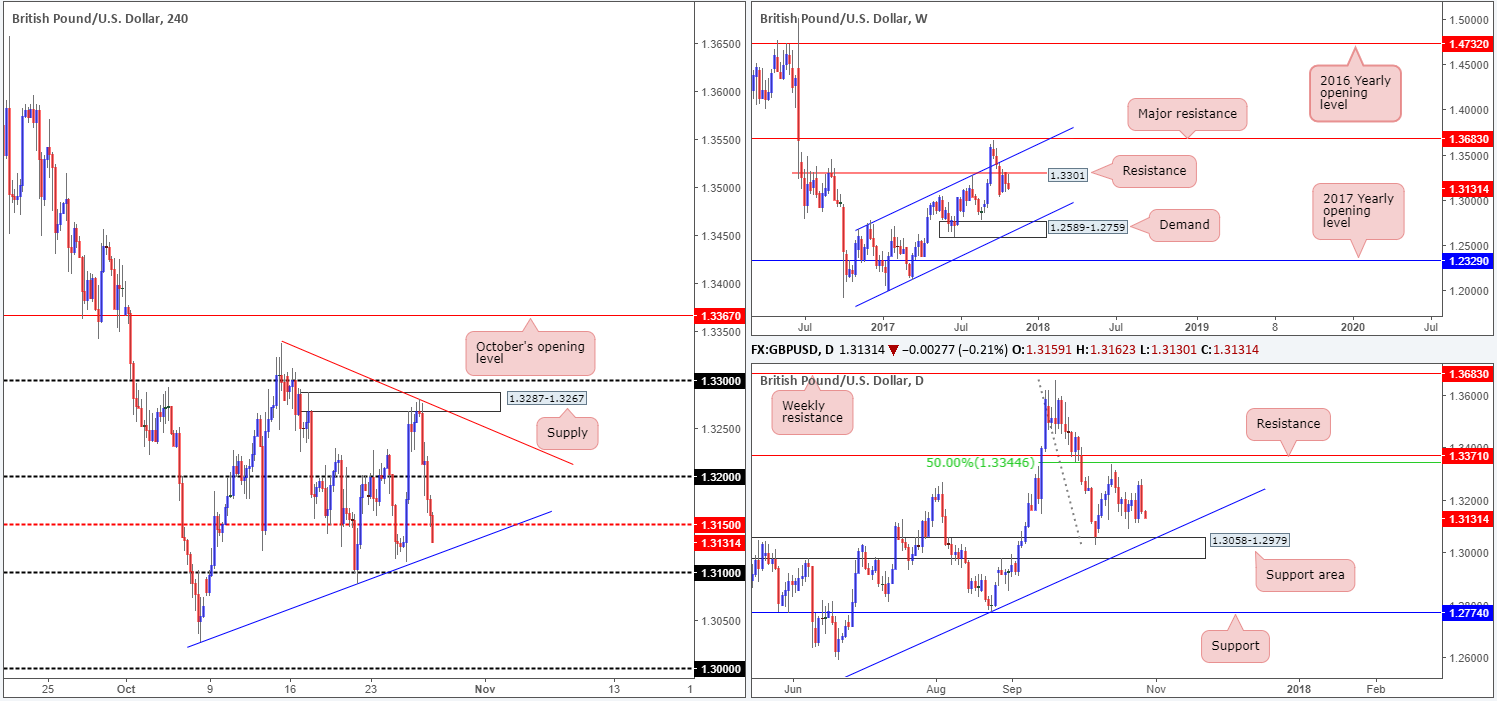
In a similar fashion to the EUR/USD, the GBP/USD also fell sharply on the back of a strong US dollar. Down -0.84% on the day and reclaiming most of Wednesday’s gains, the pair is now seen trading sub 1.3150 and is well placed to tackle nearby H4 trendline support etched from the low 1.3029.
Despite this, we do not believe the GBP/USD to be a buyers’ market right now. Our reasoning lies within the higher-timeframe structure. Upside is seen capped on the weekly timeframe from a resistance line coming in at 1.3301, while daily price shows room to continue pumping lower until we reach a support area positioned at 1.3058-1.2979.
For those looking to short sub 1.31, this would be a challenging trade considering how close the top edge of the daily support area would be at that point!
Suggestions: Neither a long nor short seems attractive at the moment.
Data points to consider: US advance GDP q/q at 1.30pm; US revised UoM consumer sentiment at 3pm GMT+1.
Levels to watch/live orders:
- Buys: Flat (stop loss: N/A).
- Sells: Flat (stop loss: N/A).
AUD/USD:
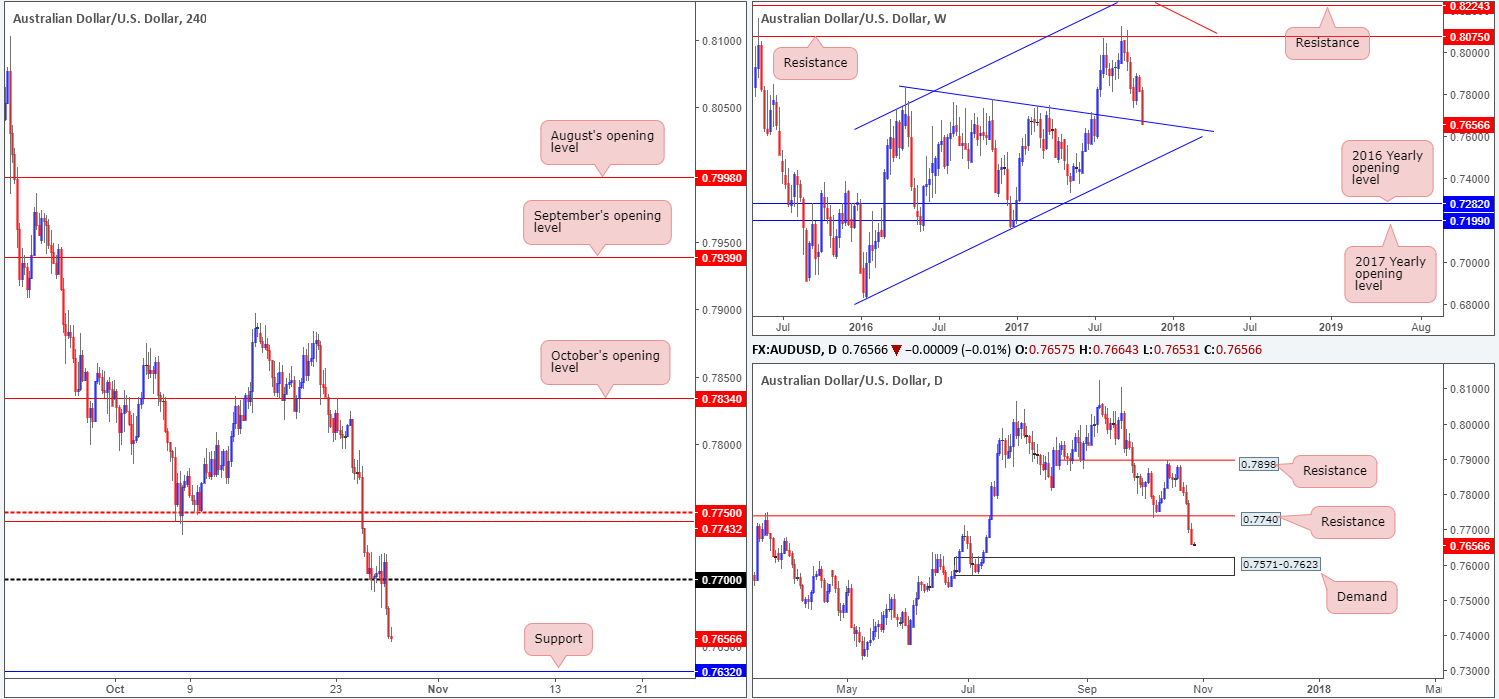
The AUD/USD witnessed further downside on Thursday, consequently recording its fifth consecutive daily loss. The move lower, as you can probably see, has pulled the commodity currency down to a weekly trendline support etched from the high 0.7835. Meanwhile, over on the daily timeframe, the pair still shows room to dive lower, at least until the candles connect with demand based at 0.7571-0.7623. Across the pond on the H4 timeframe, price is seen trading within 30 pips of a support coming in at 0.7632 which is positioned 10 pips above the aforementioned daily demand.
Suggestions: Although weekly price is shaking hands with a trendline support right now, this is not likely the best time to be buying, as both daily and H4 price suggest further selling may be on the cards. An area we would be interested in buying, however, can be seen at 0.76/0.7632. Comprised of the psychological band 0.76 and the aforesaid H4 support, this area, given it’s bolstered by a daily demand and nearby weekly trendline support, is a high-probability reversal zone, in our technical view.
Data points to consider: US advance GDP q/q at 1.30pm; US revised UoM consumer sentiment at 3pm GMT+1.
Levels to watch/live orders:
- Buys: 0.76/0.7632 (stop loss: beneath daily demand at 0.7569).
- Sells: Flat (stop loss: N/A).
USD/JPY:
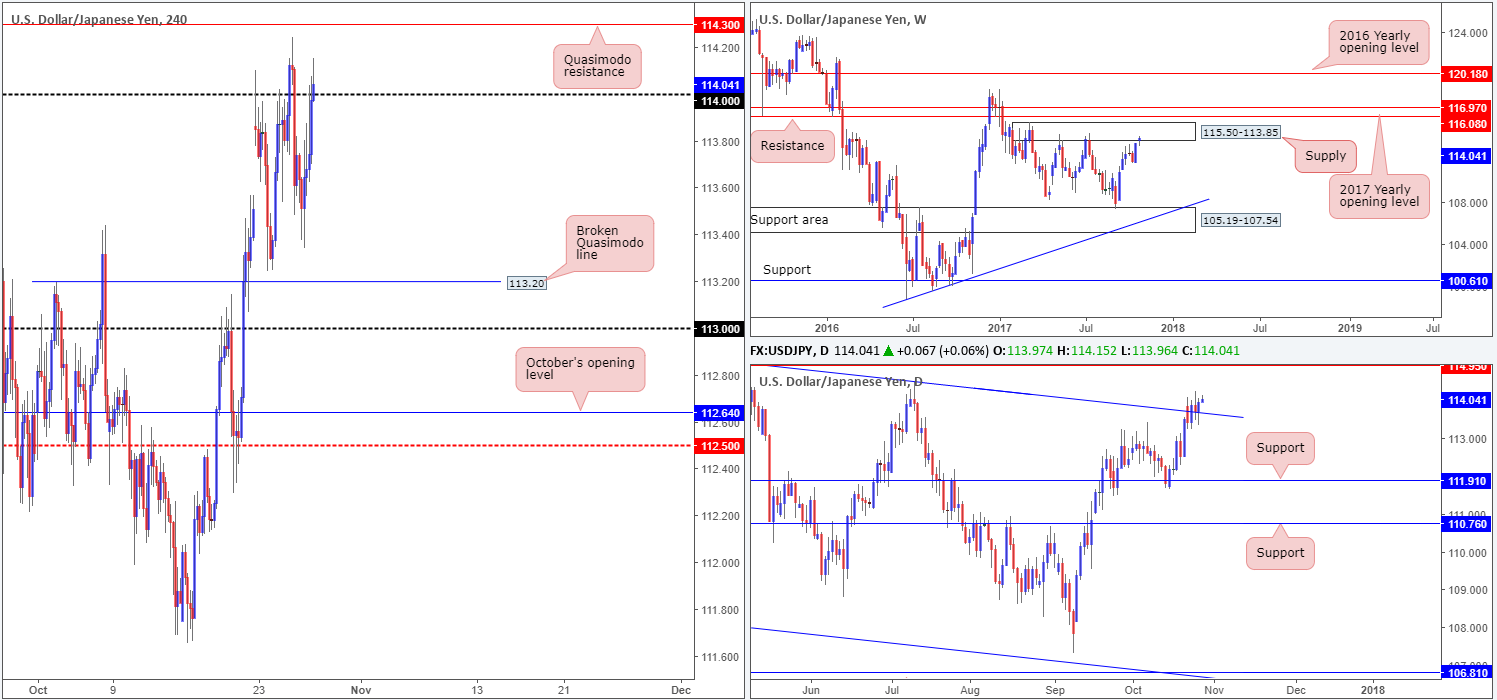
Kicking off this morning’s report with a look at the weekly timeframe, it is clear to see that price is flirting with the underside of a supply base drawn from 115.50-113.85. This zone, as you can see, has held price lower on two separate occasions this year, so there’s a chance that history may repeat itself here. Daily action on the other hand, recently closed above a channel resistance taken from the high 115.50, and is now seen retesting the line as support. Should the barrier hold, this potentially opens up the path north to a Quasimodo resistance seen at 114.95. A closer look at price on the H4 timeframe shows that the unit recently crossed above the 114 handle, possibly clearing upside to a nearby Quasimodo resistance planted at 114.30.
Suggestions: While a reaction is expected to be seen from the noted H4 Quasimodo, the daily Quasimodo resistance mentioned above at 114.95 is where serious sellers will likely make an appearance given it being a daily level. Therefore, we’ll hold out for this line as it also allows us to strategically position stops above the top edge of the weekly supply zone at 115.50.
Data points to consider: US advance GDP q/q at 1.30pm; US revised UoM consumer sentiment at 3pm GMT+1.
Levels to watch/live orders:
- Buys: Flat (stop loss: N/A).
- Sells: 114.95 region (stop loss: 115.53).
USD/CAD:
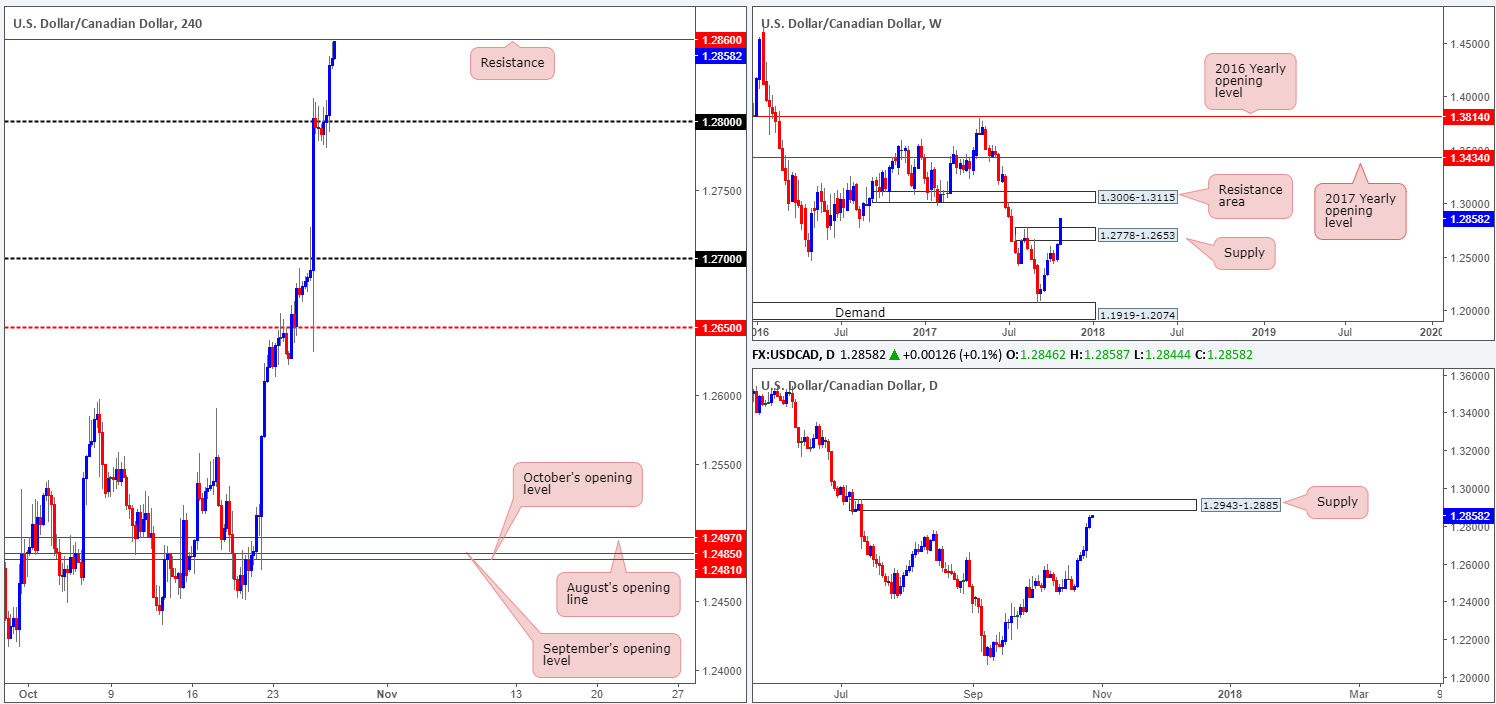
The USD/CAD rallied for a fifth consecutive day on Thursday, up 0.41%. As can be seen from the H4 chart, the 1.28 handle was eventually wiped out which allowed the unit to conclude trading just ahead of a resistance level marked at 1.2860. Between this level and the daily supply seen at 1.2943-1.2885, selling could be an option. The only grumble here, however, is weekly price. Notice that weekly supply at 1.2778-1.2653 was recently taken out, which could, technically speaking, have cleared the path north up to as far as a weekly resistance area at 1.3006-1.3115.
Suggestions: There are two cautionary points to consider regarding a sell in this market. The first we have already mentioned which concerns weekly structure. The second, however, is the strength of recent buying. Five days of near-full-bodied candles signifies a well-bid market, and trying to trade against this momentum could be frustrating, despite daily/H4 resistance structures.
Data points to consider: US advance GDP q/q at 1.30pm; US revised UoM consumer sentiment at 3pm GMT+1.
Levels to watch/live orders:
- Buys: Flat (stop loss: N/A).
- Sells: Flat (stop loss: N/A).
USD/CHF:
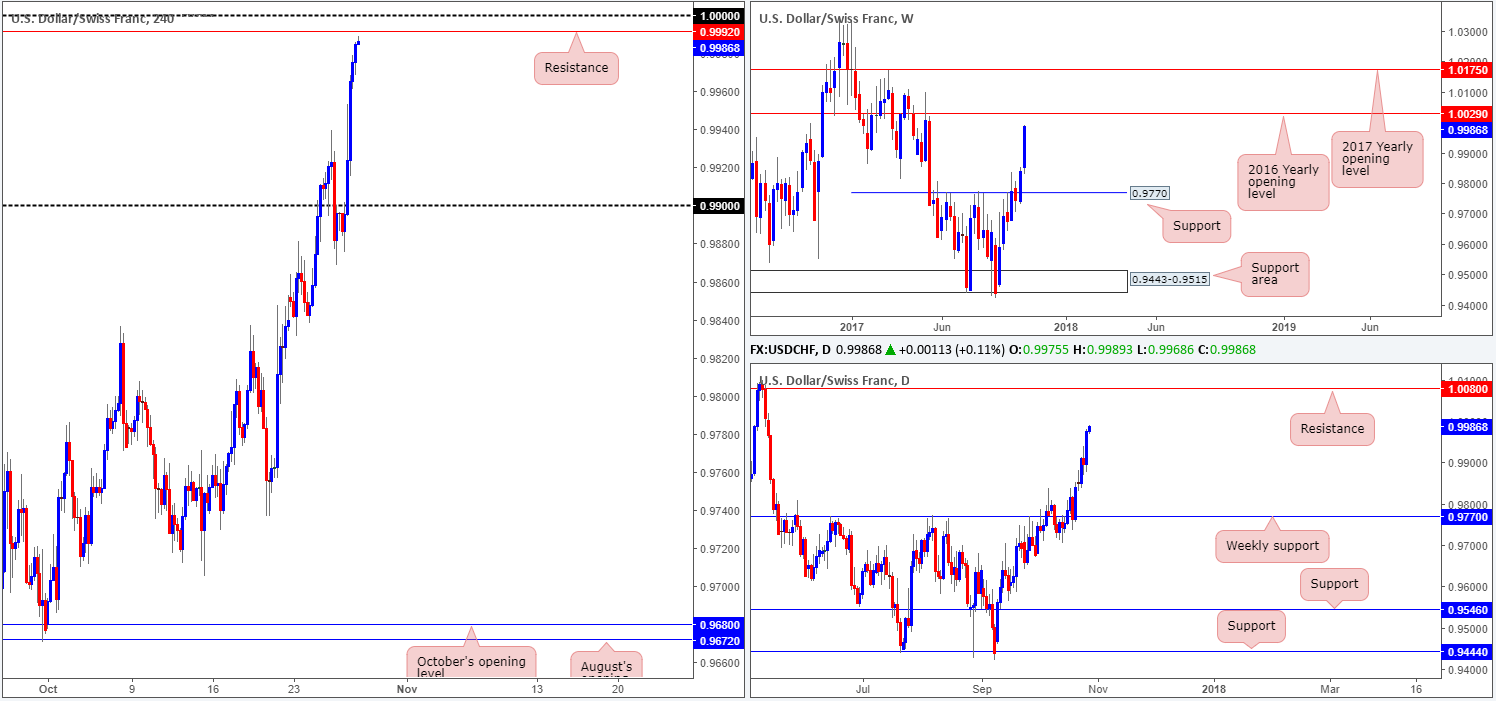
The USD/CHF was heavily bid on Thursday following the ECB’s announcement that it would cut its bond purchases in half to 30 billion euros a month from January. Up 0.84%, the pair ended the day closing just ahead of a H4 resistance drawn from 0.9992, followed closely by parity (1.0000). Also noteworthy is the weekly timeframe – yesterday’s advance brought the Swissie up to within striking distance of the 2016 yearly opening level at 1.0029. Although daily price shows room to surpass the noted weekly barrier, we feel that between 1.0029 and parity, active sellers will look to try and hinder further buying.
Suggestions: Put simply, we will be watching 1.0029/1.0000 for possible shorts today. In the event that H4 price chalks up a reasonably sized bearish candle from here, preferably a full or near-full-bodied candle, this, in our opinion, would be enough to warrant a sell, with stops either tucked above 1.0029 or above the wick of the reversal candle.
Data points to consider: US advance GDP q/q at 1.30pm; US revised UoM consumer sentiment at 3pm GMT+1.
Levels to watch/live orders:
- Buys: Flat (stop loss: N/A).
- Sells: 1.0029/1.0000 ([waiting for a reasonably sized H4 bearish candle to form – preferably a full or near-full-bodied candle – is advised] stop loss: ideally beyond the candle’s wick).
DOW 30:
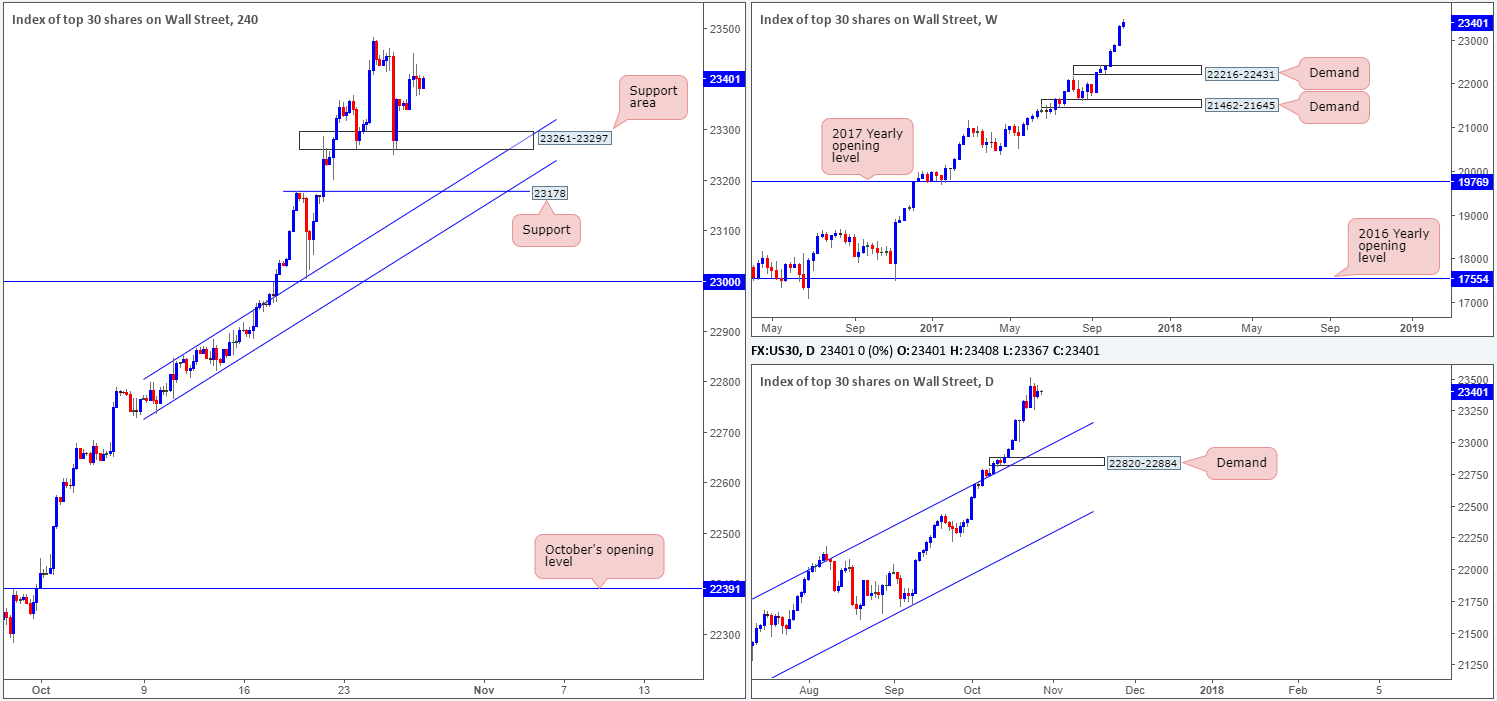
For those who read Thursday’s report you may recall that our desk entered long at 23356, with stops a stop-loss order at 23240. The long was based on price responding from a H4 support area at 23261-23297 and forming a nice-looking near-full-bodied H4 bullish candle.
Suggestions: What we’re looking for here is a push up to fresh highs. This will be our cue to reduce risk to breakeven and begin thinking about taking some profits off the table.
Data points to consider: US advance GDP q/q at 1.30pm; US revised UoM consumer sentiment at 3pm GMT+1.
Levels to watch/live orders:
- Buys: 23356 ([live] stop loss: 23240).
- Sells: Flat (stop loss: N/A).
GOLD:
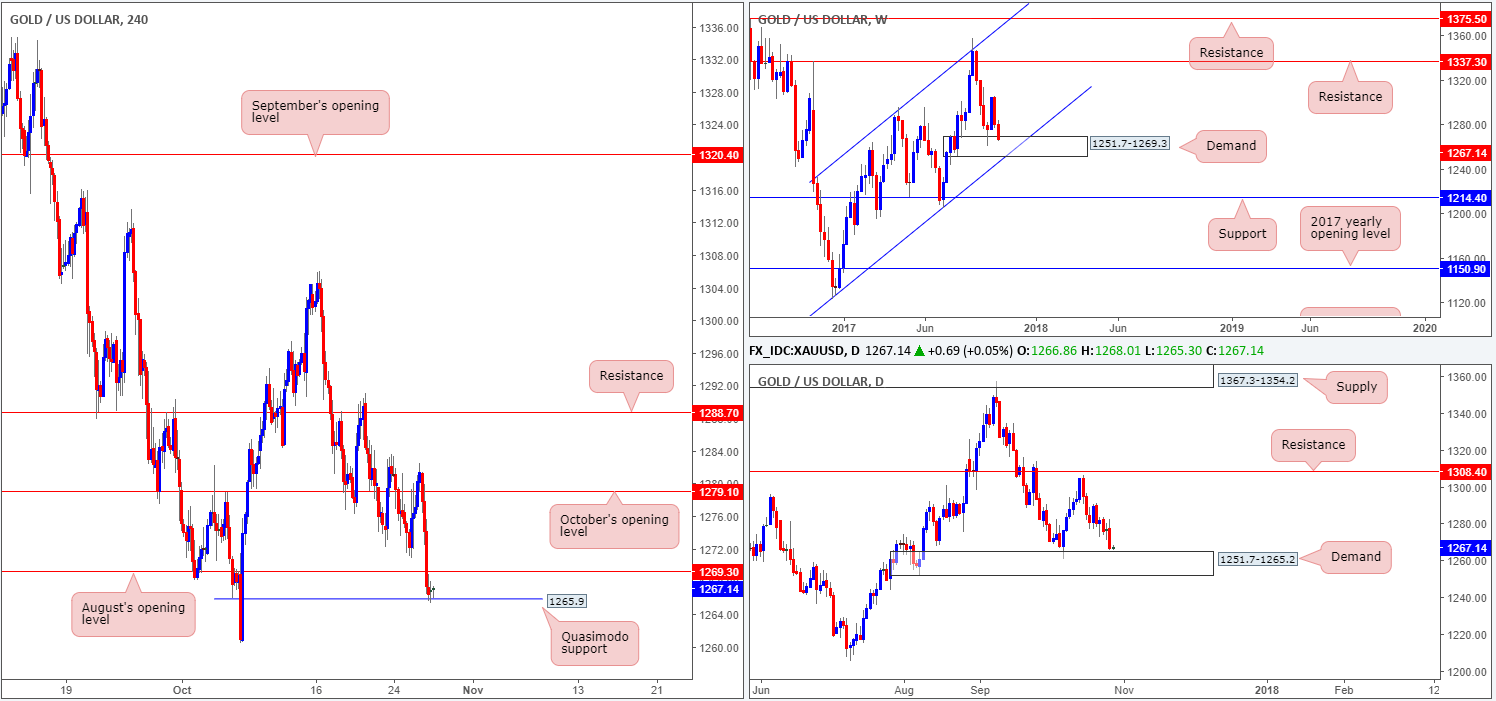
Across the board, the US dollar aggressively punched higher on Thursday, consequently pressuring the yellow metal lower. October’s opening level at 1279.1 was the first level to receive the chop, which was shortly followed by August’s opening base line at 1269.3. The day ended mildly paring gains around a H4 Quasimodo support located at 1265.9.
Also center stage this morning is weekly price which recently entered into the walls of a demand area penciled in at 1251.7-1269.3. On top of this, we can also see that daily movement is trading within shouting distance of a demand coming in at 1251.7-1265.2 (sited within the lower limits of the said weekly demand).
Suggestions: With both weekly and daily structures seen in play right now, longs from the aforementioned H4 Quasimodo support level could be an option today. To take advantage of this move and avoid any active sellers that may reside around Aug’s opening level at 1269.3 (now acting resistance), we would strongly recommend waiting for H4 price to close above this monthly level before looking for long plays. At least that way you can feel relatively confident that gold may make it back up to at least 1279.1.
Levels to watch/live orders:
- Buys: Watch for H4 price to engulf 1269.3 and then look to trade any retest seen thereafter ([waiting for a reasonably sized H4 bullish candle to form following the retest – preferably a full or near-full-bodied candle – is advised] stop loss: ideally beyond the candle’s tail).
- Sells: Flat (stop loss: N/A).


