
Key risk events today:
Limited.
(Previous analysis as well as outside sources – italics)
EUR/USD:
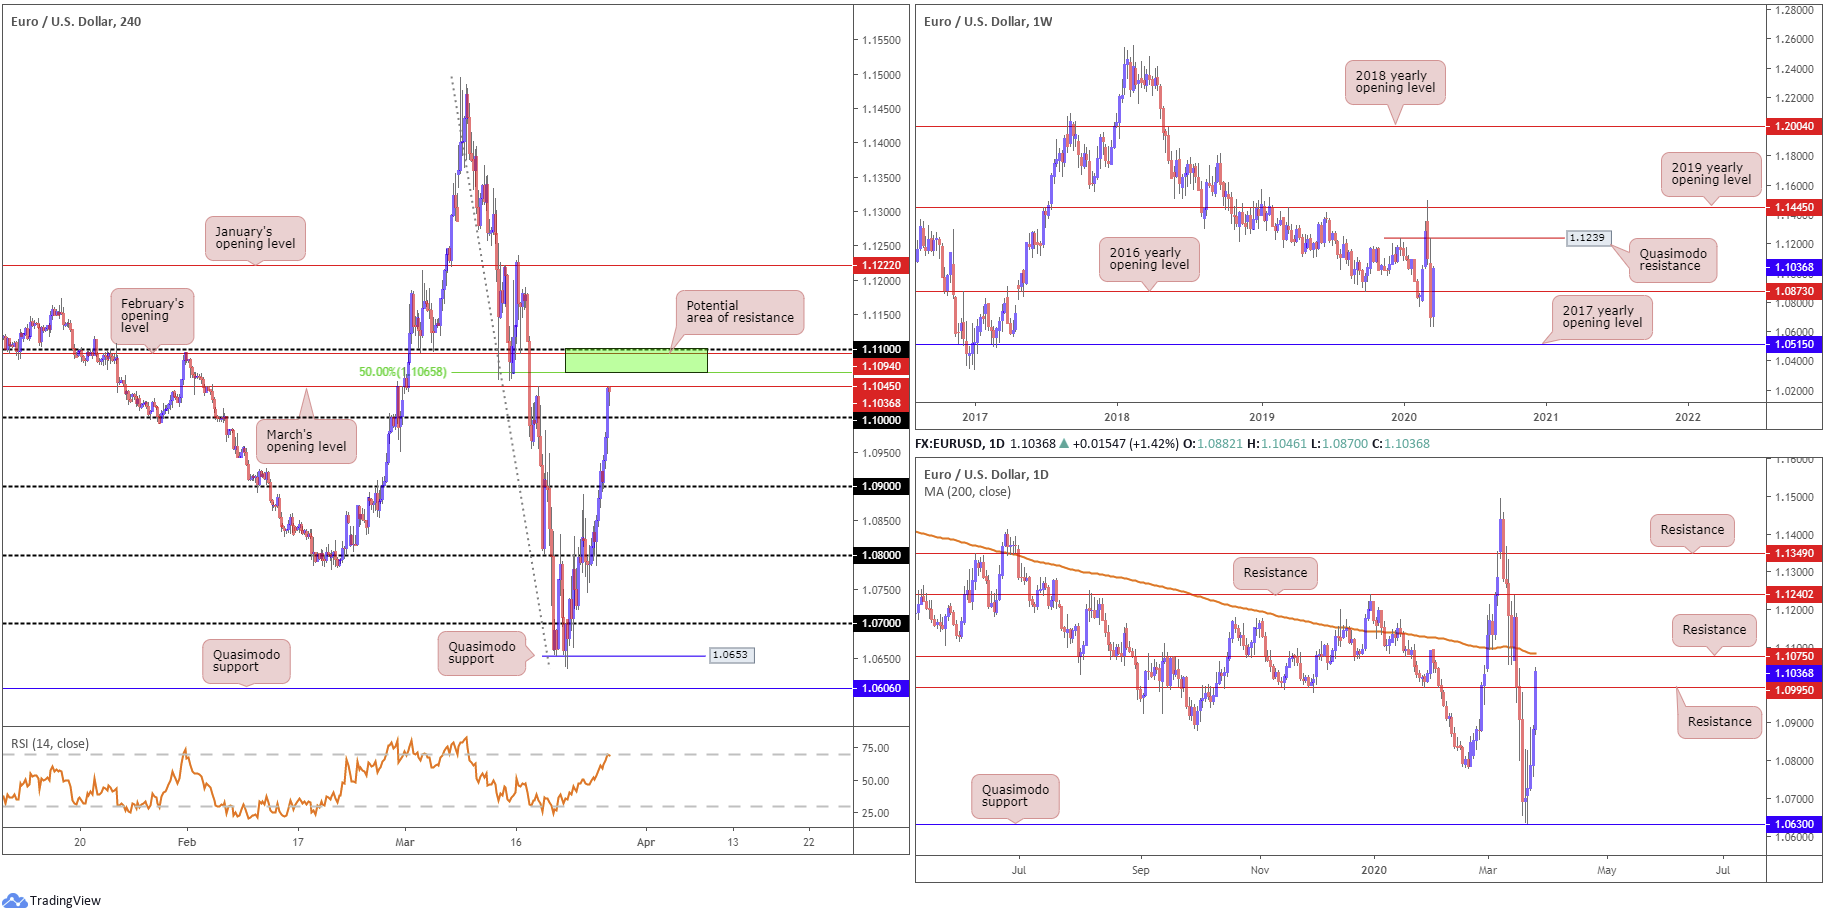
Dollar trade softened vs. all G10 counterparts Thursday, following weekly US initial claims soaring by nearly 3.3 million, setting a fresh all-time high, due to the coronavirus. With the dollar index languishing sub 100.00, EUR/USD firmed through the widely watched key figure 1.10 to highs of 1.1046.
March’s opening level at 1.1045 recently entered the mix as possible resistance on the H4 scale, located south of the 50.0% retracement ratio at 1.1065, February’s opening level at 1.1094 and the 1.11 handle. Traders may also find use in noting the relative strength index (RSI) recently touched gloves with overbought territory.
Further afield on the daily timeframe, price overthrew resistance coming in at 1.0995, potentially inviting an approach to resistance at 1.1075 today, closely shadowed by a 200-day SMA (orange – 1.1082), which has been drifting lower since May 2018. Scope to extend beyond the said barriers is visible on the weekly timeframe after probing the underside of the 2016 yearly opening level at 1.0873, potentially setting the stage for an approach to Quasimodo resistance at 1.1239.
Areas of consideration:
Despite recent upside and weekly price suggesting additional gains are on the horizon, chart studies on H4 and daily timeframes indicate we’re heading for a potential ceiling, if only temporary. The area between the round number 1.11, February’s opening level at 1.1094 and the 50.0% retracement at 1.1065 (green) is of interest as possible resistance. Note this area also contains daily resistance at 1.1075 and the 200-day SMA.
A reaction from 1.11/1.1065, preferably formed by way of a H4 bearish candlestick signal, will likely be enough to entice selling back to 1.10, offering traders ample room to manoeuvre in terms of risk/reward.
GBP/USD:
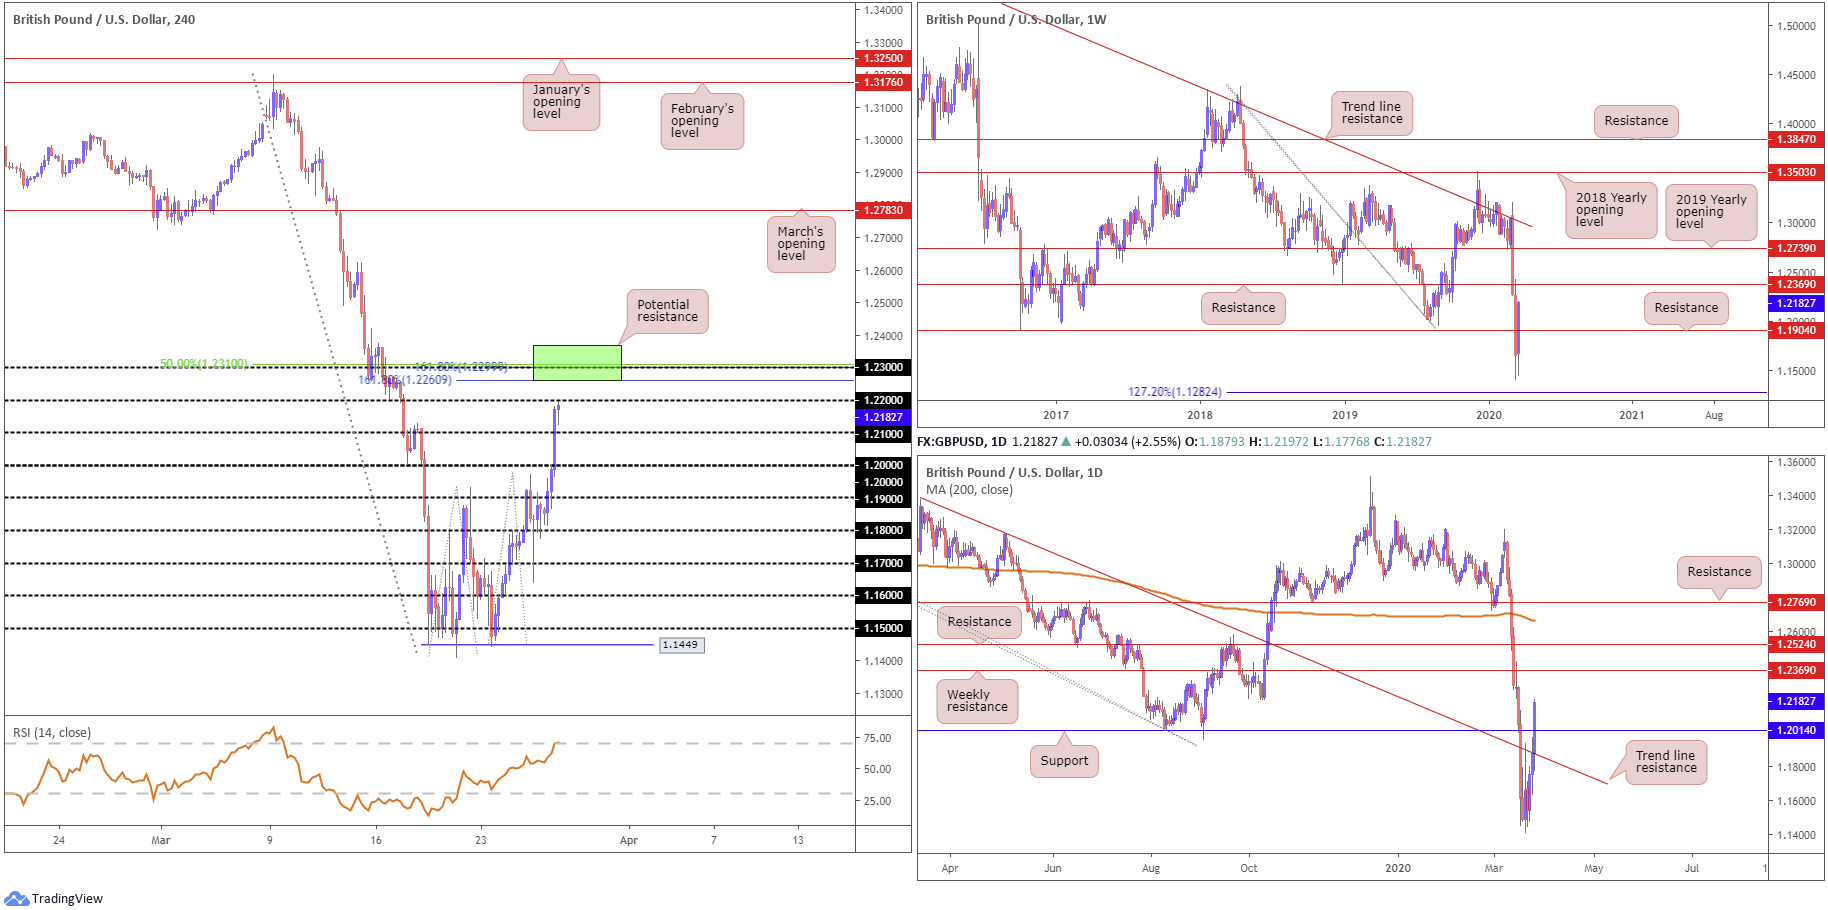
Benefitting largely on the back of the dollar’s demise, GBP/USD exhibited a one-sided market Thursday, gaining more than 2.50%. With the market largely overlooking the BoE an UK retail sales data, the H4 candles are seen testing waters just south of 1.22. While a reaction could materialise, the real test for bulls comes in at 1.2369/1.2260 (the green zone on the H4 timeframe). Note also the H4 relative strength index (RSI) is seen testing overbought terrain.
Comprised of weekly resistance at 1.2369, a 50.0% retracement ratio at 1.2310, the 1.23 handle and two Fibonacci extension levels at 1.2299 and 1.2260, this area could potentially knock the wind out of sterling’s strength.
Areas of consideration:
Breakout buyers north of 1.22 may wish to note the 1.2369/1.2260 base as a possible target/hinderance. In the event a reaction out of the said base is observed and we form a H4 close beneath 1.22, sellers may then strengthen their grip towards the 1.21 vicinity, offering a possible bearish theme for short sellers.
AUD/USD:
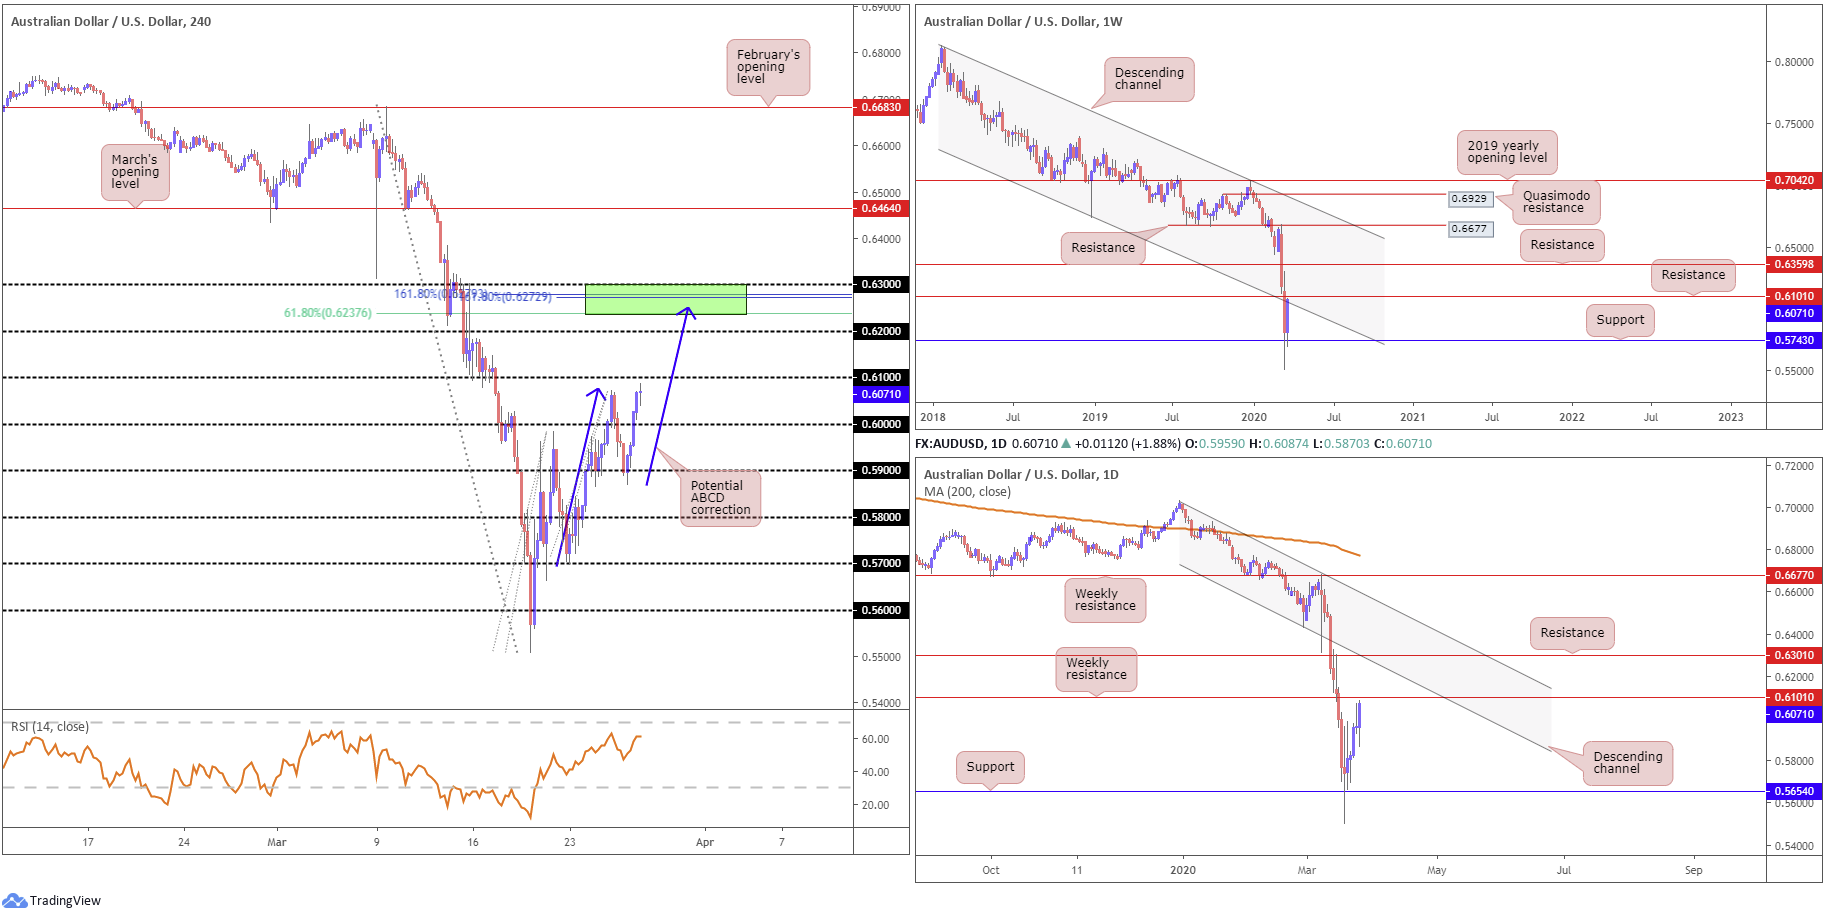
Weekly US initial claims rose above 3 million Thursday, providing fresh impetus to AUD/USD. Gaining nearly 2.00%, and producing a daily bullish outside candlestick formation, the pair is seen poised to tackle 0.61 on the H4 timeframe. It should be noted 0.61 comes packed with a weekly resistance level at 0.6101, stationed nearby channel support-turned resistance, taken from the low 0.6744.
What’s also notable from a technical perspective on the H4 timeframe is a potential ABCD correction (blue arrows), terminating at 0.6255. Joining this region, technicians note the 0.63 handle, two 161.8% Fibonacci extensions at 0.6279 and 0.6272, a 61.8% Fibonacci retracement at 0.6237 and daily resistance at 0.6301 (green). The relative strength index (RSI), for those who follow momentum-based indicators, will also note the value is seen loitering around its 60.00 level, a touch south of traditional overbought ground.
Areas of consideration:
Having noted the appearance of weekly resistance at 0.6101 and weekly channel support-turned resistance, a response generated from the 0.61 handle on the H4 timeframe will not be a surprise for most price action traders. Coupled with the formation of a H4 bearish candlestick pattern, this may tempt bearish themes with 0.60 in sight as an initial target.
In the event we disregard weekly structure in favour of higher ground, traders’ crosshairs will then likely be fixed on 0.63ish and its surrounding confluence as an upside target for any long positions taken north of 0.61, as well as a potential spot to consider bearish scenarios, given the surrounding confluence (see above in bold).
USD/JPY:
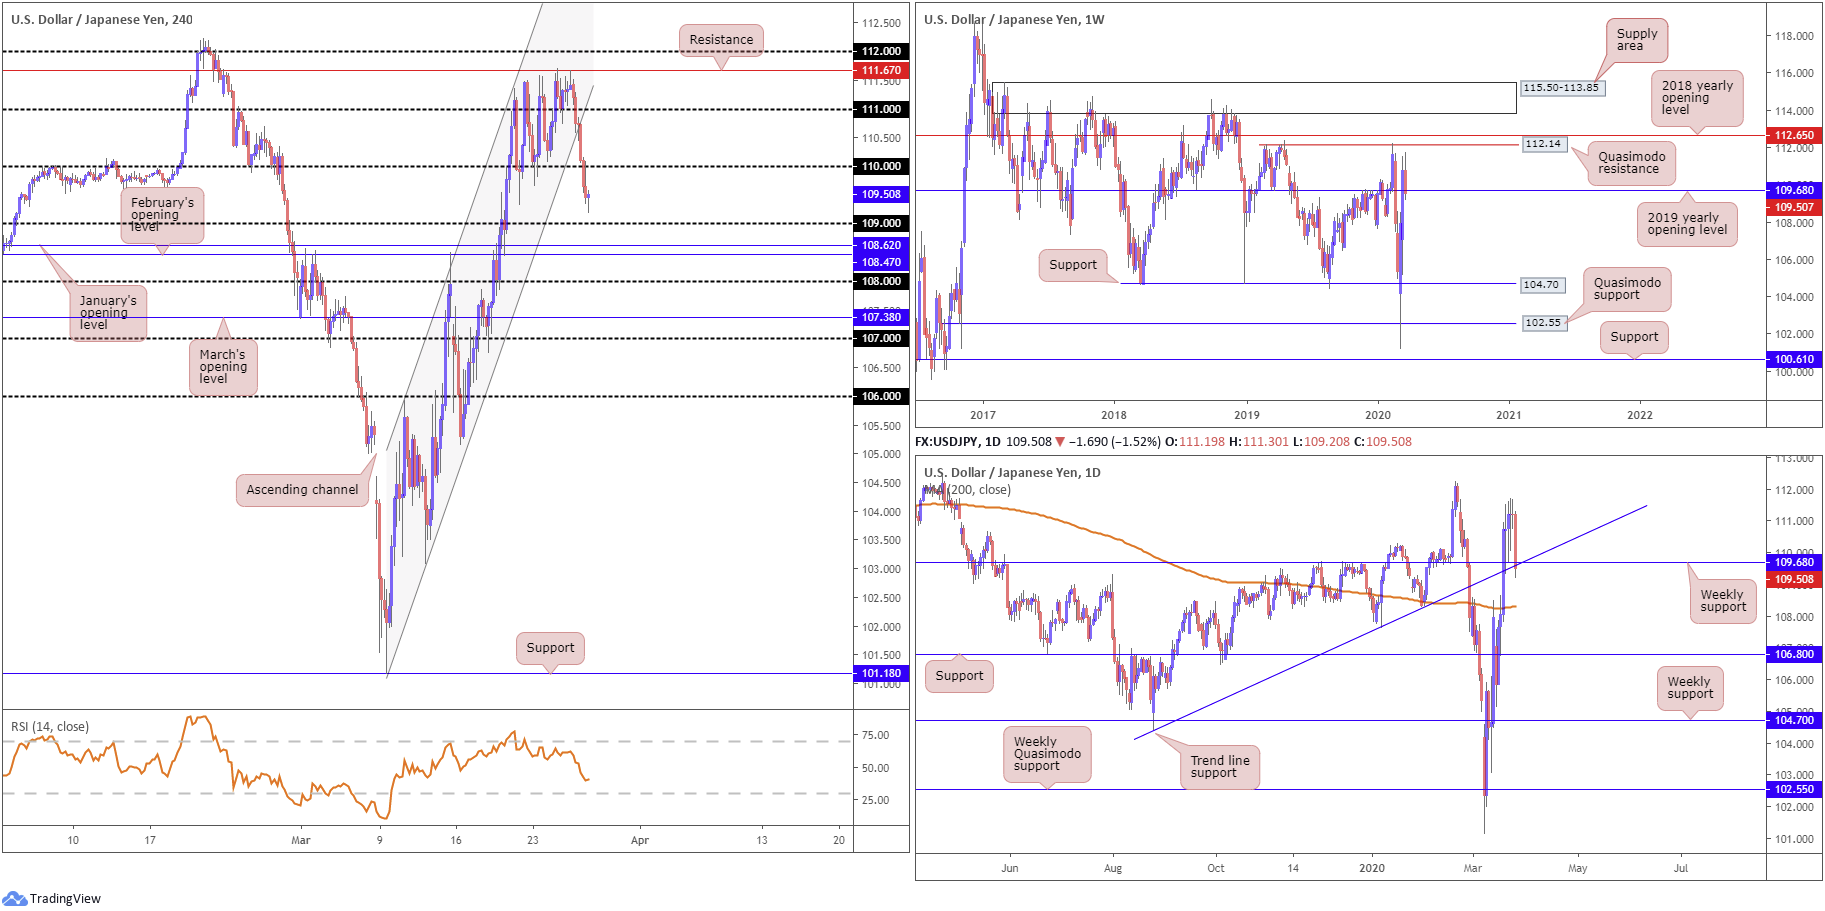
The outlook for the US dollar dimmed further Thursday, following a sharp rise in US jobless claims in response to the coronavirus pandemic. The US dollar index channelled through 100.00, weighing on USD/JPY which stood pretty much motionless since the beginning of the week.
In the shape of a near-full-bodied daily bearish candle, weekly support, by way of the 2019 yearly opening level, at 109.68 entered the fold, along with daily trend line support, extended from the low 104.44. Further losses will focus the spotlight on the 200-day SMA (orange – 108.30).
A closer examination of price action on the H4 timeframe reveals recent downside breached channel support, taken from the low 101.18, and dethroned 110, perhaps unlocking the shackles to 109, followed by February and January’s opening level at 108.47 and 108.62, respectively. Also noteworthy is the relative strength index (RSI) nosediving through 50.00, with eyes now on oversold levels.
Areas of consideration:
Weekly support at 109.68 welcoming a test, alongside aligning daily trend line support, suggests scope for a recovery today. Though whether a dip to 109 on the H4 may be seen beforehand is difficult to judge.
Conservative longs might seek additional confirmation before engaging, as psychological levels, such as the 109 band, are prone to whipsaws. The initial upside target, irrespective of entering from 109.68 or 109, rests at the 110 handle.
USD/CAD:
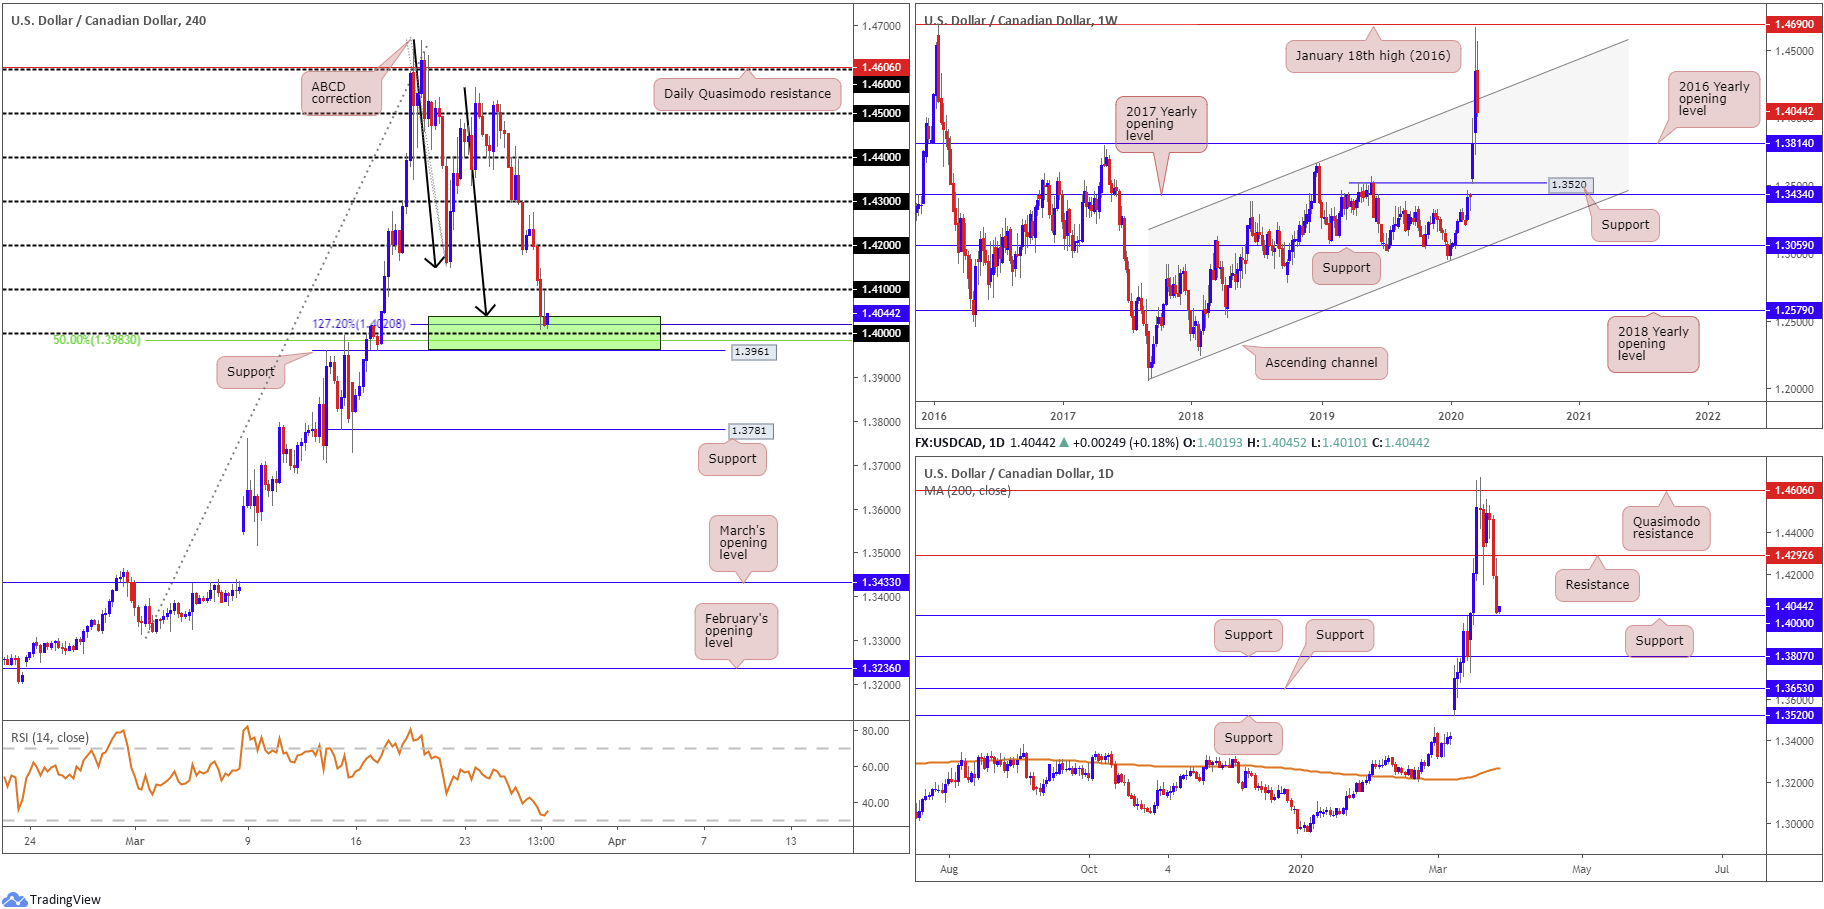
USD/CAD extended losses Thursday, tallying more than 170 points amid broad USD weakness. Unable to glean support from falling crude oil prices, H4 action refreshed weekly lows, shattering 1.41 and nosediving into an interesting area of support between 1.3961, a 50.0% retracement at 1.3983, the 1.40 handle, a 127.2% Fibonacci extension point at 1.4020 and an ABCD (black arrows) completion around 1.4040 (green).
Technical research also shows daily price has eyes on support at 1.4000, housed within the H4 support zone mentioned above from 1.3961/1.4040. Weekly price, on the other hand, has the current candle wrestling with ground marginally beneath channel resistance-turned support, extended from the high 1.3661. This comes after a decisive retracement a few points ahead of January 18th high at 1.4690 (2016).
Areas of consideration:
All (technical) eyes are likely drawn to the H4 support zone highlighted above at 1.3961/1.4040, not only due to its H4 confluence, but also given it merges closely with daily support at 1.4000.
Some traders may feel the technical evidence within 1.3961/1.4040 justifies an entry without the need for further confirmation; others may opt for additional confirmation, likely in the form of a H4 bullish candlestick signal. Upside expectations are likely for a H4 close to form above 1.41.
USD/CHF:
USD/CHF witnessed follow-through downside Thursday amid USD supply, following an unprecedented rise in US jobless claims.
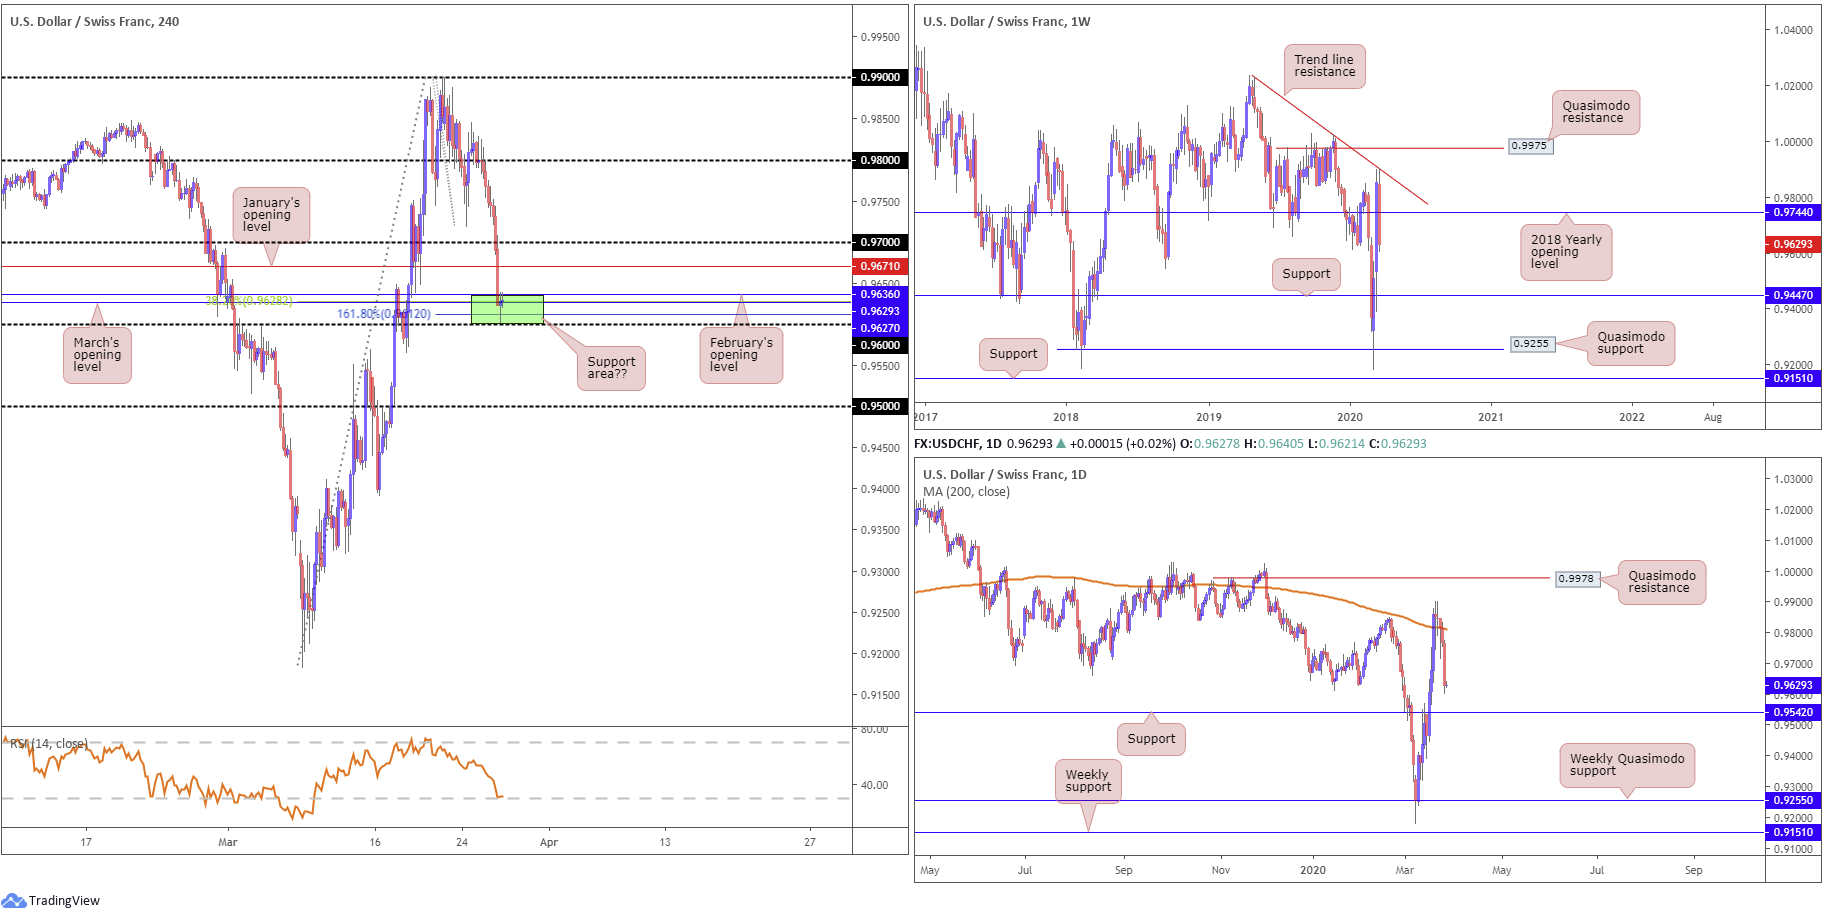
H4 action is seen nursing losses just ahead of 0.96, encapsulated within an interesting combination of support between 0.96, a 161.8% Fibonacci extension at 0.9612, a 38.2% Fibonacci retracement ratio at 0.9628, March’s opening level at 0.9627 and February’s opening level at 0.9636 (green). The next upside target out of this base falls in around January’s opening level at 0.9671, followed by the 0.97 handle. What’s also notable is the relative strength index (RSI) seen testing oversold territory.
Further out, we can see weekly price engulfed support at 0.9744, the 2018 yearly opening level, in recent trade. This might pave the way for further losses on this timeframe towards support at 0.9447, whereas daily flow, after taking hold of the 200-day SMA (orange – 0.9811), has eyes on support coming in at 0.9542.
Areas of consideration:
Despite both weekly and daily timeframes suggestive of moves south of 0.96, confluence on the H4 timeframe manufactured a reasonably attractive area of support between 0.96/0.9636, potentially enticing a lift towards 0.97ish today. Those threatened by higher-timeframe direction echoing a southerly bearing may hold for a H4 bullish candlestick signal before pulling the trigger.
Dow Jones Industrial Average:
Major US benchmarks firmed Thursday, capping their best three-day streaks since the Great Depression. The rise came despite data showing a record 3.3 million Americans filed for unemployment last week. The Dow Jones Industrial Average advanced 1351.62 points, or 6.38%; the S&P 500 also gained 154.51 points, or 6.24%, and the tech-heavy Nasdaq 100 ended higher by 427.51 points, or 5.72%.
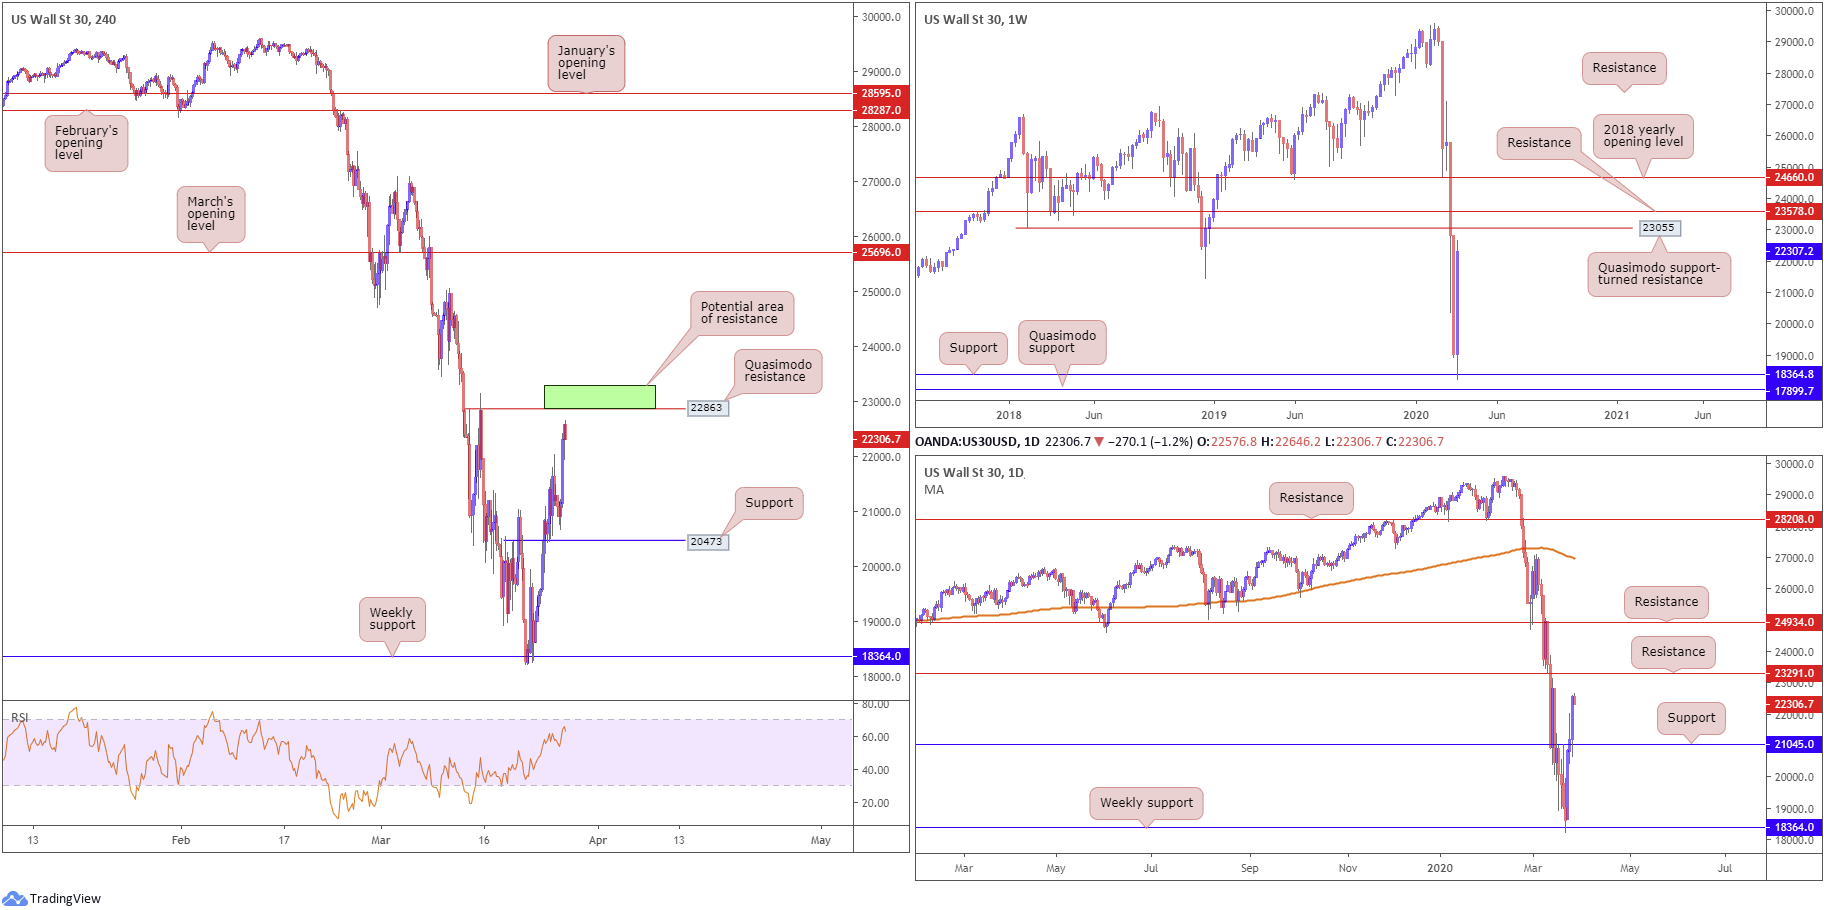
Reclaiming 90% of the prior week’s losses off weekly support at 18364, price has a weekly Quasimodo support-turned resistance at 23055 surfacing nearby, closely shadowed by weekly resistance parked at 23578. Lower on the curve, daily activity retested support coming in from 21045 yesterday, with focus shifting to resistance at 23291.
Across the page on the H4 timeframe, the candles retested support at 20473 Wednesday and rallied to highs at 22585 Thursday, closing within striking distance of Quasimodo resistance at 22863.
Areas of consideration:
Having seen weekly structure offer resistance around 23055, and H4 chart studies pointing the finger towards possible resistance emerging from a Quasimodo formation at 22863 along with daily price eyeing resistance at 23291, this is a potential trouble area for buyers today (green).
In light of the confluence 23291/22863 brings to the table, a H4 bearish candlestick configuration printed from this zone today could be the trigger to pare a portion of recent gains.
XAU/USD (GOLD):
Thursday had gold prices gravitate to higher levels, cheering broad dollar weakness following a rise in US employment claims. Despite refreshing two-week highs at 1645.5, bullion has mildly stepped back in Asia this morning.
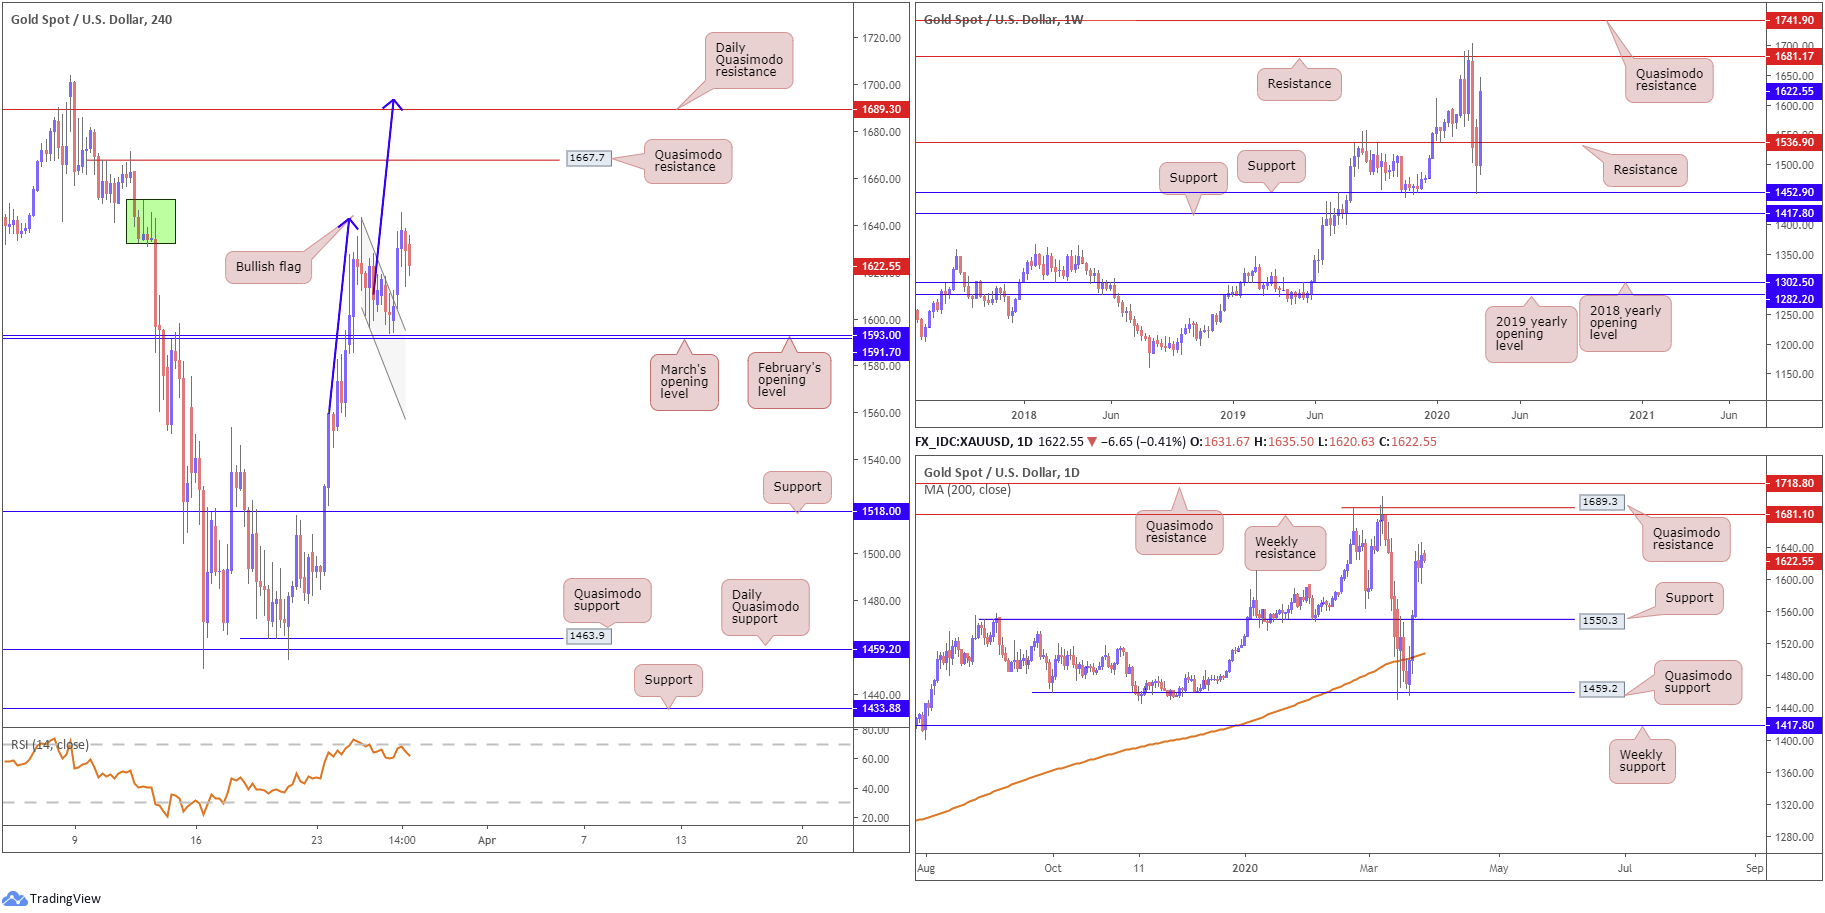
Technically speaking, H4 price is facing off with supply at 1650.3-1633.3 (green), though recently broke out of a tight bullish flag pattern (1643.1/1601.7) – generally considered continuation patterns. Engulfing the said supply, could land Quasimodo resistance in the net at 1667.7, followed by a daily Quasimodo resistance at 1689.3 and the bullish flag take-profit target at 1694.4 (blue arrows). Interestingly, it might also interest some traders to note the relative strength index (RSI) is seen fading overbought waters, producing bearish divergence.
Further out on the higher timeframes, we can see weekly price steaming higher, poised to approach resistance at 1681.1. Meanwhile, daily price recently made its way through resistance at 1550.3 in recent trade, now a serving support level. Like the weekly timeframe, daily movement exhibits scope to firm as far north as weekly resistance at 1681.1, followed by daily Quasimodo resistance at 1689.3.
Areas of consideration:
Ultimately, traders long the break of the current H4 bullish flag pattern have eyes on a push beyond yesterday’s high and the current H4 supply. The break of the former may serve as a cue to reduce risk to breakeven, with noted higher-timeframe resistances in sight as ultimate targets.
The accuracy, completeness and timeliness of the information contained on this site cannot be guaranteed. IC Markets does not warranty, guarantee or make any representations, or assume any liability regarding financial results based on the use of the information in the site.
News, views, opinions, recommendations and other information obtained from sources outside of www.icmarkets.com.au, used in this site are believed to be reliable, but we cannot guarantee their accuracy or completeness. All such information is subject to change at any time without notice. IC Markets assumes no responsibility for the content of any linked site.
The fact that such links may exist does not indicate approval or endorsement of any material contained on any linked site. IC Markets is not liable for any harm caused by the transmission, through accessing the services or information on this site, of a computer virus, or other computer code or programming device that might be used to access, delete, damage, disable, disrupt or otherwise impede in any manner, the operation of the site or of any user’s software, hardware, data or property.


