
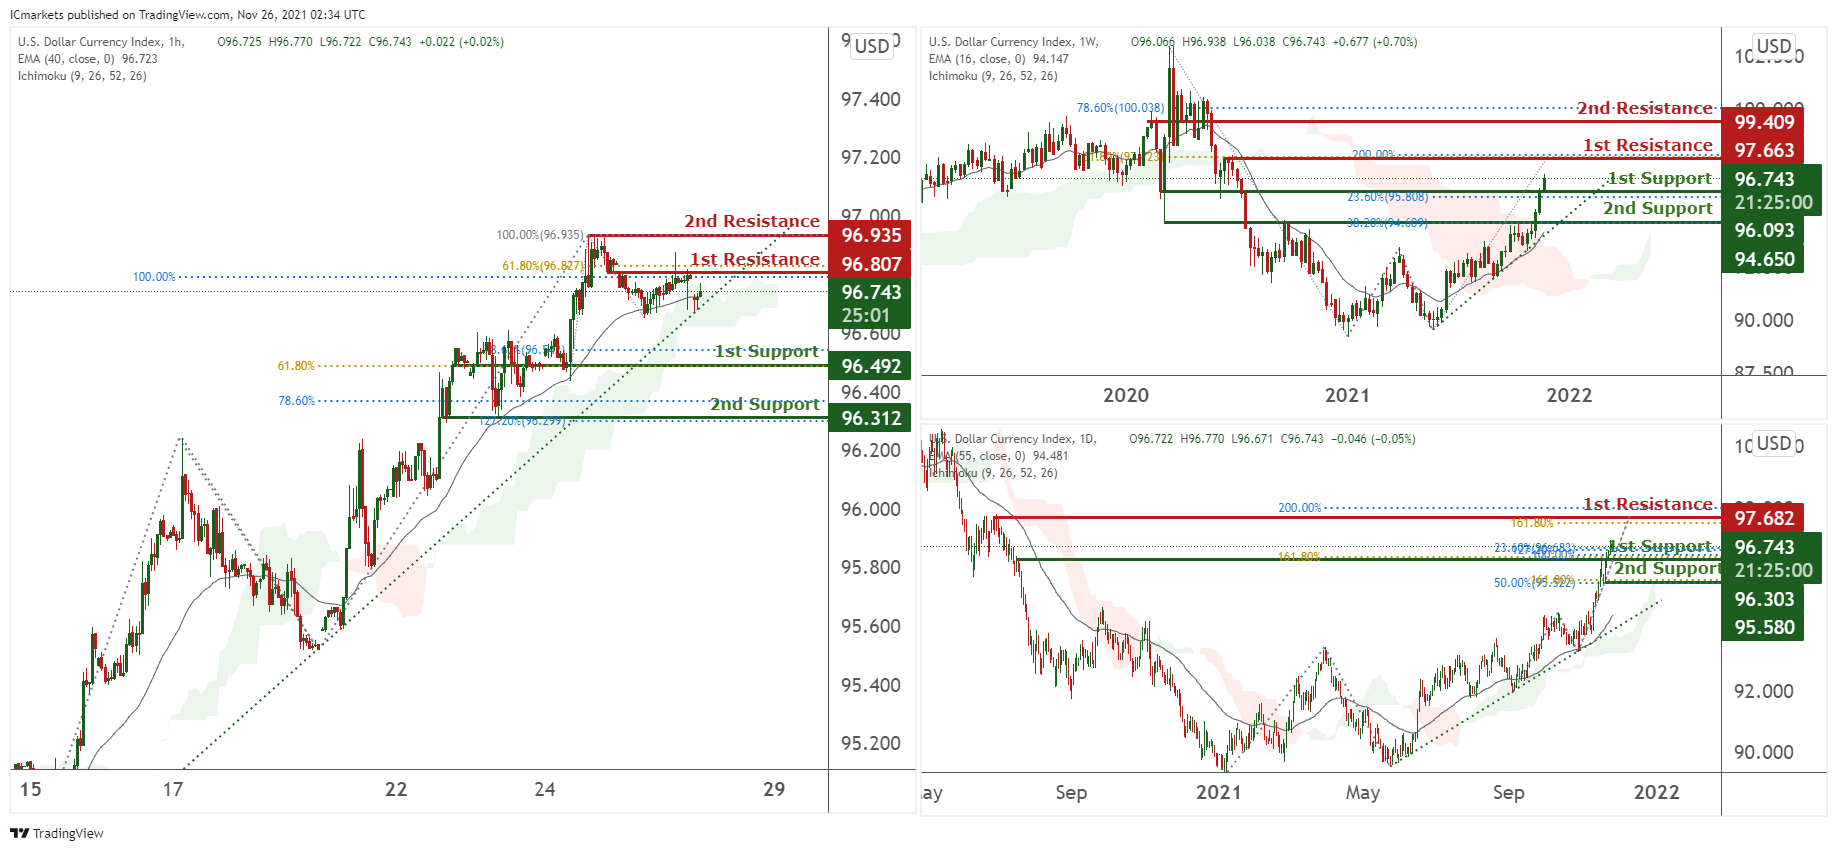
DXY:
On the weekly, prices are on a bullish momentum and abiding to a bullish trendline. We see potential for a bounce from our 1st support at 96.093 in line with 23.6% Fibonacci retracement towards our 1st resistance at 97.663 in line with 100% Fibonacci extension. Technical indicators are showing bullish momentum.
On the daily, prices are on a bullish momentum and abiding to a bullish trendline. We see potential for prices to climb further from our 1st support at 96.303 which is an area of Fibonacci confluences towards 1st resistance at 97.682 in line with 161.8% Fibonacci extension and 200% Fibonacci projection. Technical indicators are showing bullish momentum
On the H4 timeframe, prices are on a bullish momentum and abiding to a daily ascending trendline. We see the potential for a small further upside at our 1st resistance at 96.807 in line with 61.8% Fibonacci retracement and 100% Fibonacci extension. Technical indicators are showing bullish momentum. Alternatively, prices might retest our 1st support at 96.492 which is a graphical overlap.
Areas of consideration:
- H4 time frame, 1st resistance at 96.807
- H4 time frame, 1st support at 96.492
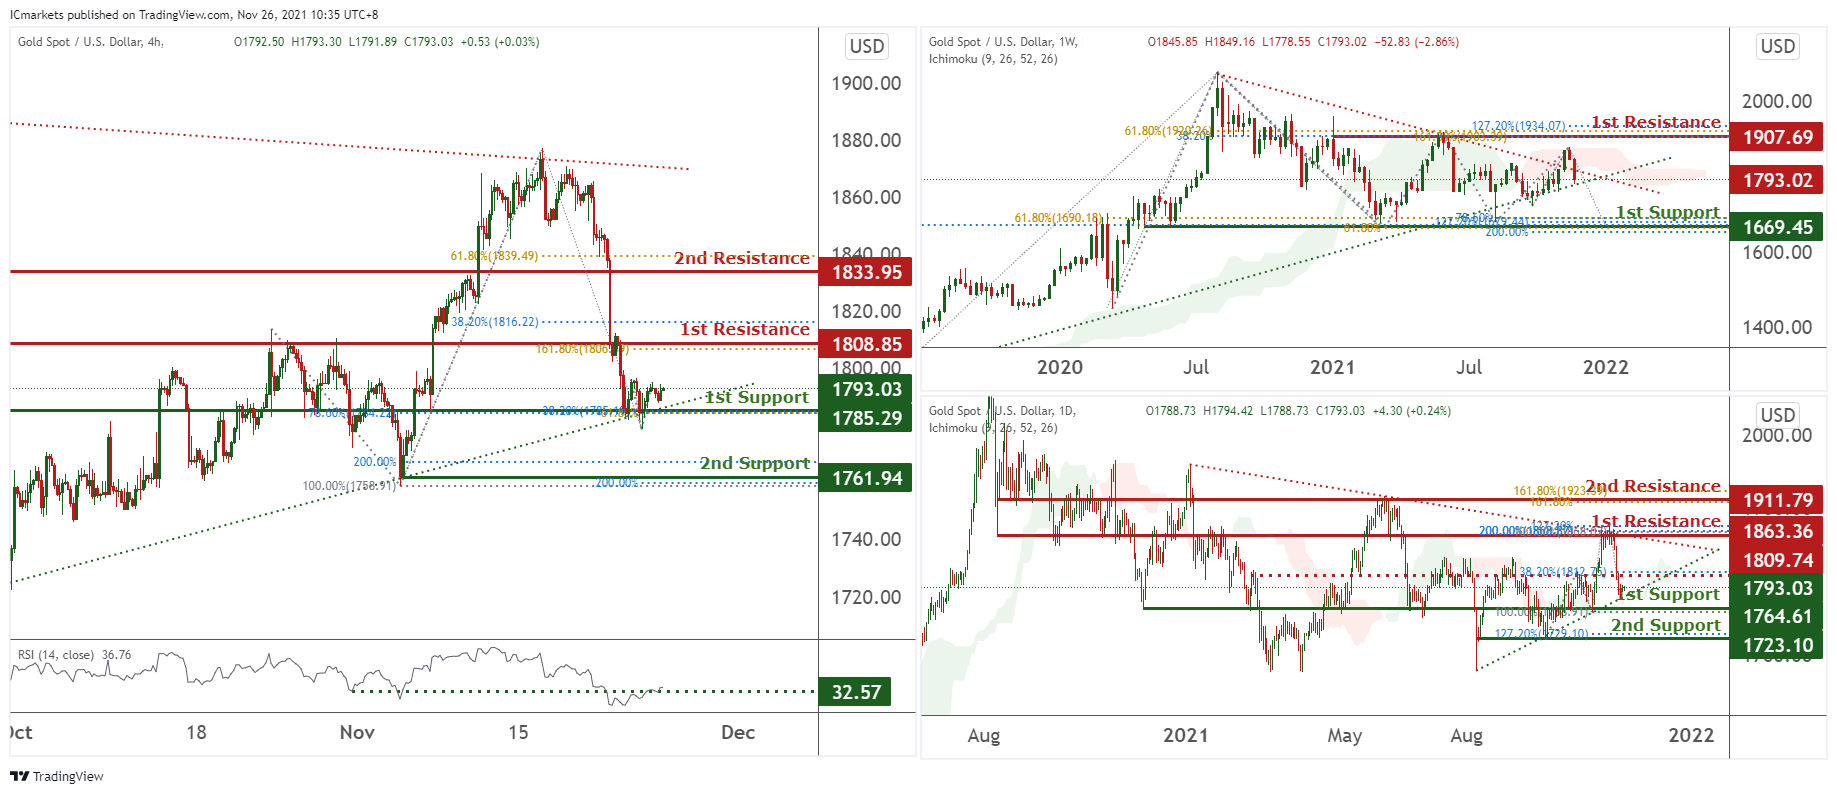
XAU/USD (GOLD):
On the weekly, prices have broken out of our triangle and bearish trendline and have the potential to dip towards our 1st support at 1669.45 which is an area of Fibonacci confluences. Technical indicators are showing bearish momentum.
On the daily, prices are consolidating in a triangle. We see potential for a bounce towards our 1st resistance at 1863.36 in line with 200% and 127.2% Fibonacci extension towards our intermediate support at 1809.94 in line with 50% Fibonacci retracement. Technical indicators are showing bullish momentum.
On the H4 chart, prices are abiding to our daily bullish trendline. We see potential for a bounce from our 1st support at 1785.29 which is an area of Fibonacci confluences towards our 1st resistance at 1808.85 which is an area of Fibonacci confluences. Technical indicators are showing bullish momentum. Alternatively, breaking our 1st support will find prices dipping further towards our 2nd support at 1761.94 in line with 200% Fibonacci extension and 100% Fibonacci retracement.
Areas of consideration:
- 4h 1st support at 1785.29
- 4h 1st resistance at 1808.85
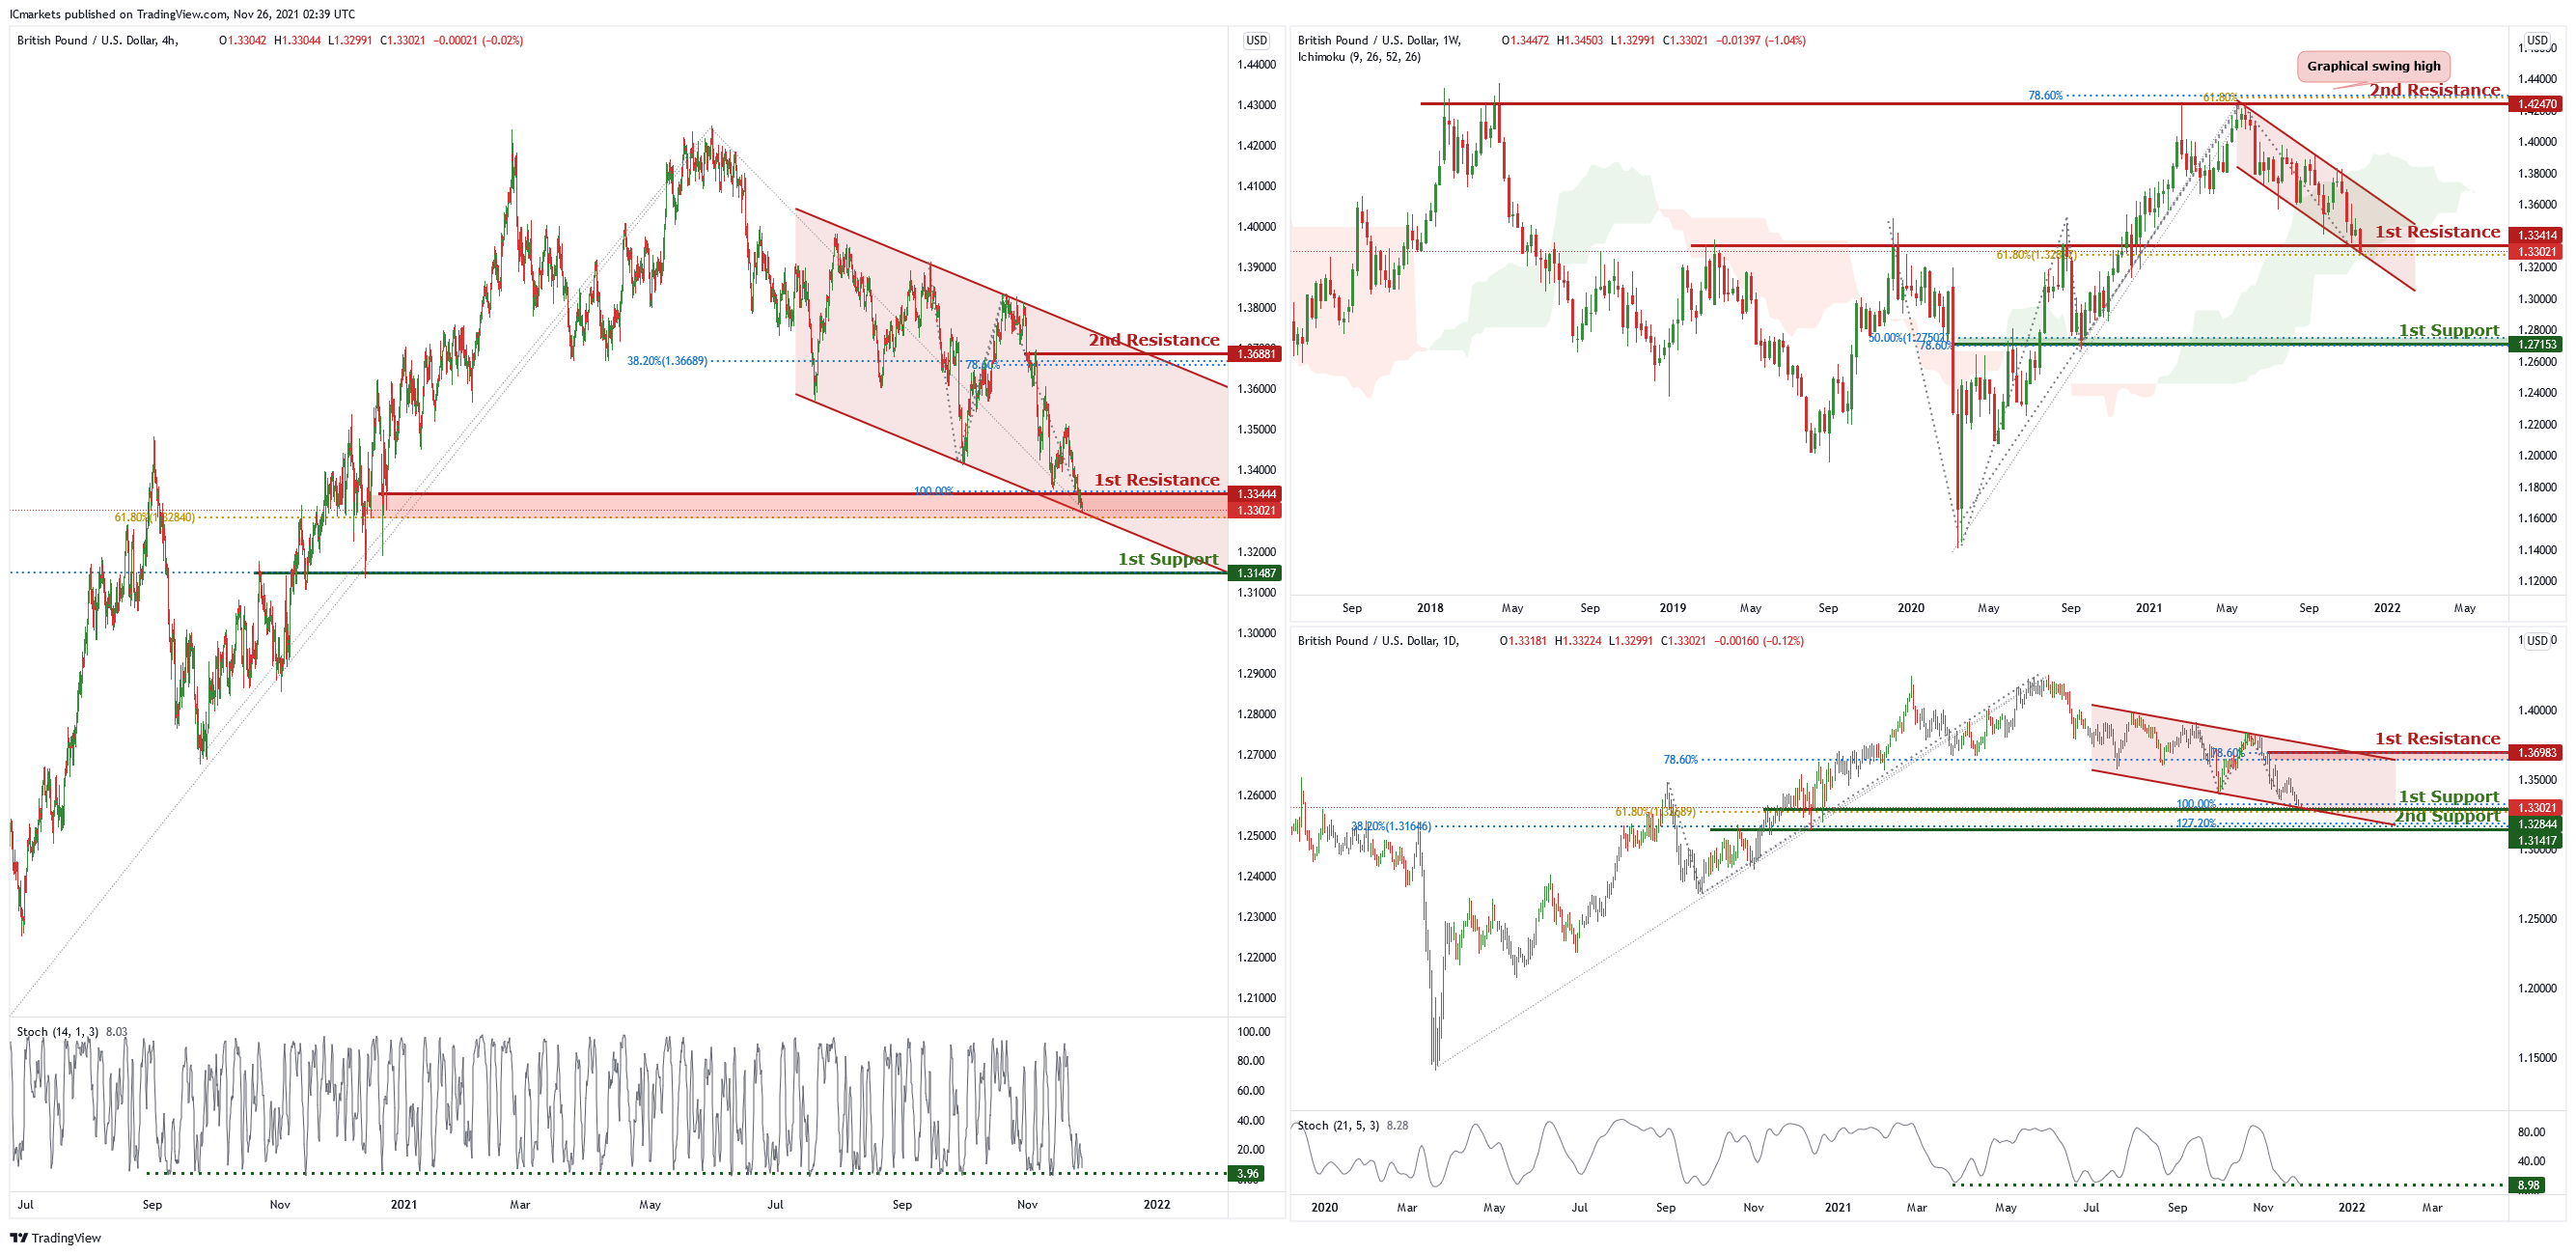
GBP/USD
On the weekly chart, price is trading in a descending channel and is near the first resistance level of 1.33414 which is also 61.8% Fibonacci retracement. Price can potentially dip to the first support level of 1.27153 which is also 50% Fibonacci retracement and 78.6% Fibonacci projection. Our bearish bias is supported by the ichimoku cloud indicator as price is trading under it.
On the daily chart, price is trading in a descending channel and is near the first support level of 1.33004. Price can potentially have a short bounce to the first resistance level of 1.36983 which is also 78.6% Fibonacci retracement and 78.6% Fibonacci projection. Our bullish bias is supported by the stochastic indicator as it is near support level.
On the H4 chart price is near the first resistance level of 1.33444 which is also 100% Fibonacci projection and 61.8% Fibonacci retracement. Price can potentially experience a short bounce to the 2nd resistance level of 1.36881 which is also 38.2% Fibonacci retracement and 78.6% Fibonacci projection. Our bullish bias is supported by the stochastic indicator as it is at support level.
Areas of consideration :
H4 first support – 1.31487
H4 first resistance – 1.33444
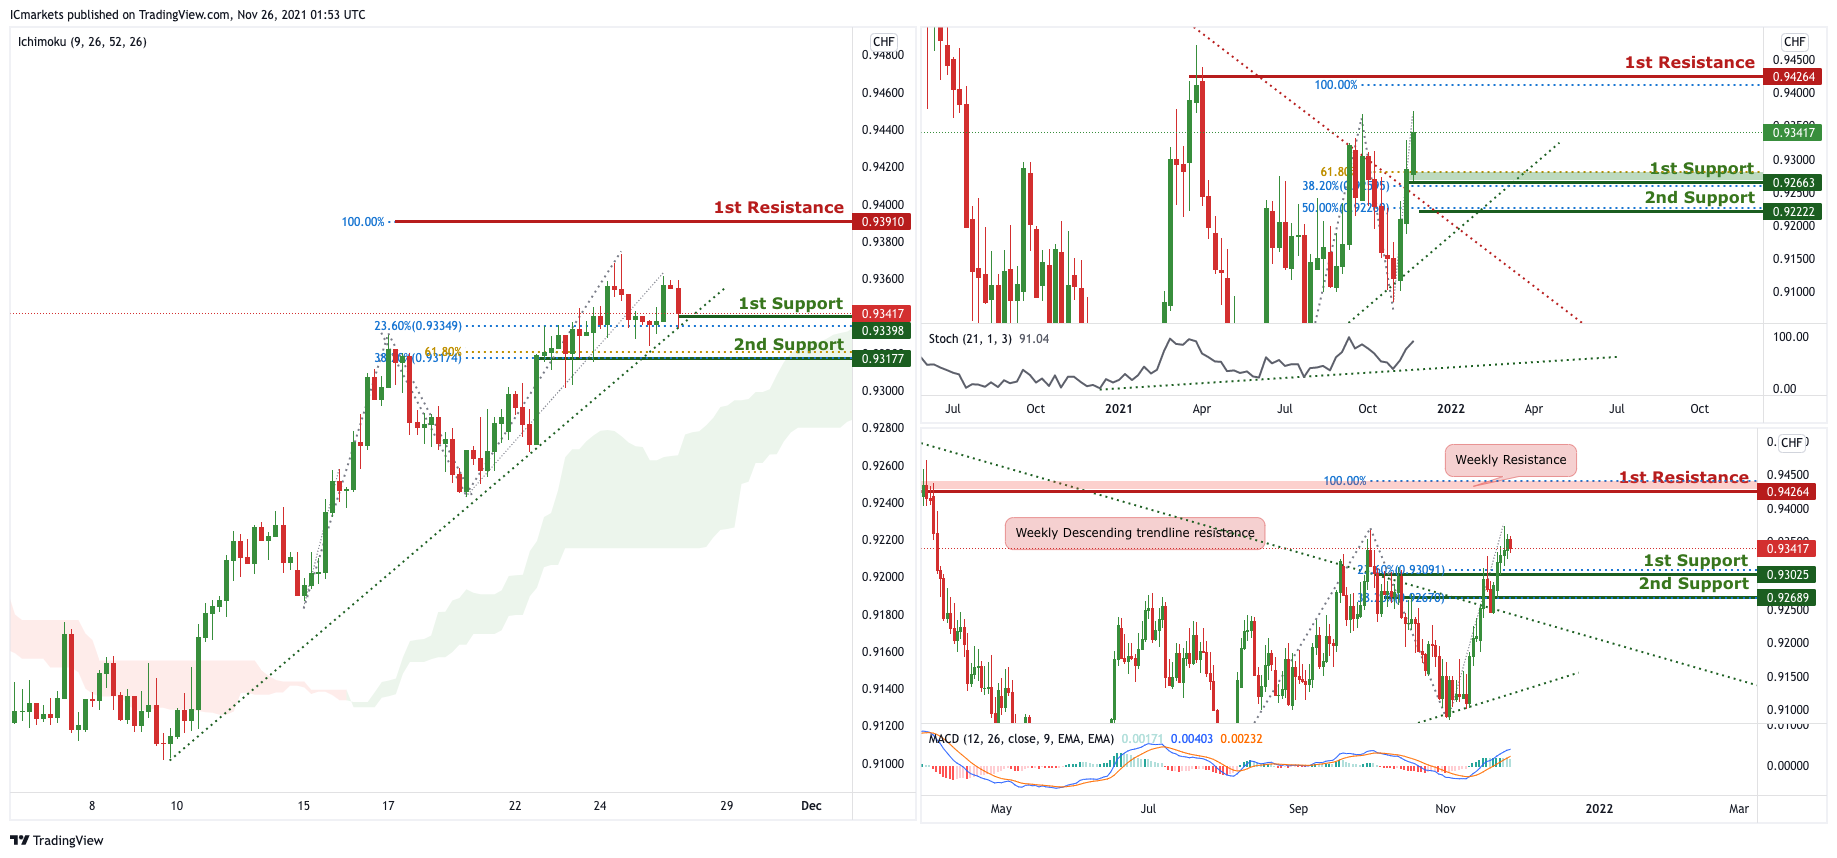
USD/CHF:
In reference to last week’s analysis,on the Weekly timeframe, price indeed bounced to our 1st Resistance level and price broke the descending trendline resistance, signifying a bullish momentum. We can expect price to push up from 1st Support in line with 61.8% Fibonacci projection and 38.2% Fibonacci retracement. Our bullish bias is further supported by the stochastic indicator where the %K line is abiding to the ascending trendline. On the Daily timeframe, we can expect an overall bullish momentum. Price could bounce from 1st Support in line with 23.6% Fibonacci retracement towards 1st Resistance in line with 100% Fibonacci projection. Our bullish bias is further supported by the MACD indicator where the MACD line crosses above the signal line. On the H4 timeframe, price is abiding to the ascending trendline support, signifying an overall bullish momentum. We can expect that price would bounce from the 1st Support in line with 23.6% Fibonacci retracement towards 1st Resistance in line with 100% Fibonacci projection. Our bullish bias is further supported by the Ichimoku cloud indicator where price is holding above it.
Areas of consideration:
- Watch 1st Support at 0.93398
- Watch 1st Resistance at 0.93910
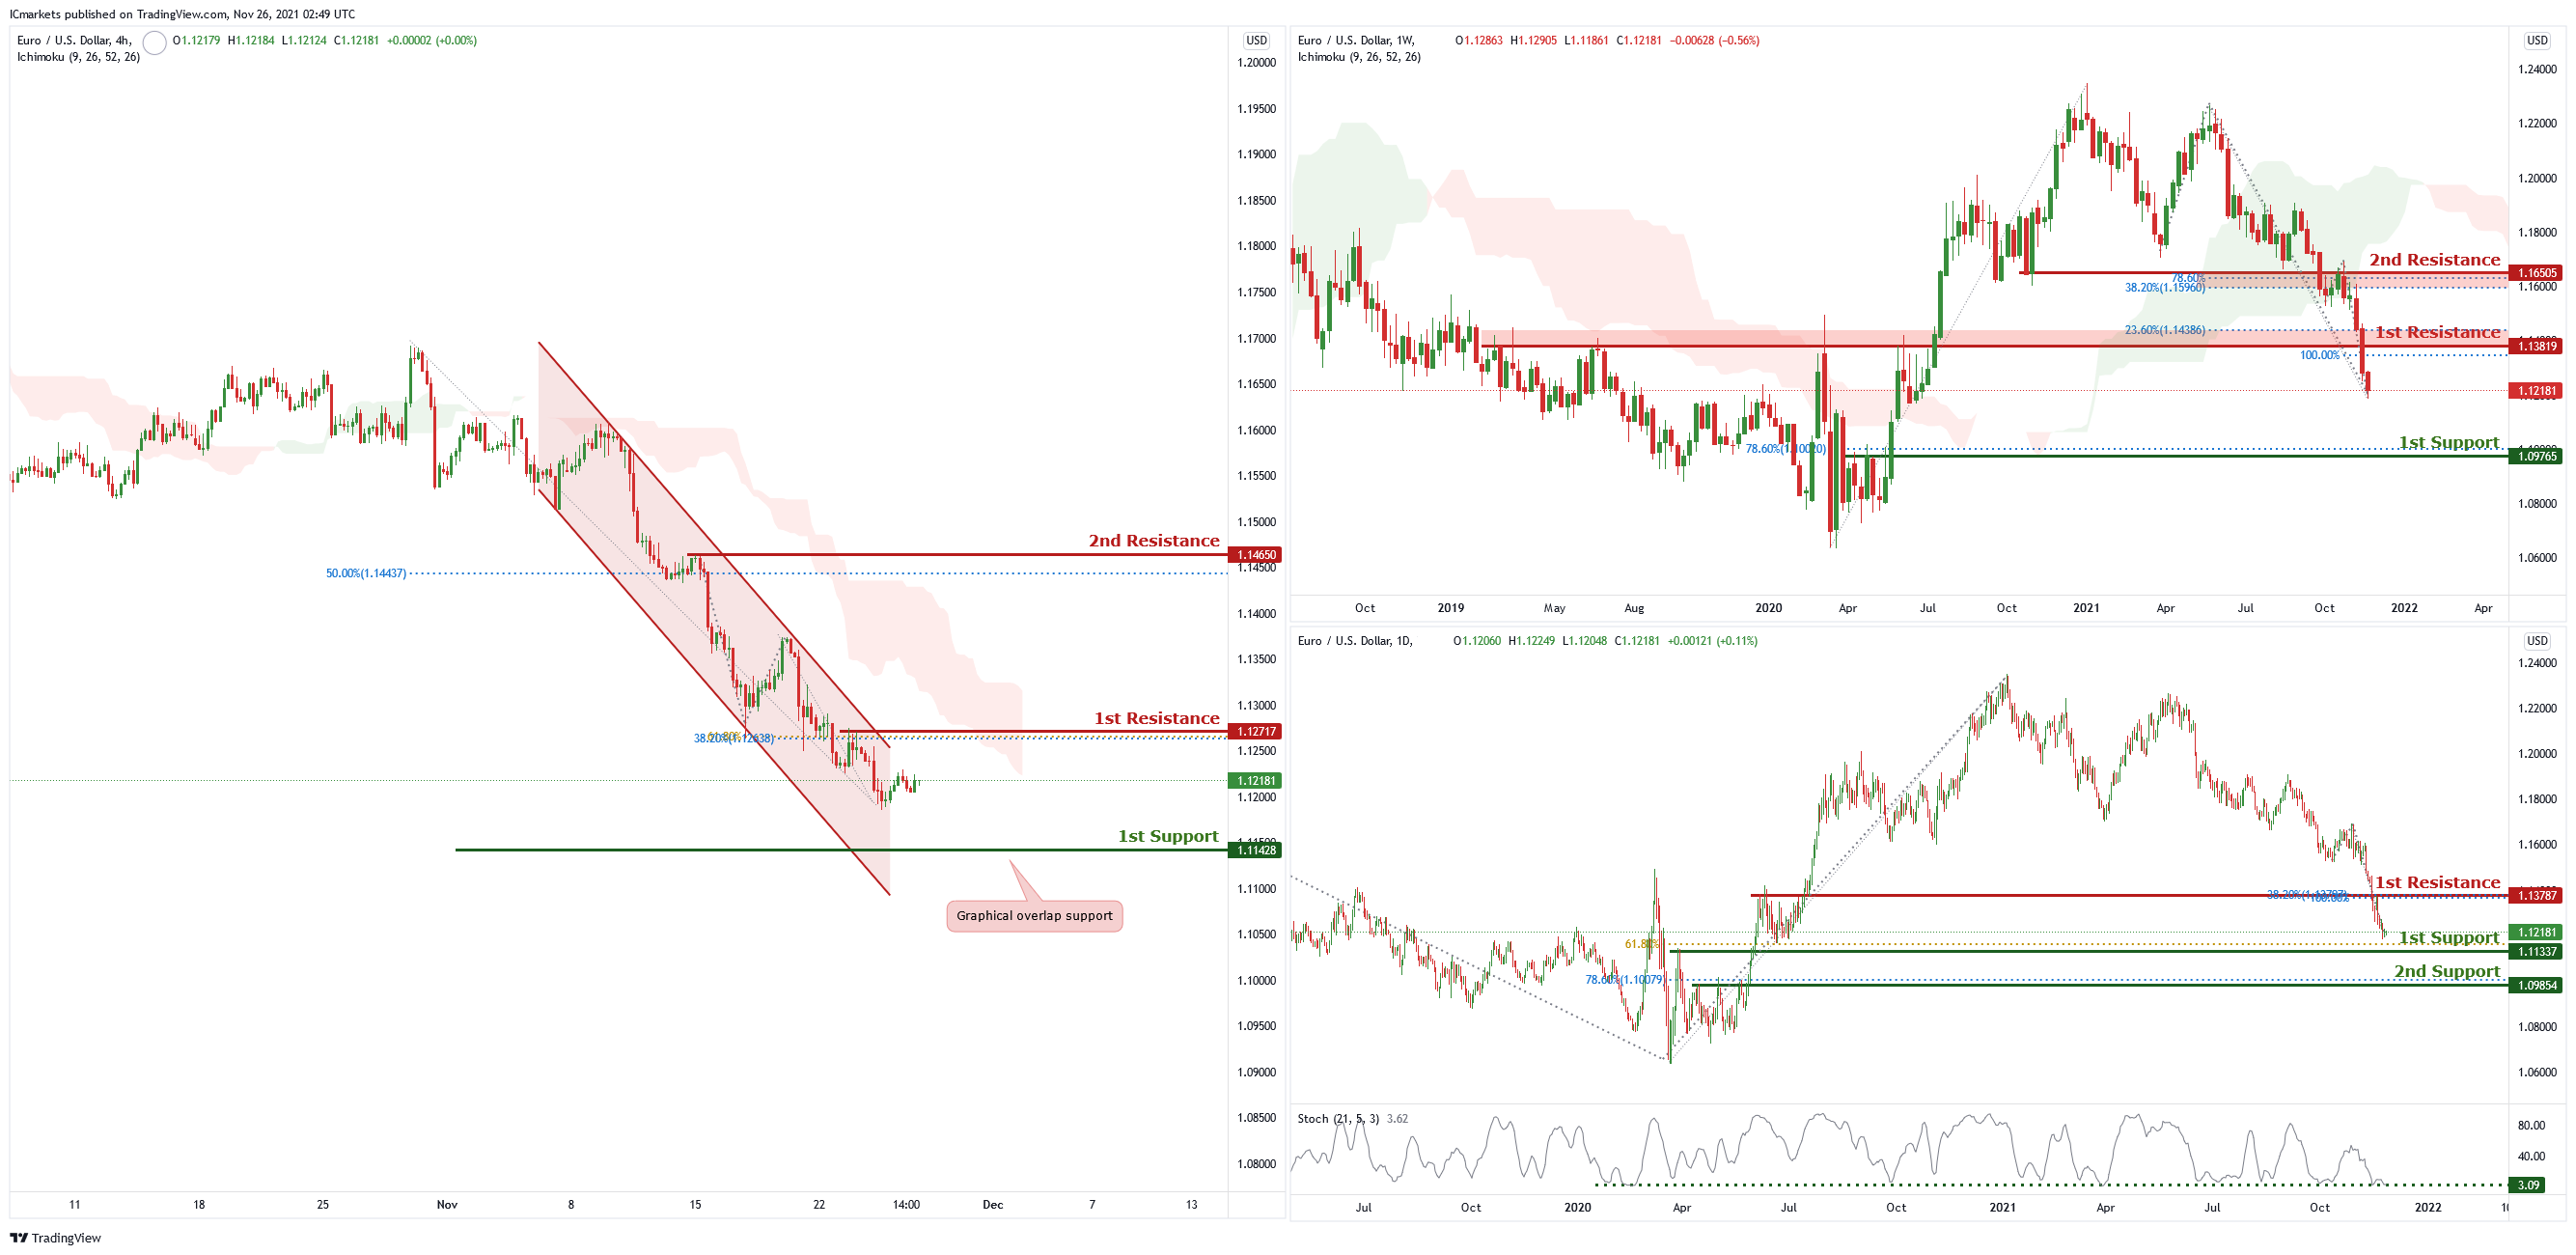
EUR/USD :
On the weekly chart , price is near the first resistance level of 1.13819 which is also 100% Fibonacci projection and 23.6% Fibonacci retracement. Price can potentially dip to the first support level of 1.09765 which is also 78.6% Fibonacci projection. Our bearish bias is supported by the ichimoku cloud indicator as price is trading under it.
On the daily chart, price is near the first support level of 1.1137 which is also 61.8% Fibonacci projection. Price can potentially experience a short bounce from the first support to the first resistance of 1.13787 which is also 38.2% Fibonacci retracement and 100% Fibonacci projection. Our bullish bias is supported by the stochastic indicator as it is near support level.
On the H4 chart, price is trading in a descending channel and near the first resistance level of 1.12717 which is also 38.2% Fibonacci retracement and 61.8% Fibonacci projection. Price can potentially dip to the first support level which is also the graphical overlap support. Our bearish bias is supported by the ichimoku cloud indicator as price is trading under it.
Areas of consideration :
H4 first support – 1.11428
H4 first resistance – 1.12717
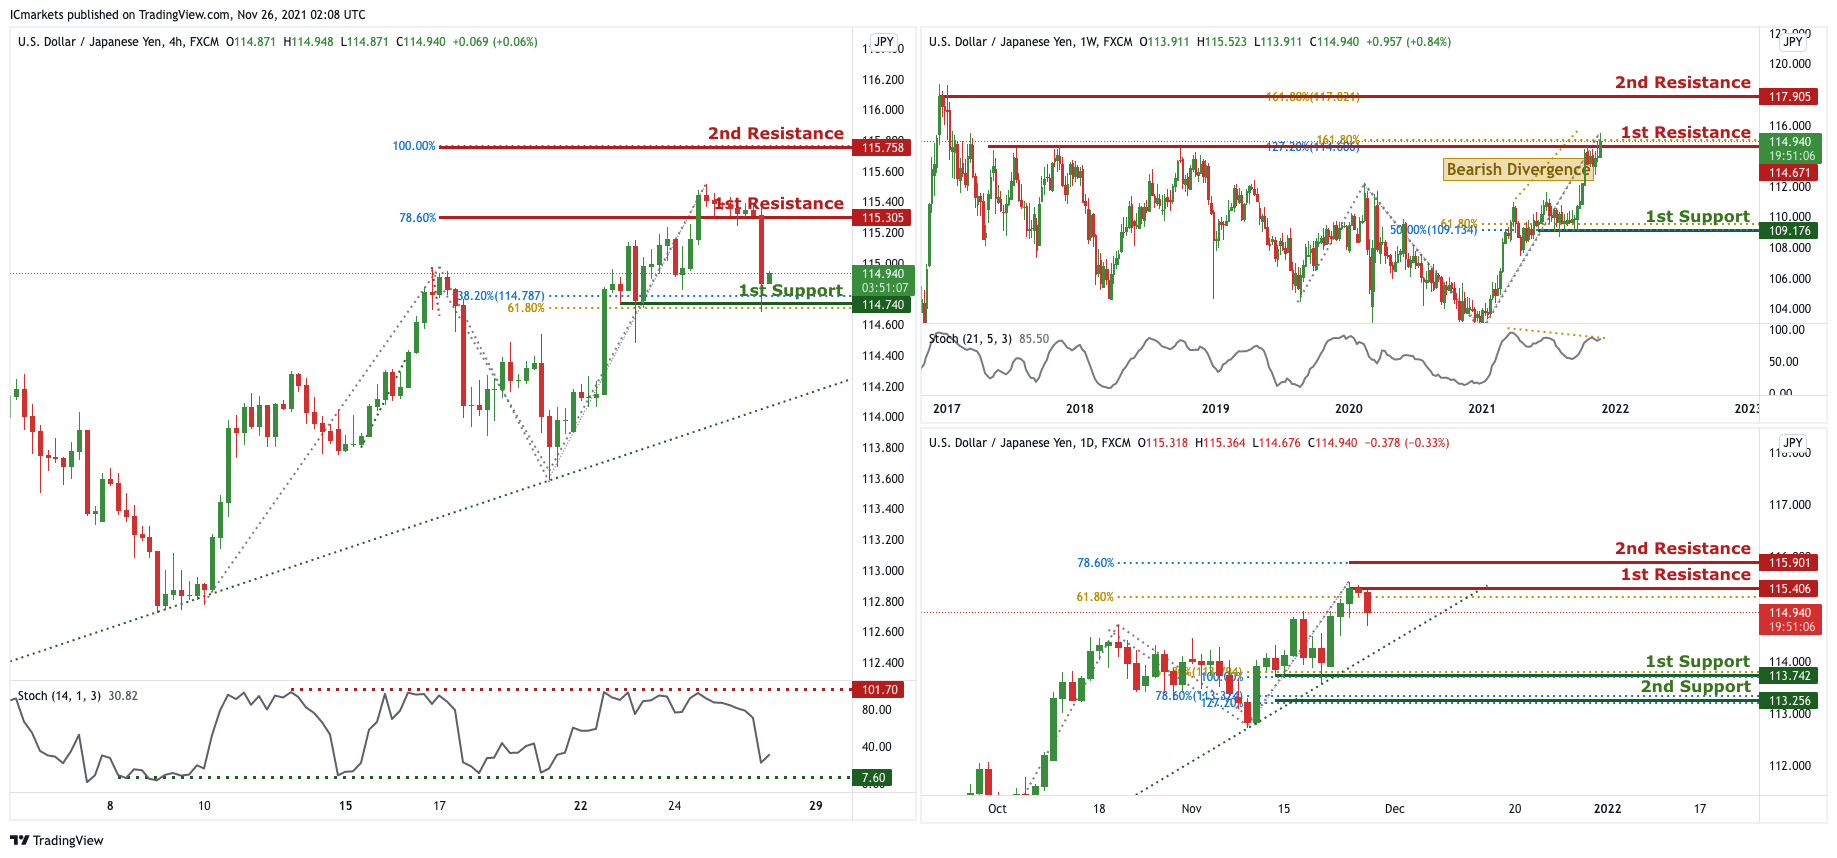
USD/JPY
On the Weekly timeframe, we can see that price is approaching the 1st resistance in line with horizontal swing highs and 127.2% FIbonacci Retracement and 161.8% Fibonacci Projection. We can expect the price to drop from the 1st Resistance towards the 1st Support in line with 61.8% Fibonacci projection and 50% Fibonacci retracement. Our short-term bearish momentum is further supported by the stochastic %K line holding below the descending trendline resistance and bearish divergence spotted. On the Daily timeframe, price has reached the 1st Resistance in line with 61.8% Fibonacci projection, would advise traders to wait for the price to swing higher or lower.
In reference to yesterday’s analysis, on the H4 timeframe,price indeed dropped to the 1st Support @114.740. We can now expect price to bounce from towards 1st Support in line with 61.8% Fibonacci projection and 38.2% Fibonacci retracement towards 1st Resistance in line with 78.6% Fibonacci projection and horizontal swing high. Our bullish bias is further supported by stochastic where the%K line is approaching the support level.
Areas of consideration:
- H4 1st resistance level 115.305
- H4 1st support level 114.740
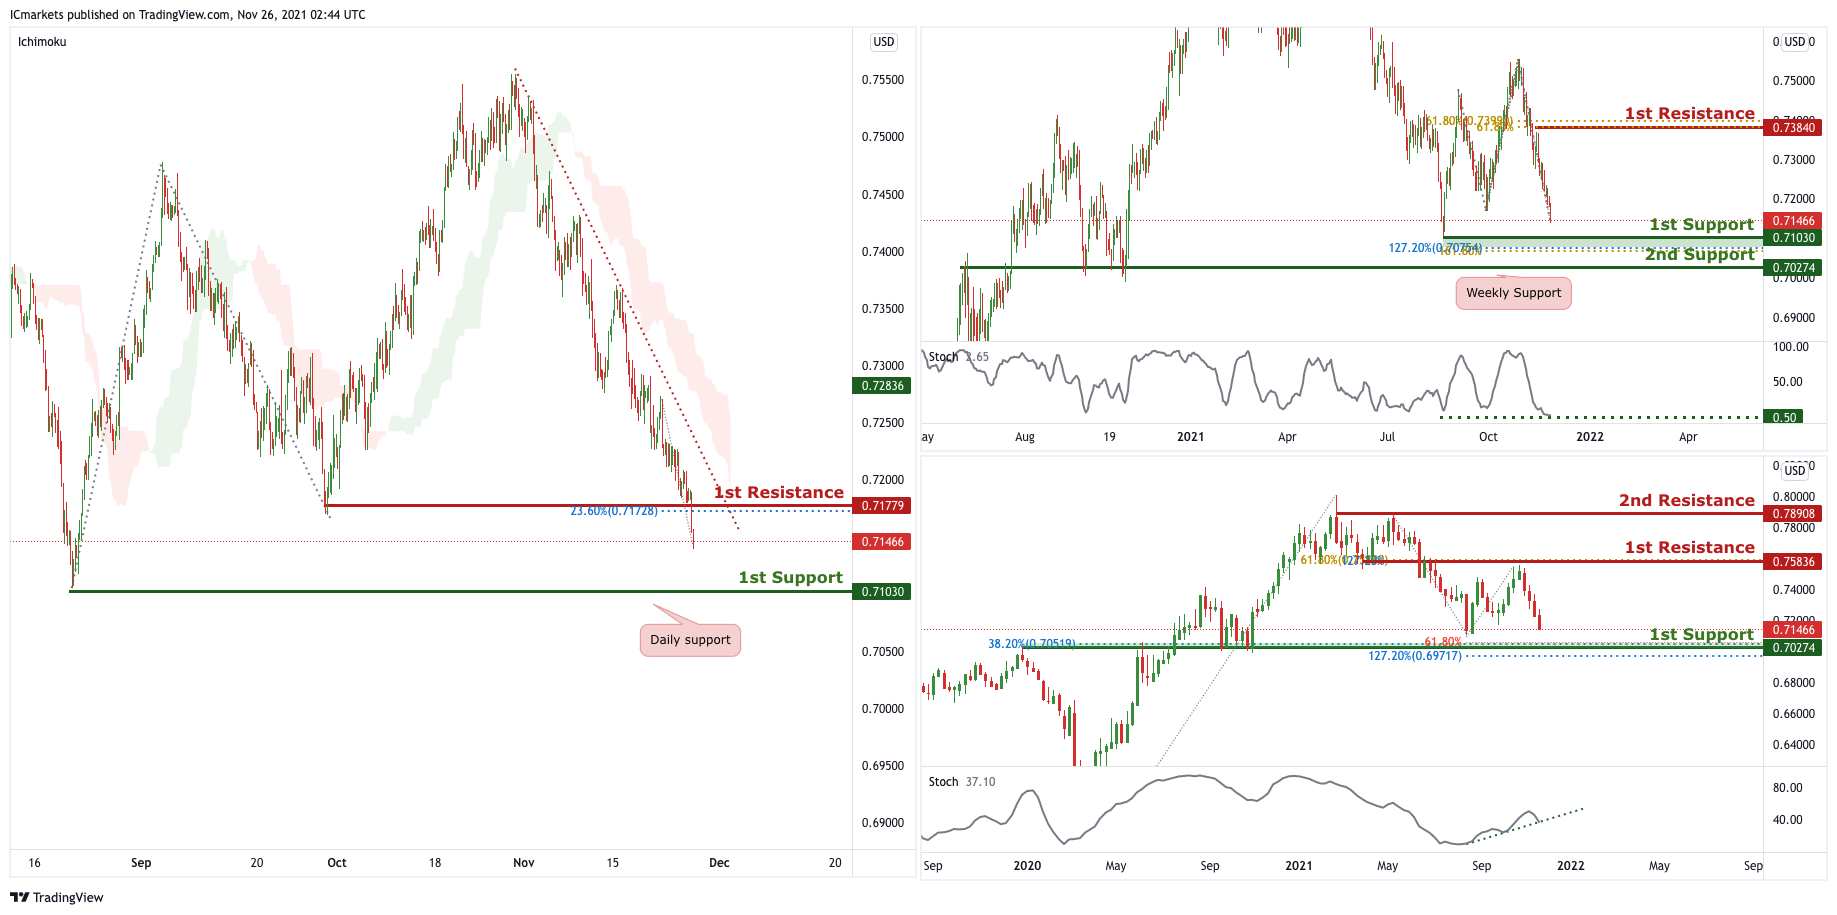
AUD/USD:
In reference to last week’s analysis, price is indeed reaching the 1st Support. On the weekly, we can now expect the price to bounce from the 1st Support in line with 61.8% Fibonacci projection, 38.2 % FIbonacci retracement and 127.2% Fibonacci extensions. Our bullish bias is further supported by the stochastic indicator abiding to an ascending trendline. On the Daily, the price is near the 1st support, we can expect price to bounce from 1st Support in line with 127.2% extension and 161.8% Fibonacci projection towards 1st Resistance in line with 61.8% FIbonacci projection and 61.8% Fibonacci retracement.
In reference to yesterday’s analysis, price indeed dropped to 1st Support level. On the H4, price is currently in the middle of the 1st Resistance and 1st Support hence we would advise traders to wait for the price to swing higher or lower before entering.
Areas of consideration:
- H4 1st resistance level 0.71779
- H4 1st support level 0.71030
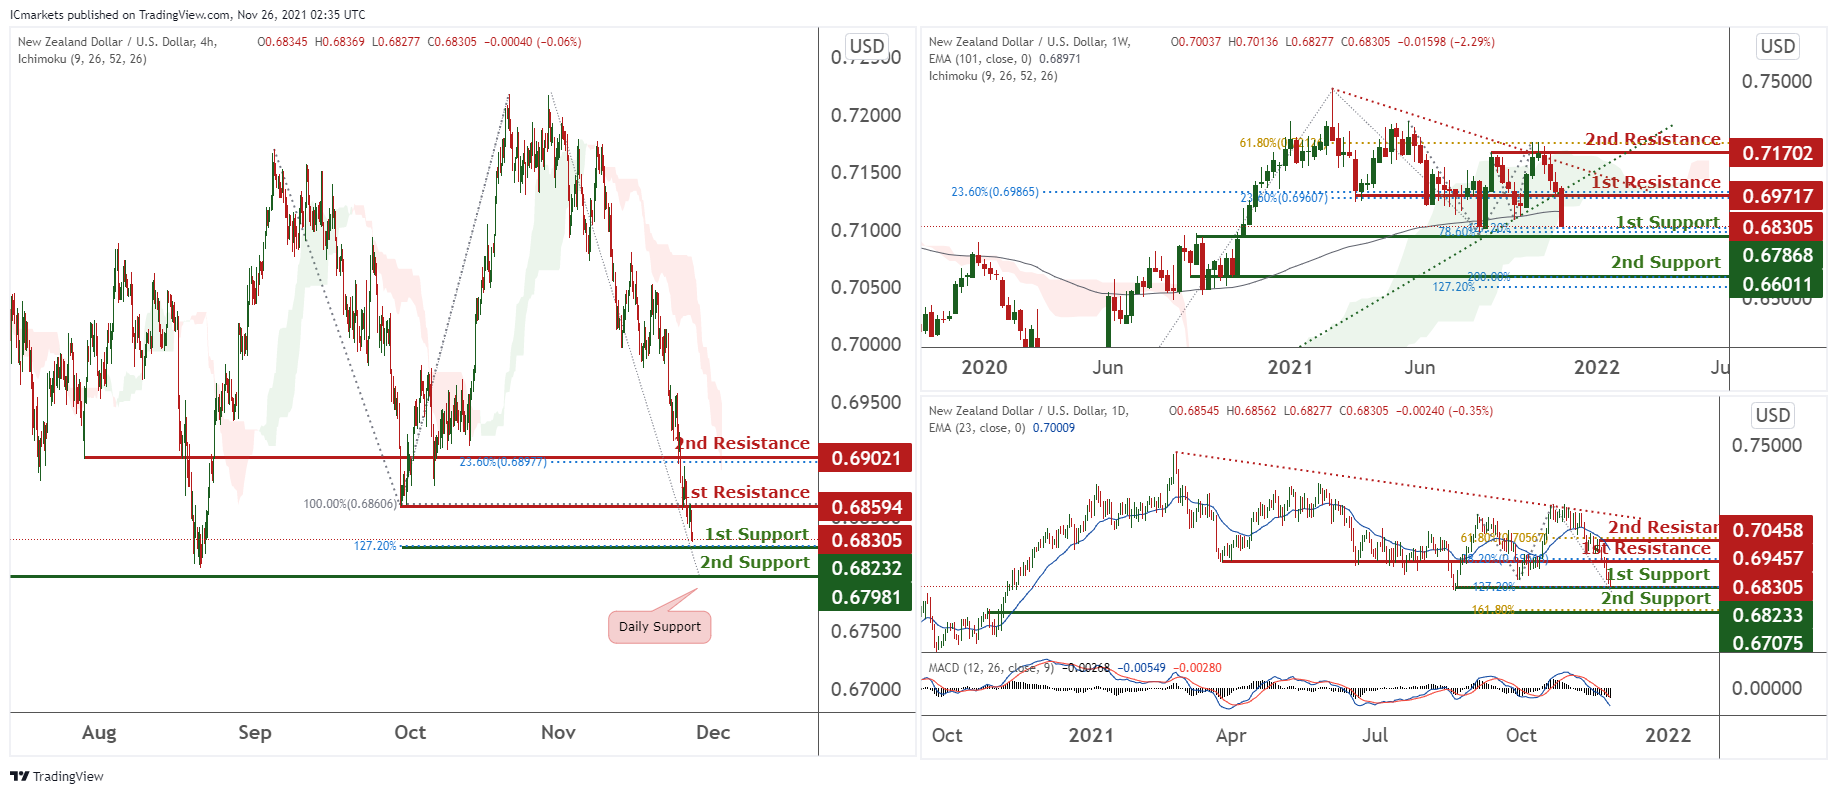
NZD/USD:
On the weekly, prices have broken out of our triangle. We see potential for a bounce at 1st support at 0.67868 which is an area of Fibonacci confluences towards our 1st resistance at 0.69717 in line with 23.6% Fibonacci retracement. Technical indicators are showing bullish momentum. Alternatively, if prices break our 1st support, we might find it dipping towards our 2nd support at 0.66011 in line with 127.2% and 200% Fibonacci projection.
On the daily, prices are abiding to a bearish trendline. We see potential for a bounce from our 1st support at 0.68233 towards our 1st resistance at 0.69457 in line with 38.6% Fibonacci retracement. As technical indicators are showing bullish momentum.
On the H4 timeframe, prices are on a bearish momentum. We see a small reaction from our 1st support at 0.68232 towards our 1st resistance at 0.68594 in line with 100% Fibonacci retracement. If prices break our 1st support, prices can potentially dip further towards our 2nd support at 0.67981 which is a daily support
Areas of consideration:
- H4 time frame, 1st resistance at 0.68594
- H4 time frame, 1st support at 0.68232
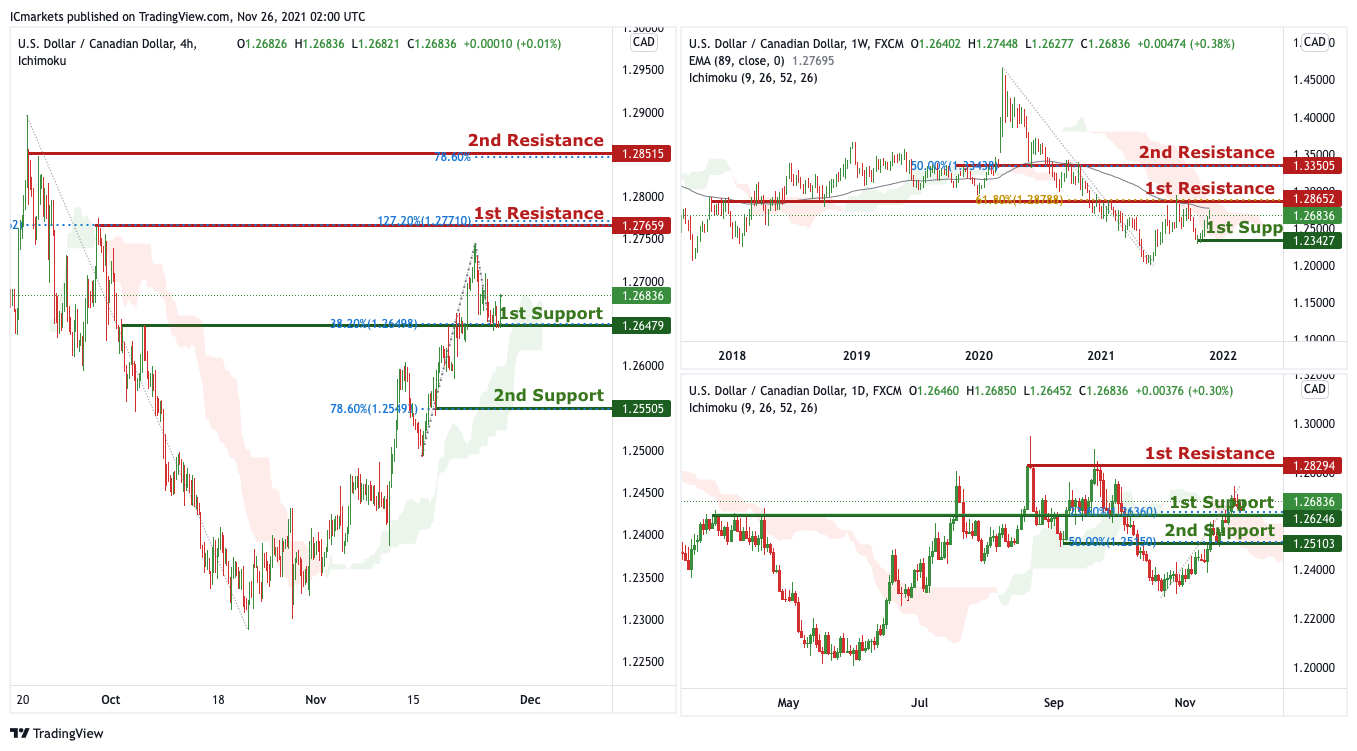
USD/CAD:
On the Weekly timeframe, price tested and reacted below long term moving average and also both 61.8% Fibonacci retracement level at 1.28652. As long as the price is holding below this level, we could potentially see the price facing further bearish pressure in the long term or at least to 1st support at 1.23427 in line with our horizontal swing low support.
On the Daily, price has been testing our 1st support at 1.26246 in line with 23.6% Fibonacci retracement and graphical overlap support. With price moving above our ichimoku indicator, we have a bullish bias that price may rise from 1st support to 1st resistance at 1.28294 in line with our graphical swing high resistance. Alternatively, price may break 1st support structure and head for 2nd support at 1.25103 in line with the 50% Fibonacci retracement.
On the H4, with price moving above the ichimoku cloud, we have a bullish bias that price will rise from 1st support at 1.26479 in line with the graphical overlap support and 38.2% Fibonacci retracement and possibly to 2nd support at 1.25505 in line with the graphical swing low support and 78.6% Fibonacci retracement to 1st resistance at 1.27659 in line with the horizontal swing high resistance and 78.6% Fibonacci retracement level. Alternatively, we may see price break 1st resistance structure and head for 2nd resistance at 1.28515 in line with the horizontal swing high resistance.
Areas of consideration:
- H4 time frame, support at 26479
- H4 time frame, resistance at 1.27659
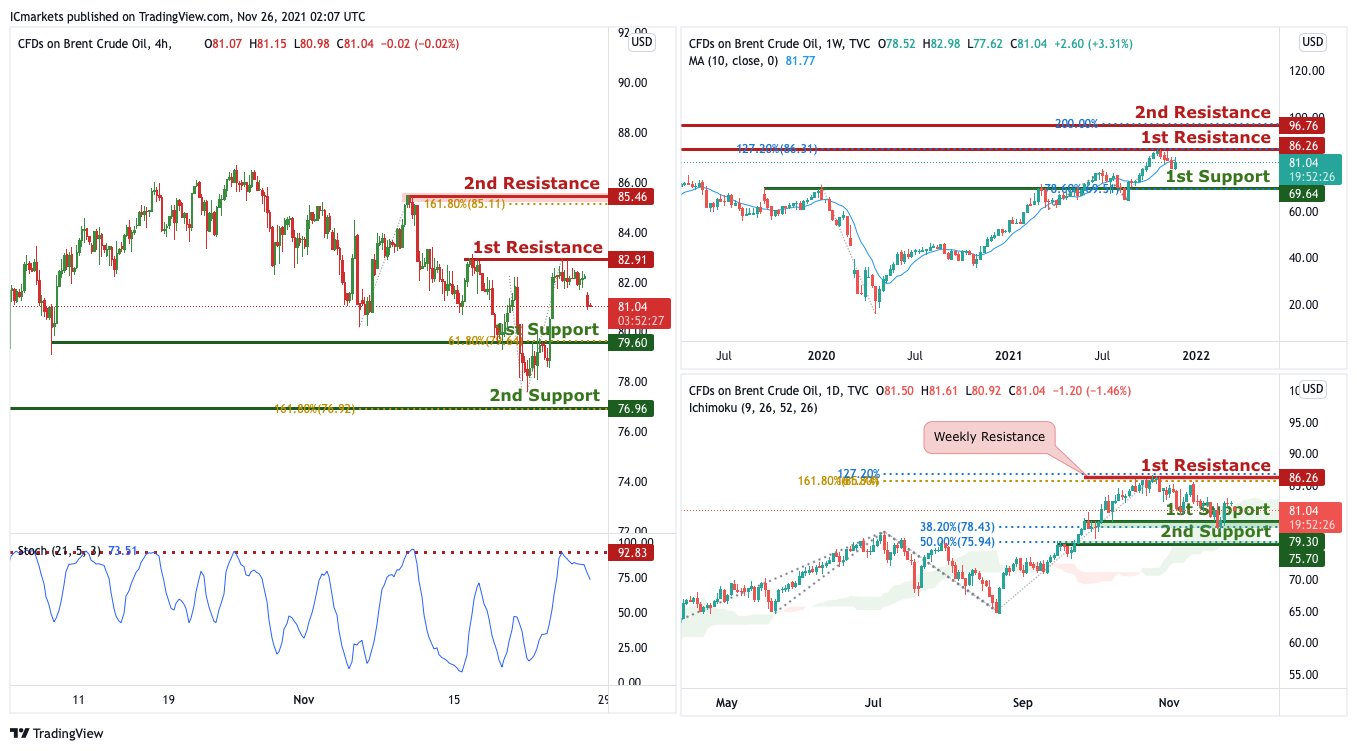
OIL:
On Weekly timeframe, we are likely to see price drop from the 1st resistance at 86.26 in line with the 127.2% Fibonacci retracement to 1st support at 69.64. Otherwise, price may break 1st resistance and make a new high at 2nd resistance at 96.76. Our bearish bias can be supported by how price is beow the moving average.
On the Daily timeframe, as price is holding above the ichimoku indicator, we are likely to see price move further up to the 1st resistance at 86.26 in line with the 127.2% and 161.8% Fibonacci extension from 1st support at 80.99 in line with the 38.2% Fibonacci retrace,ent. Otherwise it may head to 2nd support at 79.30 in line with the 50% Fibonacci retracement.
On the H4 timeframe, with price rejecting the resistance on the stochastics indicator and the horizontal graphical level, we have a bias that price will drop to 1st support at 79.6 in line with the 61.8% Fibonacci retracement and horizontal overlap support and possible to 2nd support at 76.96 in line with the 161.8% Fibonacci extension and horizontal swing low support from 1st resistance at 82.91 in line with the horizontal swing high resistance. Alternatively, price may break 1st resistance structure and head for 2nd resistance at 85.46 in line with the 161.8% Fibonacci extension and horizontal swing high resistance.
Areas of consideration:
- H4 time frame, 1st resistance of 82.91
- H4 time frame, 1st support of 6
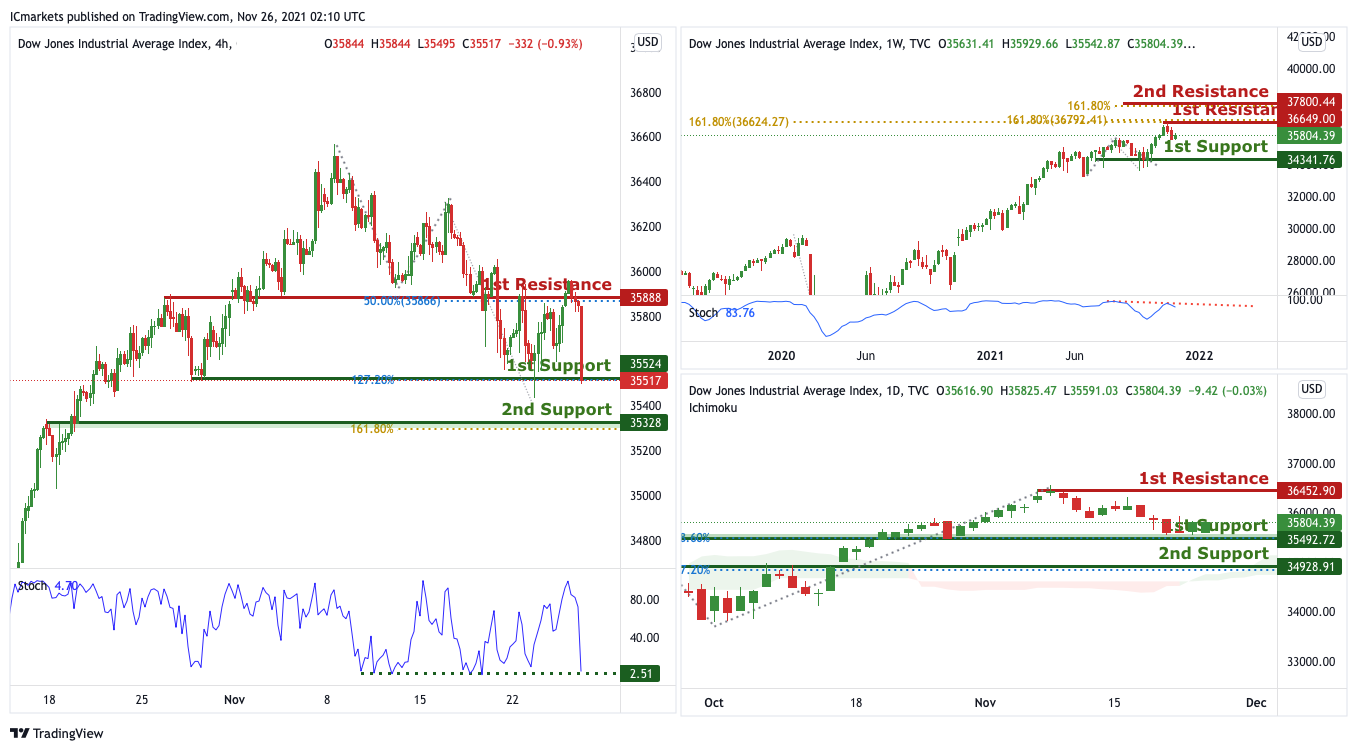
Dow Jones Industrial Average:
On the Weekly, price has been trading between our 1st support at 34341 in line with the horizontal swing low and 1st resistance at 36649 in line with a 161.8% Fibonacci extension and 161.8% Fibonacci projection. With pierce expected to reject the resistance on the stochastics indicator, we are bias that price will head for 1st support from here. Alternatively, price may break 1st resistance and head for 2nd resistance at 37800 in line with the 161.8% Fibonacci extension.
On the Daily chart, with price moving above the ichimoku cloud, we are expecting to see price rise from 1st support at 35492 in line with the 78.6% Fibonacci retracement and horizontal overlap support to 1st resistance at 36452 in line with our horizontal swing high resistance. Alternatively, price may break 1st support and head for 2nd support at 34928 in line with the 127.2% Fibonacci extension.
On the H4, with price approaching the support of the stochastics indicator, we are bias that price will bounce up to 1st resistance at 35888 in line with the 50% Fibonacci retracement and horizontal overlap resistance from 1st support at 35524 in line with the horizontal swing low support and 127.2% Fibonacci projection. Alternatively, price may break 1st support structure and head for 2nd support at 35328 in line with the 161.8% Fibonacci projection.
- 4H resistance at 35888
- 4H support at 35524
The accuracy, completeness and timeliness of the information contained on this site cannot be guaranteed. IC Markets does not warranty, guarantee or make any representations, or assume any liability regarding financial results based on the use of the information in the site.
News, views, opinions, recommendations and other information obtained from sources outside of www.icmarkets.com.au, used in this site are believed to be reliable, but we cannot guarantee their accuracy or completeness. All such information is subject to change at any time without notice. IC Markets assumes no responsibility for the content of any linked site.
The fact that such links may exist does not indicate approval or endorsement of any material contained on any linked site. IC Markets is not liable for any harm caused by the transmission, through accessing the services or information on this site, of a computer virus, or other computer code or programming device that might be used to access, delete, damage, disable, disrupt or otherwise impede in any manner, the operation of the site or of any user’s software, hardware, data or property.