
Key risk events today:
US Core PCE Price Index m/m; US Personal Spending m/m; US Revised UoM Consumer Sentiment.
(Previous analysis as well as outside sources – italics).
EUR/USD:
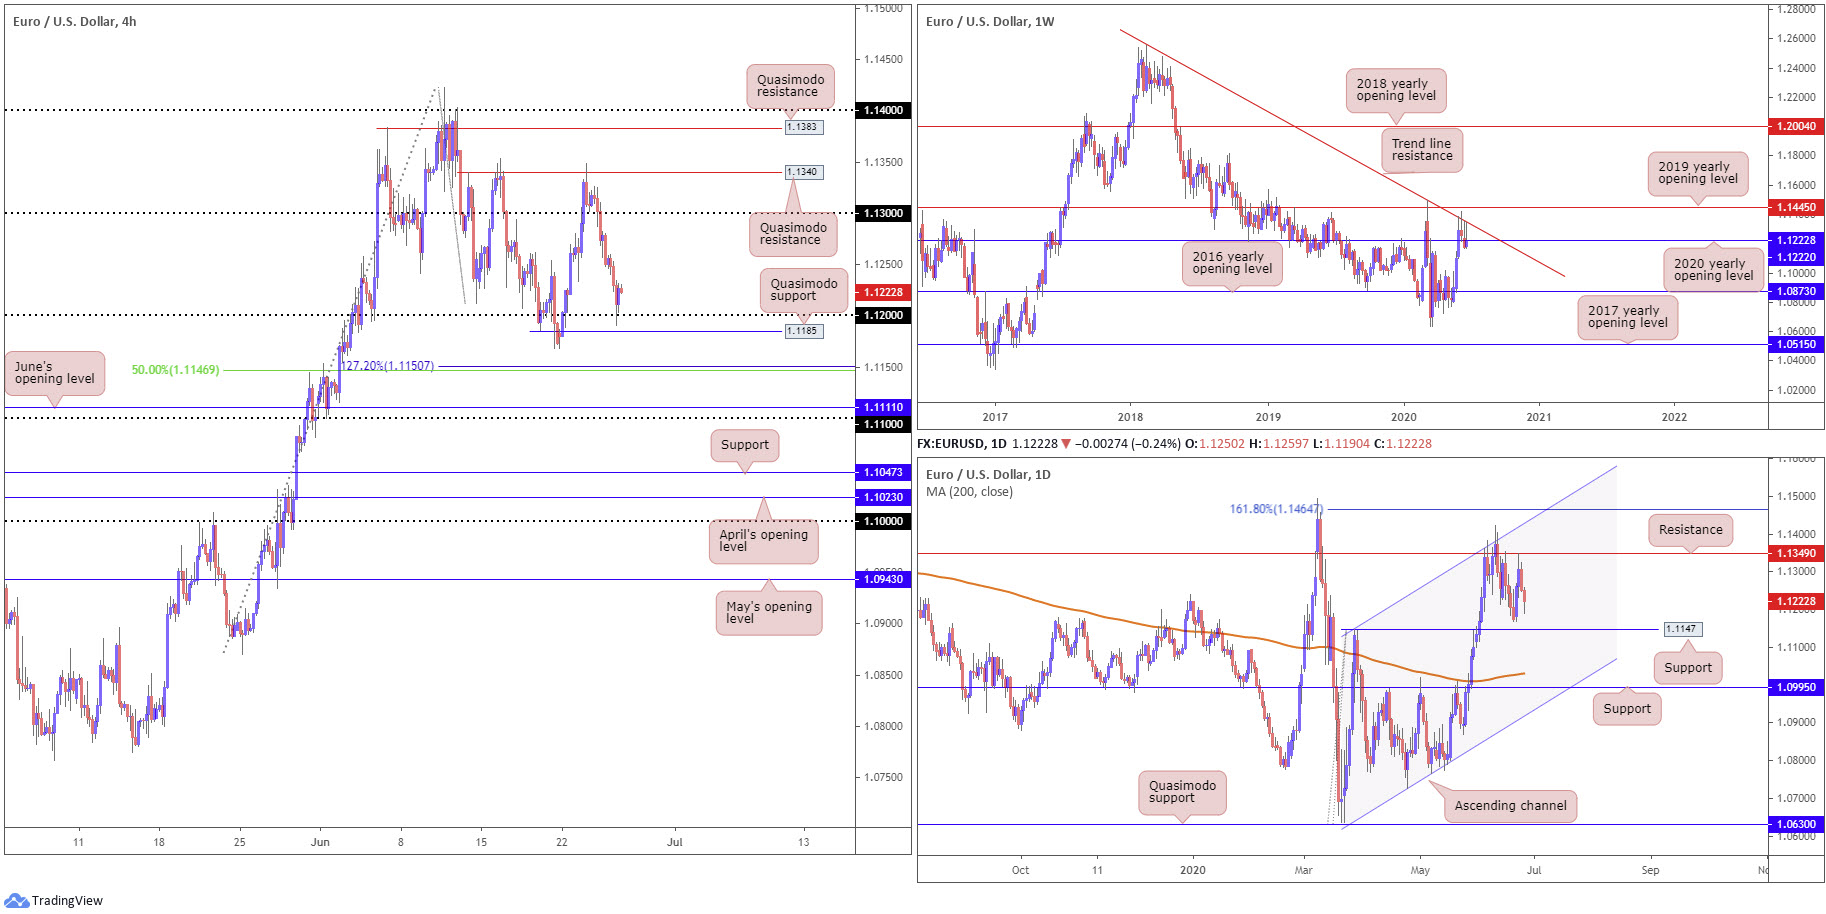
Fed by an additional wave of dollar bids – DXY crossed 97.50 – EUR/USD fell for a second consecutive session Thursday and shook hands with the 1.12 figure on the H4 timeframe. Despite modestly surpassing 1.12, dipping into sell stops, a mild rebound shaped in US hours, leaving H4 Quasimodo support at 1.1185 unopposed.
On the data front, US unemployment claims reported a higher-than-expected print at 1.48 million while US durable goods rebounded, surpassing expectations. Ultimately, though, data did little to sway the buck’s movement.
Price movement, based on the weekly timeframe, is currently on track to finish the week in the shape of a shooting star pattern, similar to the prior week’s close. Structurally, we’re trading off long-standing trend line resistance, taken from the high 1.2555, though at the same time face opposition at the 2020 yearly opening level at 1.1222 as support. Any sustained move under the aforementioned level places the 2016 yearly opening level at 1.0873 on the hit list.
Meanwhile, the story on the daily timeframe shows buyers and sellers still going toe to toe south of resistance at 1.1349. Support could soon find its way into view, derived from the 1.1147 27th March high, with a break exposing the 200-day SMA (orange – 1.1030).
Areas of consideration:
For those who read Thursday’s technical briefing you may recall the following (italics):
In the event we do eventually seize 1.12, watch for a fakeout scenario through the aforementioned round number to materialise into H4 Quasimodo support at 1.1185. A H4 close back above 1.12 would likely be a welcomed sight for buyers.
Although we did surpass 1.12, Quasimodo support was left unchallenged. Consequently, another fakeout through the round number could be in store today, one that fills bids off 1.1185.
A drop lower on the H4, however, could see the 127.2% Fibonacci extension level at 1.1150 make an appearance, along with the 50.00% retracement ratio at 1.1146. Interestingly, this base also benefits from daily support at 1.1147, therefore intraday bullish scenarios from this region are a possibility.
GBP/USD:
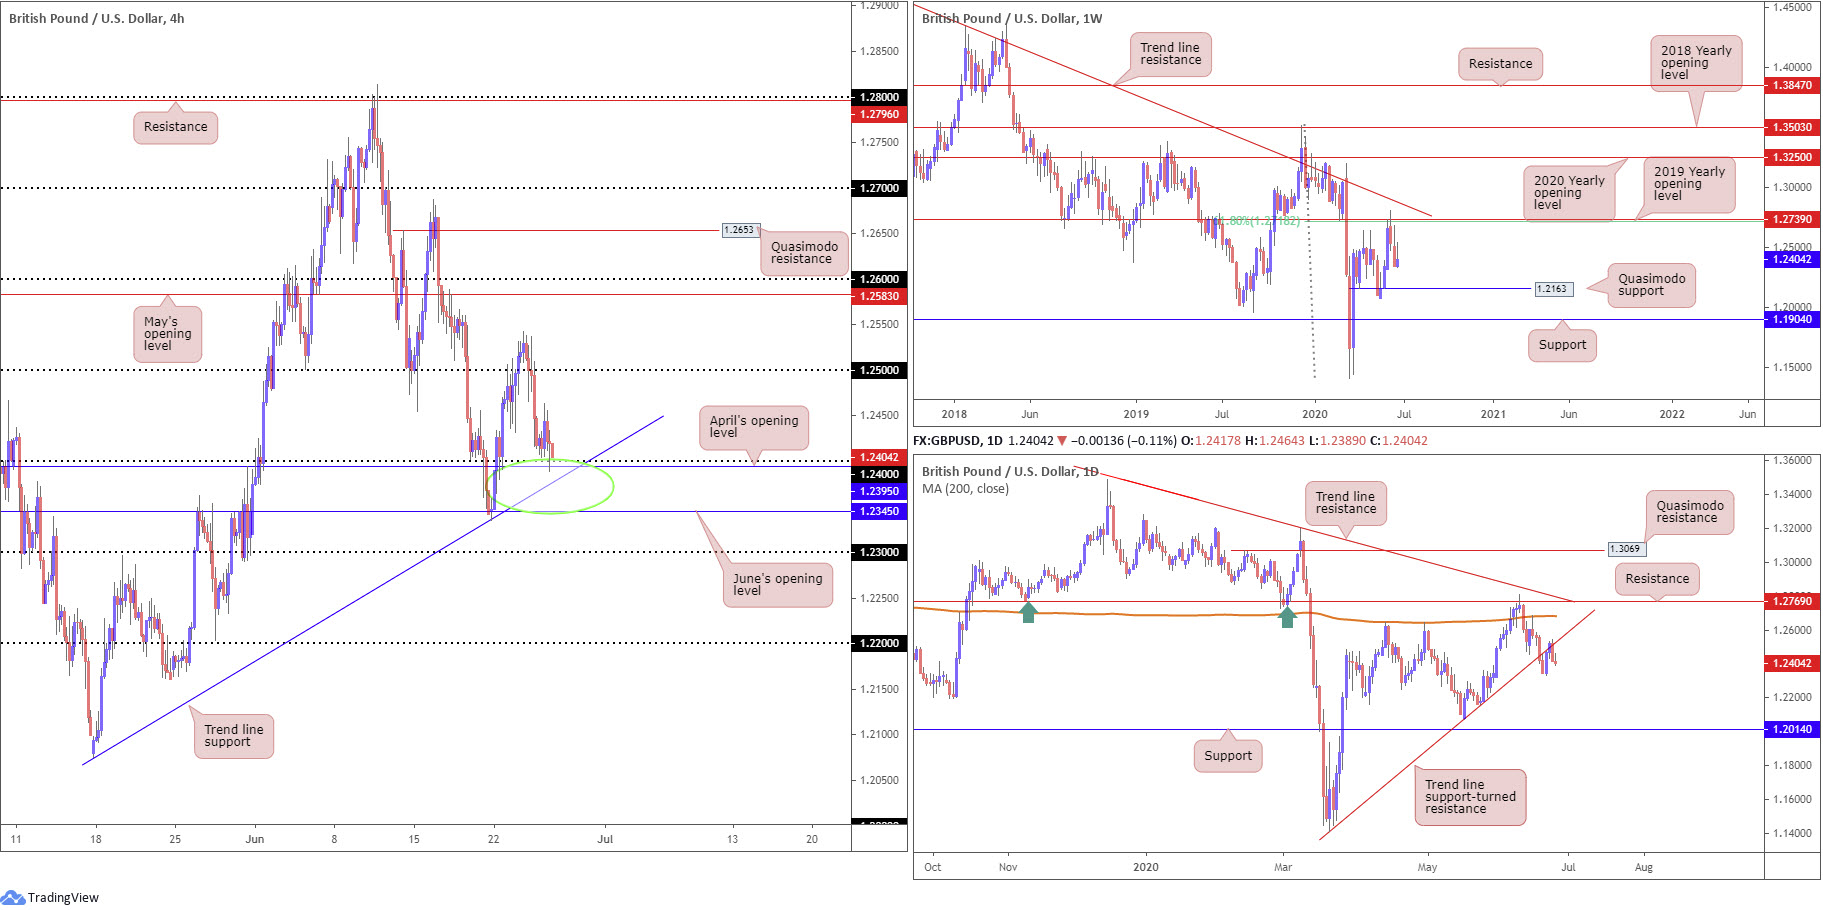
GBP/USD demonstrated reasonably firm resilience Thursday, holding 1.24 and April’s opening level at 1.2395 on the H4 in spite of the US dollar index marching higher for a second consecutive session. H4 traders will also recognise nearby trend line support, extended from the low 1.2075, and June’s opening level at 1.2345.
The daily timeframe, meanwhile, has price action stationed just south of trend line support-turned resistance, taken from the low 1.1409. Navigating deeper waters from here invites an approach to weekly Quasimodo support at 1.2163. Structure to the upside on the weekly timeframe can also be found in the form of a 61.8% Fibonacci retracement ratio at 1.2718 and 2019 yearly opening level at 1.2739.
Areas of consideration:
Due to the lack of movement Thursday, the technical outlook remains unchanged.
Reasonably considerable support resides between June’s opening level at 1.2345 and the 1.24 handle on the H4 timeframe (green circle). Despite this, higher-timeframe flow appears to be looking beyond this zone towards weekly Quasimodo support at 1.2163.
Although bullish scenarios may form between 1.2345/1.24, particularly off intersecting H4 trendline support, prudent traders will also accept the possibility of bearish themes emerging sub 1.2345, in line with higher-timeframe direction.
AUD/USD:
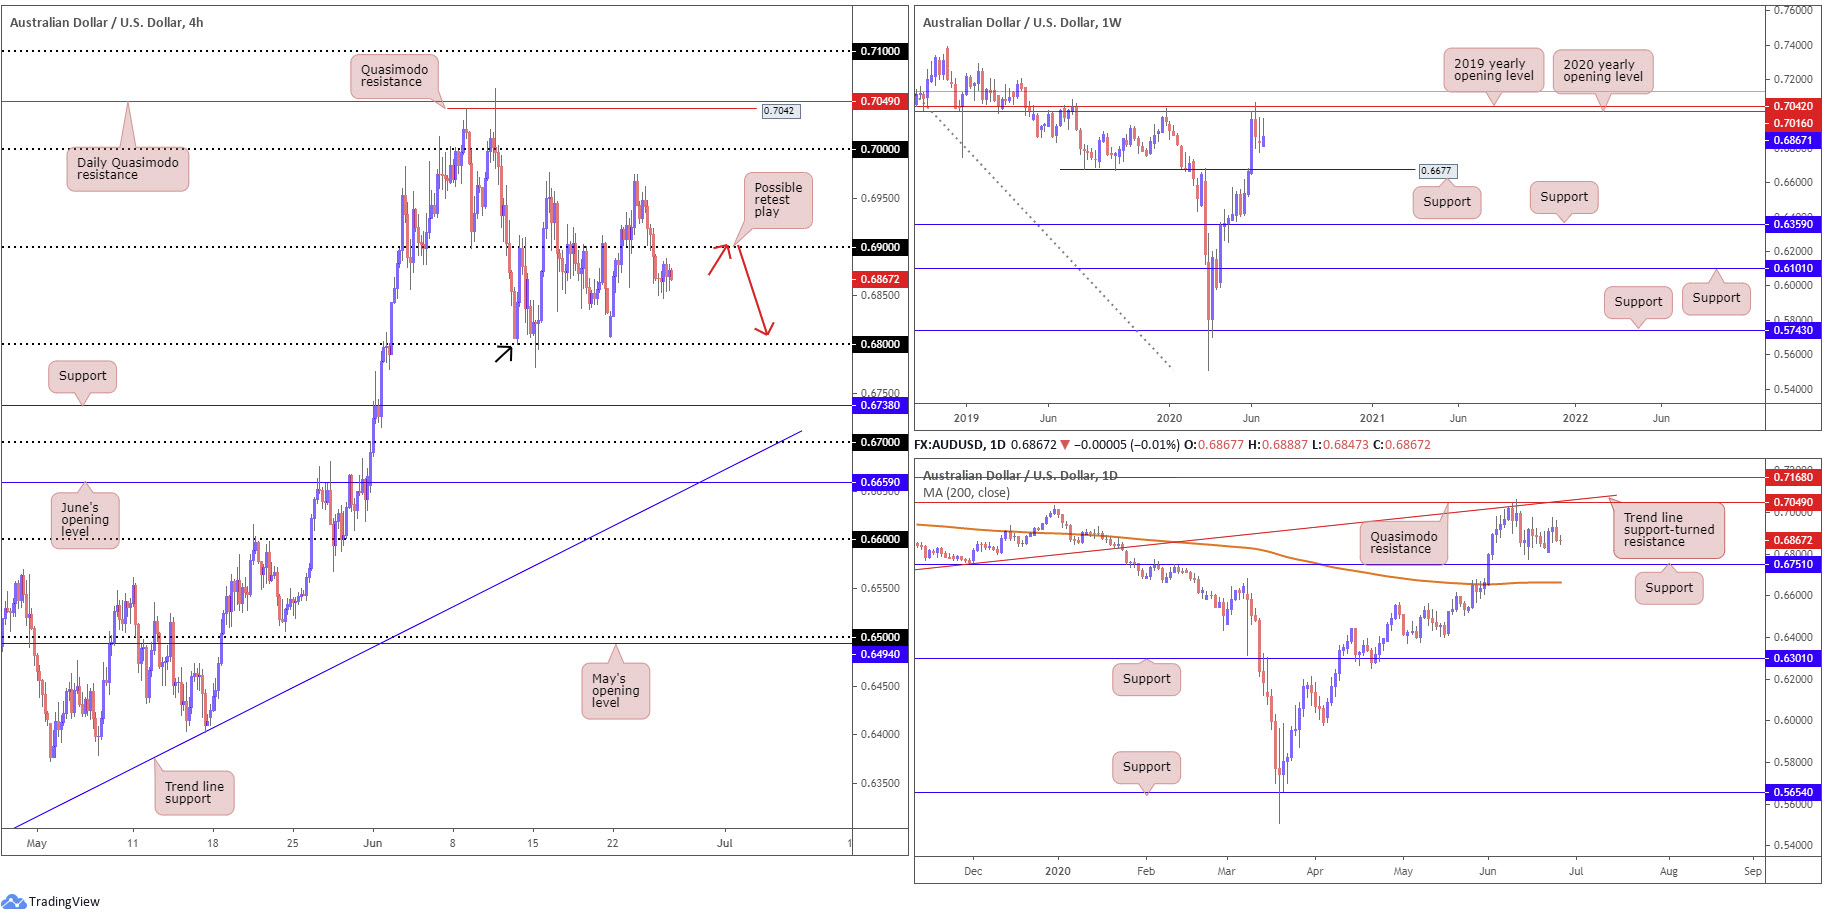
AUD/USD, as evident from the charts, struggled to establish direction Thursday, oscillating in a tight range between 0.6888/0.6847. As a result of the recent lacklustre performance, much of the following analysis will echo thoughts put forward in Thursday’s report.
With Wednesday leaving behind 0.69, the road south on the H4 timeframe appears clear until reaching the 0.68 juncture. Technically speaking, this figure also throws in a Quasimodo support (black arrow denotes the left shoulder).
Resistance, forged in the shape of a 2020 yearly opening level and a 2019 yearly opening level, at 0.7016 and 0.7042, respectively, continues to offer a dominant presence on the weekly timeframe. It might also interest traders to note that just above the said resistances we have a 61.8% Fibonacci retracement ratio stationed at 0.7128 (green). In terms of support, crosshairs are perhaps fixed on 0.6677.
From the daily timeframe, Quasimodo resistance at 0.7049 is in sight, merging closely with trend line support-turned resistance, taken from the low 0.6670. Attention on this timeframe also remains at support coming in from 0.6751. Interestingly, lurking beneath here we also have the 200-day SMA (orange – 0.6664), sited close by the weekly support at 0.6677.
Areas of consideration:
According to technical research, sellers have the upper hand heading into Friday’s session.
A retest at the underside of 0.69 (red arrows), one that preferably holds by way of a H1/H4 bearish candlestick pattern, would, therefore, likely appeal to sellers, targeting the 0.68 neighbourhood as an initial take-profit zone.
Aggressive traders, on the other hand, will already likely be short the break of 0.69, also targeting 0.68 as an initial base.
USD/JPY:
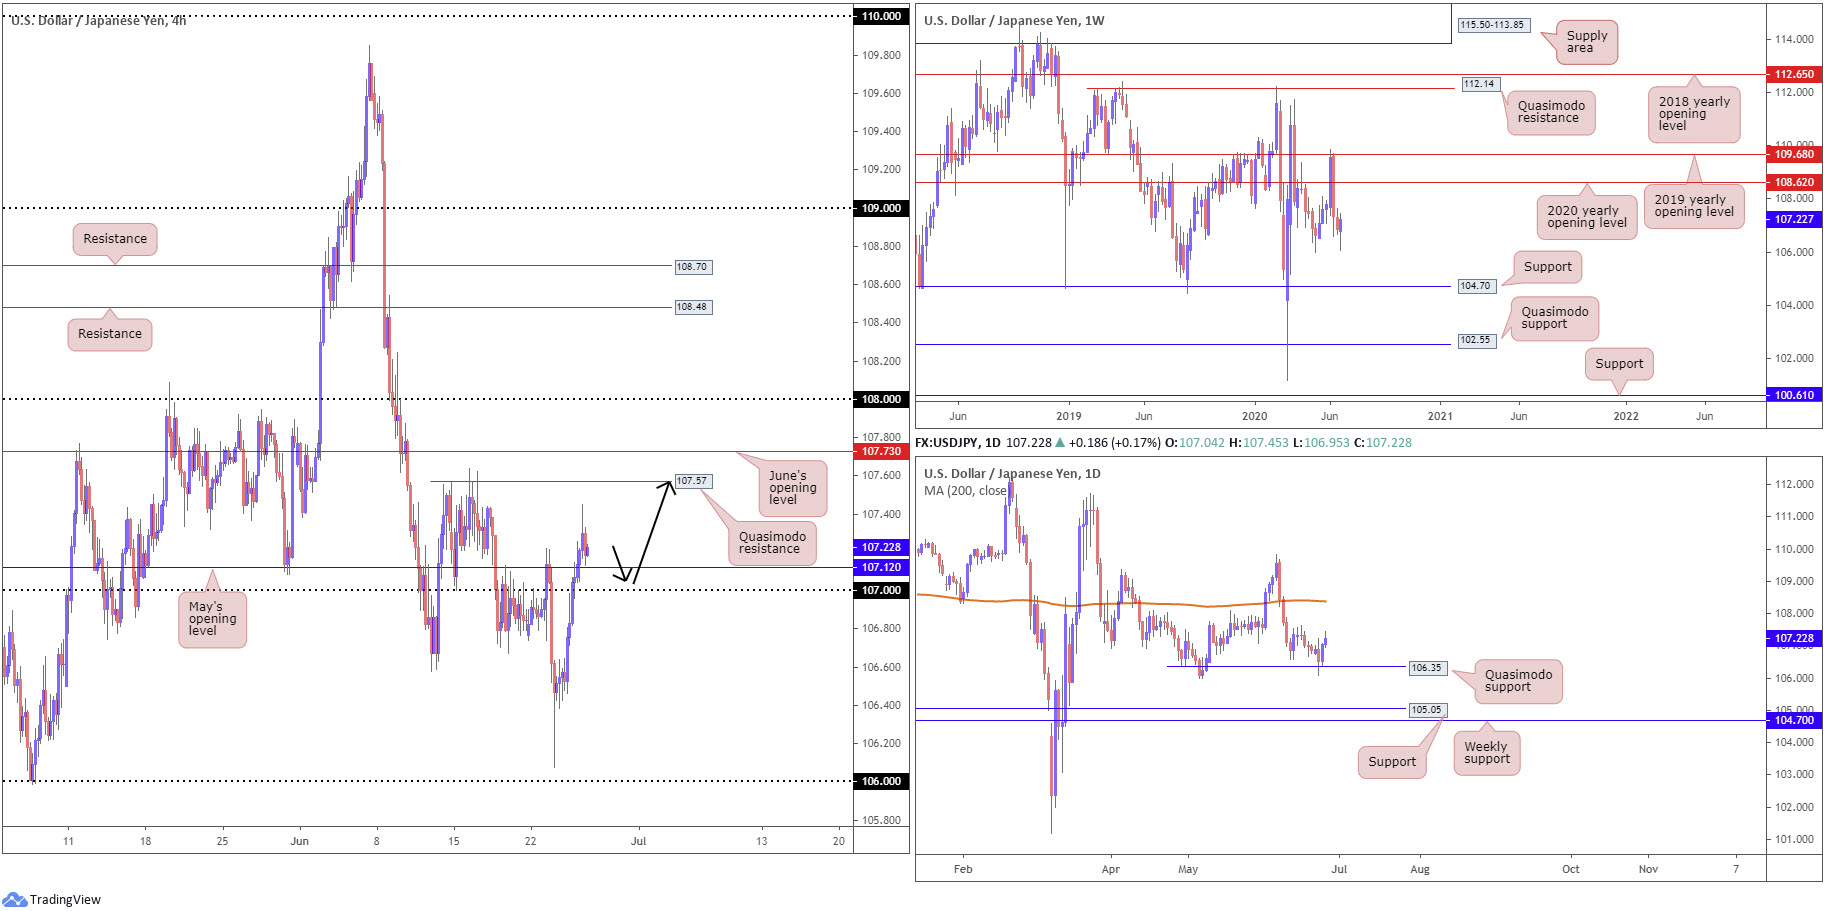
Fuelled largely on the back of a broad dollar bid – DXY crossed above 97.50 – the US dollar remained on the winning side of the table against the Japanese yen Thursday, unaffected by recent US data and risk-off mood.
The push reclaimed 107+ status and also regained a foothold above May’s opening level at 107.12 on the H4 timeframe. Price elbowed to highs at 107.45 before retreating to settle just ahead of 107.12. A rebound from this neighbourhood today shines the spotlight on Quasimodo resistance at 107.57, with a break pointing to June’s opening level coming in at 107.73.
Daily Quasimodo support at 106.35 recently nudged its way into the limelight, bolstering recent upside. Although Thursday’s momentum diminished somewhat, the possibility of further buying remains, with crosshairs fixed on the 200-day SMA (orange – 108.38) as an upside objective.
From the weekly timeframe, after rejecting the 2019 yearly opening level at 109.68 and voyaging through the 2020 yearly opening level at 108.62, current action appears to be finding a grip ahead of the 105.98 6th May low (represents the low to the daily Quasimodo formation).
Areas of consideration:
In light of recent bidding, the pair looks to be on course to appreciate further today.
A retest at 107.12/107 may come to fruition on the H4, setting up a case for a run to Quasimodo support on the H4 at 107.57, closely followed by June’s opening level at 107.73 (black arrows). Conservative traders may seek additional confirmation before engaging with the area, owing to the threat of a possible fakeout through 107 – common around psychological numbers.
USD/CAD:
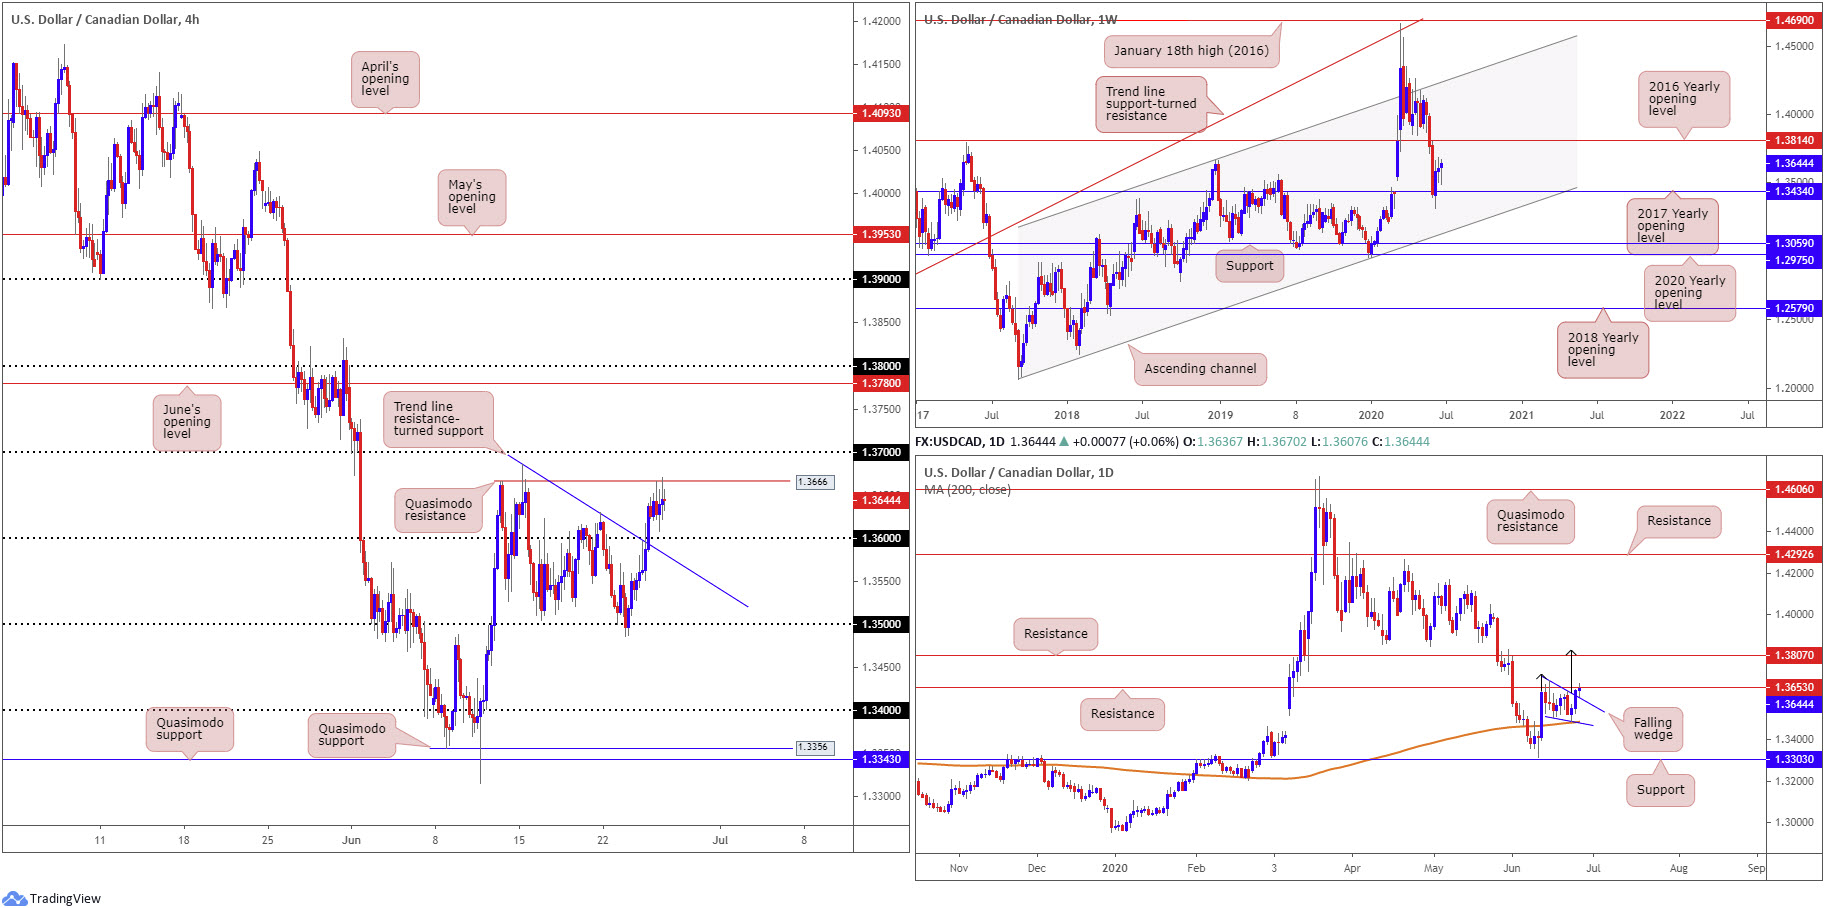
USD/CAD prices are little changed as we head into Asia Friday, as H4 candles cross swords with Quasimodo resistance at 1.3666. 1.37 rests as the next available resistance above here, whereas a dip from current levels could have price cross into 1.36, and with some oomph, trend line resistance-turned support, extended from the high 1.3685.
After ending Wednesday marginally outside the upper limit of a falling wedge (1.3686/1.3504) on the daily timeframe, neighbouring resistance at 1.3653 welcomed price action Thursday and chalked up an indecision candle. Take-profit targets out of falling wedges can be measured by taking the base and adding this value to the breakout point (black arrows), which as you can see in this case, converges closely with the next daily resistance at 1.3807.
The story on the weekly timeframe shows price action remains above the 2017 yearly opening level at 1.3434, echoing the possibility of an approach to the 2016 yearly opening level at 1.3814.
Areas of consideration:
For those who read Thursday’s technical briefing you may recall the following (italics):
A H4 close above 1.36 may appeal to intraday buyers, favouring a run to daily resistance at 1.3653, followed by Quasimodo resistance at 1.3666.
Well done to any traders who managed to catch the run above 1.36.
Going forward, despite weekly price suggesting a climb to higher terrain, longs are hindered right now, given daily resistance at 1.3653, H4 Quasimodo resistance at 1.3666 and 1.37 on the H4.
As highlighted in Thursday’s technical briefing, a breach of 1.37 to the upside could lay the foundation for an extension to the 1.38 handle, which comes together with daily resistance at 1.3807 and weekly resistance at 1.3814.
USD/CHF:
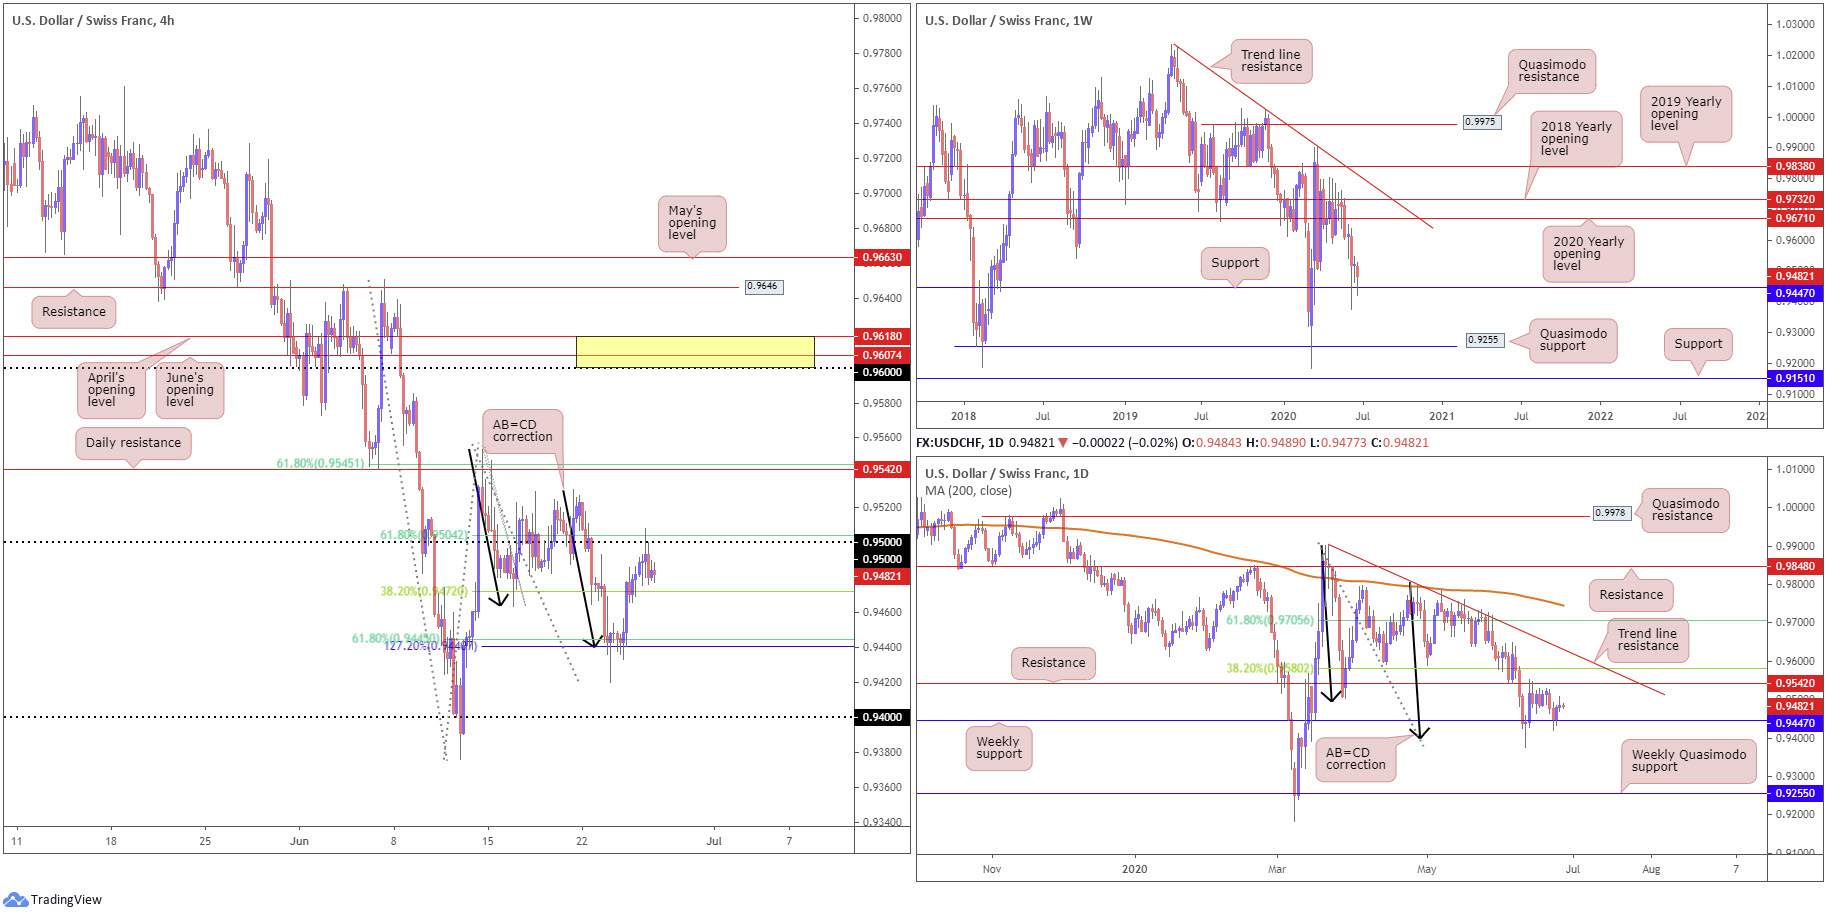
As evident from the H4 timeframe this morning, the AB=CD formation (black arrows) at 0.9440 and weekly support at 0.9447 combination proved strong, sending H4 candles to the 38.2% Fibonacci retracement ratio at 0.9472 on Wednesday and the 61.8% Fibonacci retracement ratio at 0.9504 yesterday, both considered traditional targets out of AB=CD patterns.
Despite the dip from 0.95ish on the H4 timeframe, higher timeframes – price bouncing off weekly support at 0.9447 – imply additional gains could be on the cards. Daily resistance at 0.9542 is set as the next logical upside target, with a break likely connecting with a 38.2% Fibonacci retracement ratio at 0.9580. This would also be considered, by some traders, to be an initial upside target out of the daily AB=CD correction (black arrows) off 0.9390.
Areas of consideration:
With higher timeframes forecasting the possibility of additional upside, a break of 0.95 may be seen. This will attract breakout buying to daily resistance at 0.9542, though most will ultimately be targeting the 38.2% Fibonacci retracement ratio at 0.9580 on the daily timeframe.
Dow Jones Industrial Average:
US equities concluded higher across the board Thursday as investors looked past worsening coronavirus outbreaks in the world’s biggest economy. The Dow Jones Industrial Average rose 299.66 points, or 1.18%; the S&P 500 added 33.43 points, or 1.10%, and the tech-heavy Nasdaq 100 concluded higher by 99.14 points, or 0.99%.
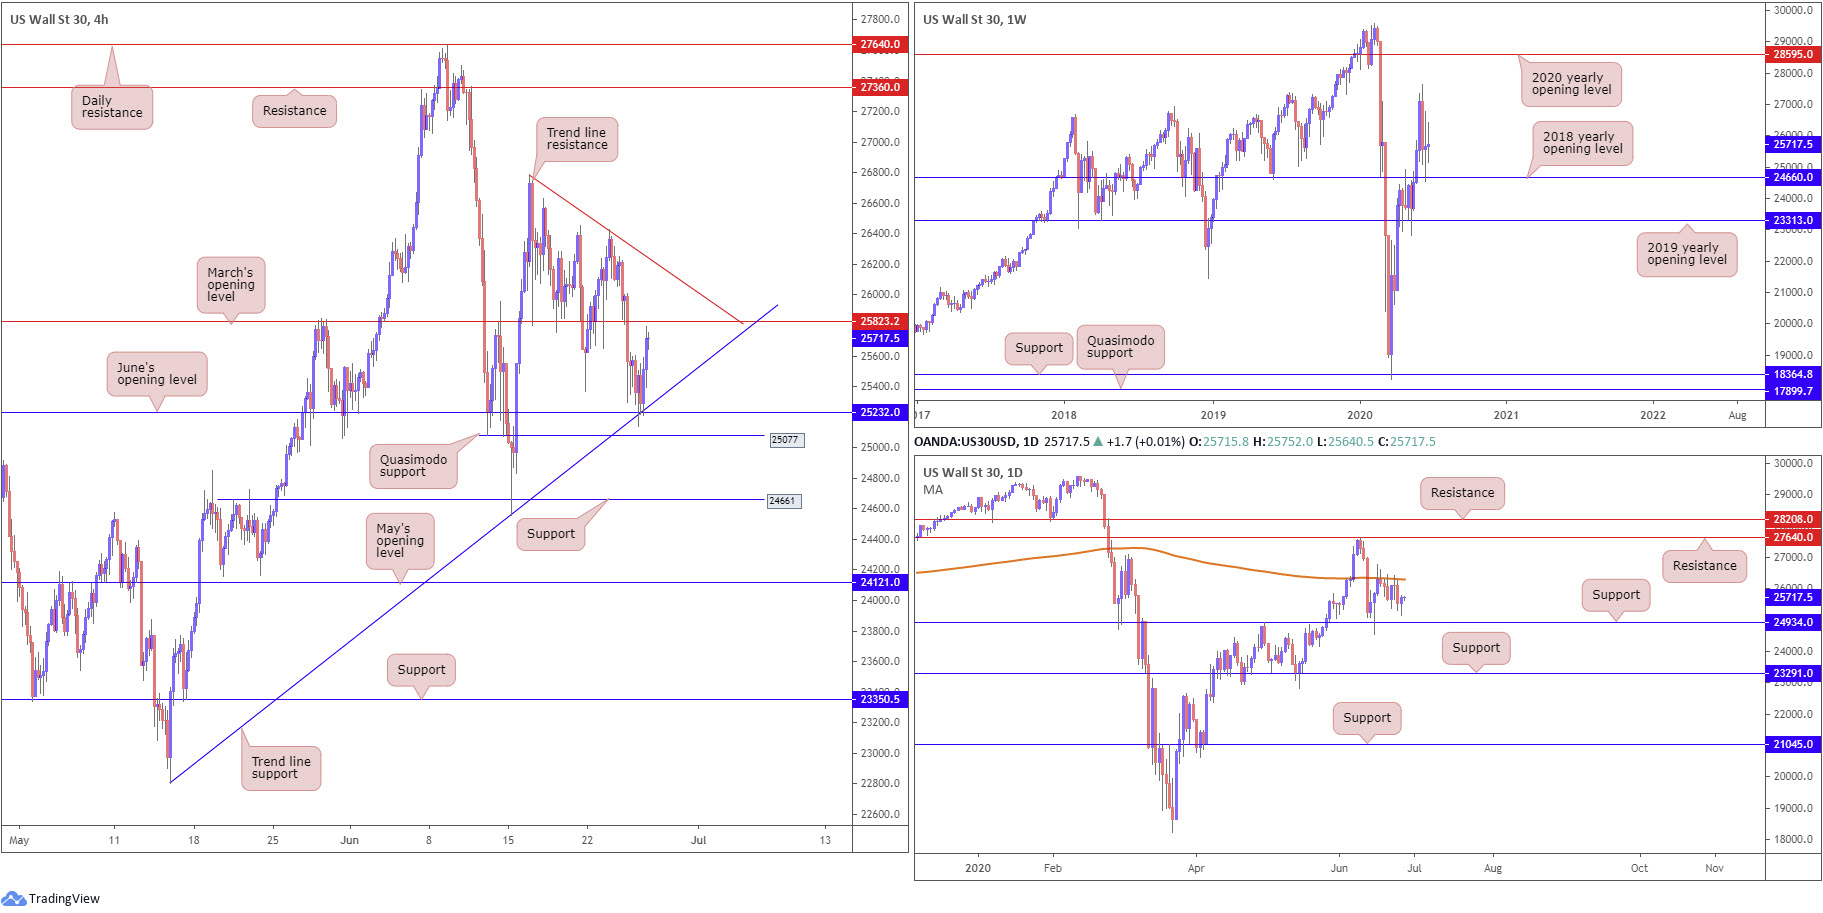
From a technical viewpoint, H4 traders established support off June’s opening level at 25232 Thursday, a level aligning with trend line support, extended from the low 22803, and sited just north of Quasimodo support priced in at 25077. March’s opening level at 25823 is considered the next upside target on the H4 timeframe, with a break exposing local trend line resistance, taken from the high 26787.
The 2018 yearly opening level at 24660 elbowed its way into the spotlight on the weekly timeframe in recent trading. Although candles put forward an indecisive tone, a bid here would pull in the 27638 high into view, followed by the 2020 yearly opening level at 28595. Below 24660, however, traders’ crosshairs may be fixed on the 2019 yearly opening level at 23313.
Since June 16, daily price has been languishing under the 200-day SMA (orange – 26298). Engulfing here points the spotlight at resistance coming in from 27640, while dipping launches support at 24934 into play.
Areas of consideration:
It’s clear, longer term, weekly buyers are currently hindered by daily sellers defending the 200-day SMA.
Intraday, March’s opening level at 25823 could spark seller interest on the H4 timeframe, as could nearby trend line resistance (26787).
XAU/USD (GOLD):
Gold is technically interesting right now.
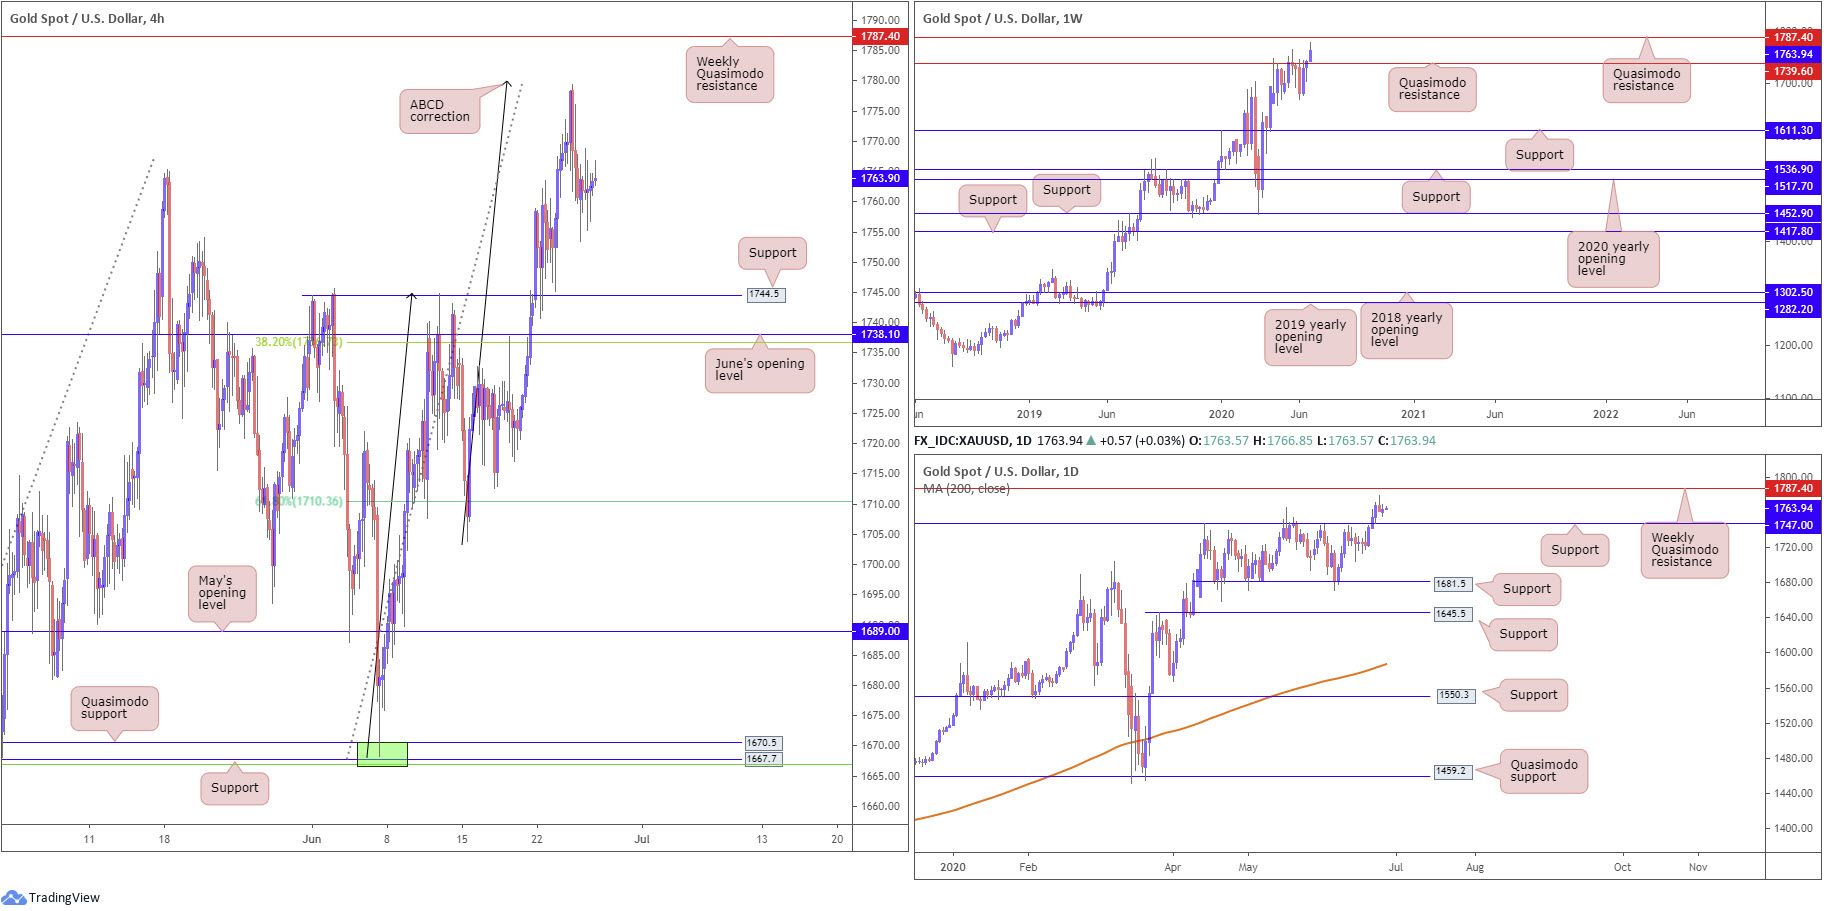
Wednesday faded a clear-cut H4 ABCD correction that topped around 1780.0ish (black arrows), with Thursday settling around 1763.3. Most ABCD traders will be watching for a dip to the 38.2% Fibonacci retracement at 1736.7 (derived from legs A-D), which, as you can see, converges with June’s opening level on the H4 at 1738.1.
What’s also interesting from a technical perspective is the recently engulfed weekly Quasimodo resistance at 1739.6 could also serve as support going forward – this level merges closely with our 38.2% Fibonacci retracement on the H4 at 1736.7.
Daily support, on the other hand, can be found slightly higher at 1747.0, mingling closely with H4 support at 1744.5.
As for upside targets, in the event we fail to dip lower, weekly Quasimodo resistance at 1787.4 remains prominent on all three timeframes right now.
Areas of consideration:
Traders short the H4 ABCD correction, as highlighted above, will likely have eyeballs on the 38.2% H4 Fibonacci retracement at 1736.7, and have protective stop-loss orders tucked above weekly Quasimodo resistance at 1787.4. This, along with the 61.8% H4 Fibonacci retracement ratio at 1710.3, are common take-profit targets out of ABCD structures.
The accuracy, completeness and timeliness of the information contained on this site cannot be guaranteed. IC Markets does not warranty, guarantee or make any representations, or assume any liability regarding financial results based on the use of the information in the site.
News, views, opinions, recommendations and other information obtained from sources outside of www.icmarkets.com.au, used in this site are believed to be reliable, but we cannot guarantee their accuracy or completeness. All such information is subject to change at any time without notice. IC Markets assumes no responsibility for the content of any linked site.
The fact that such links may exist does not indicate approval or endorsement of any material contained on any linked site. IC Markets is not liable for any harm caused by the transmission, through accessing the services or information on this site, of a computer virus, or other computer code or programming device that might be used to access, delete, damage, disable, disrupt or otherwise impede in any manner, the operation of the site or of any user’s software, hardware, data or property.


