
EUR/USD:
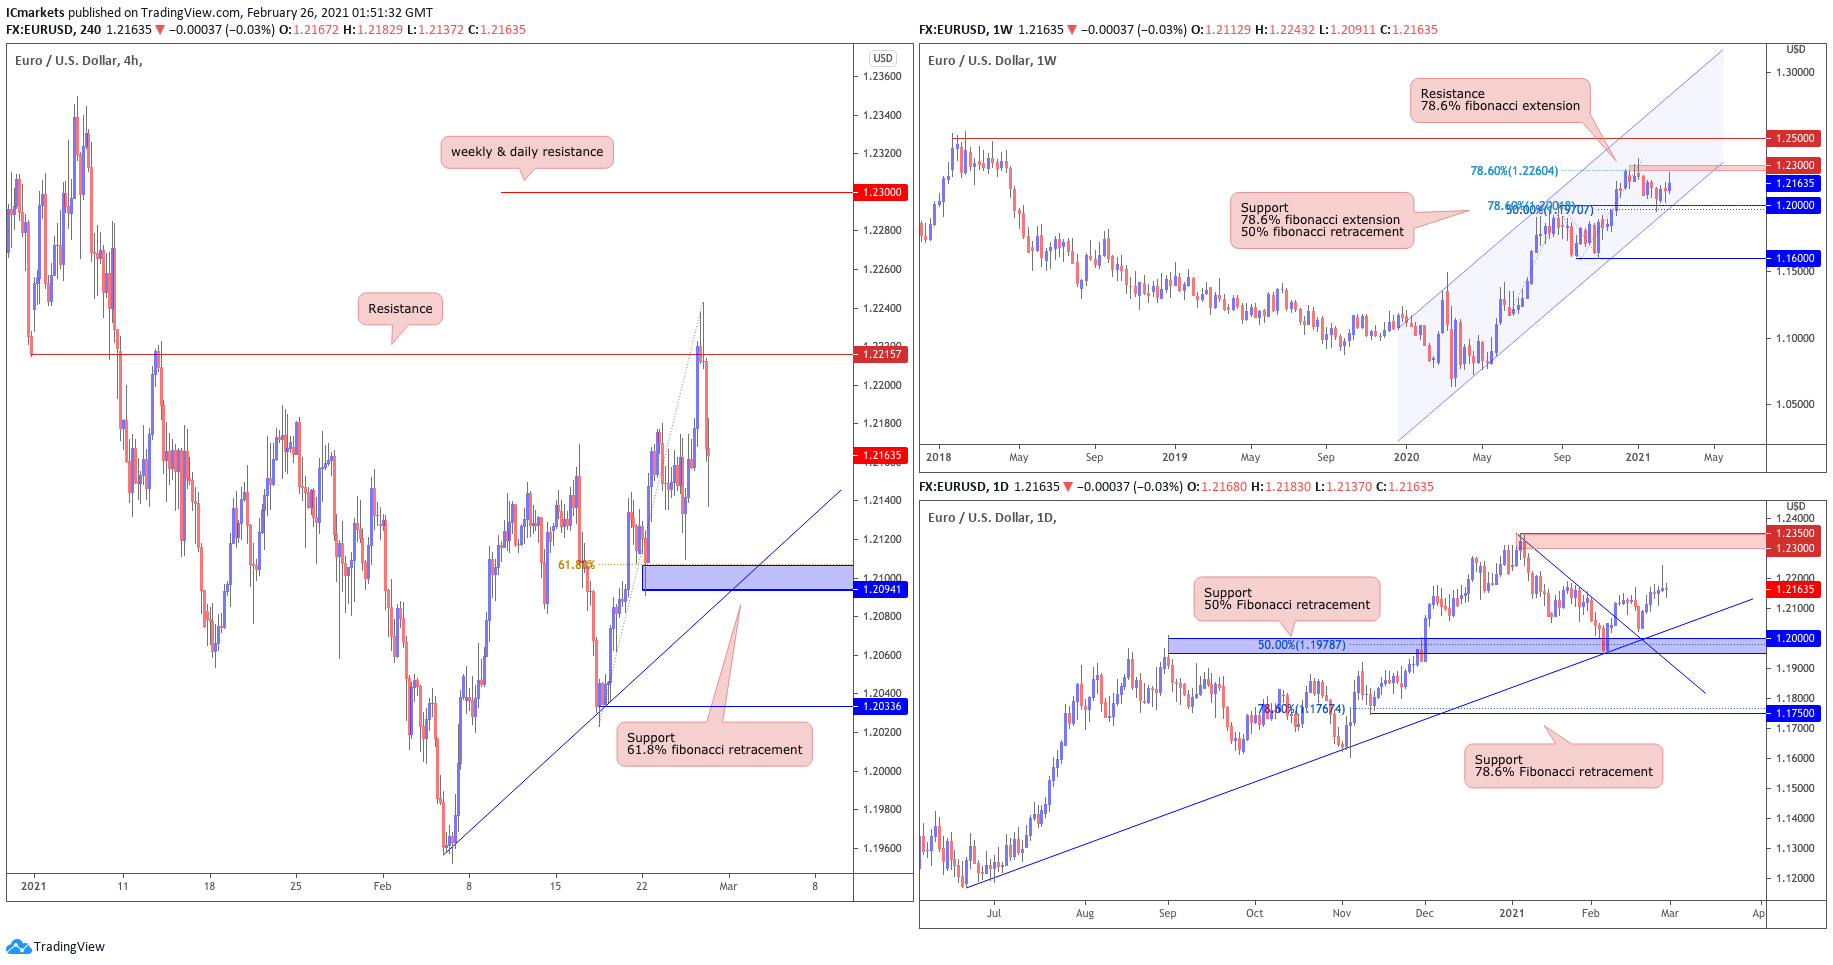
Looking at the weekly chart, we can see that prices are testing the support area of our ascending channel at 1.200, which coincides with the 50% Fibonacci retracement and 78.6% Fibonacci extension. We could see a further upside to test our resistance area at 1.2300, in line with the graphical swing high resistance and 78.6% Fibonacci extension. On the daily time frame, prices are holding nicely above the ascending trend line and support area at 1.200 which can also be found on the weekly time frame.
On the H4 timeframe, prices are facing bullish pressure from our support at 1.20941, in line with our graphical swing low support area and 50% fibonacci retracement. We could see limited upside before price reaches our resistance area at 1.21557, in line with the graphical swing high resistance level. A break above this resistance level could see a further push up to our next resistance target at 1.2300, in line with our resistance level found on the weekly and daily time frame.
Areas of consideration:
- 20941 support area found on H4 time frame
- 22157 resistance level found on H4 time frame
GBP/USD:
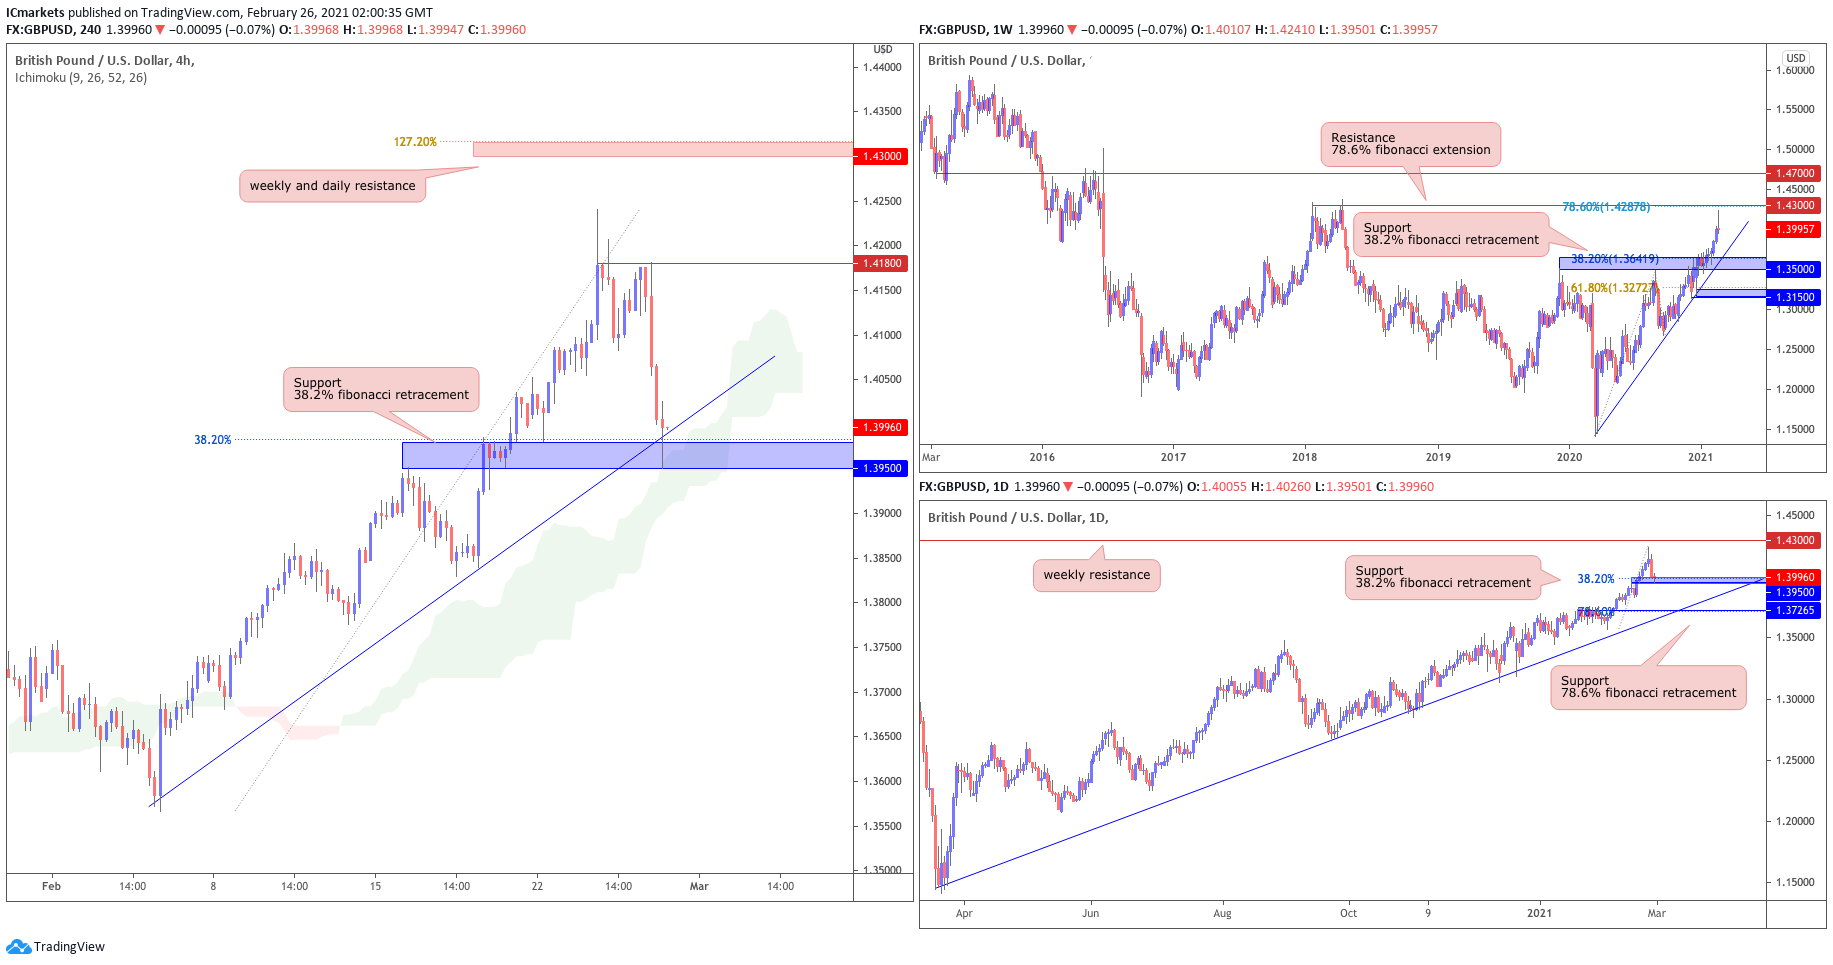
Looking at the weekly chart, we can see that prices are holding nicely above our ascending trend line and weekly support area at 1.35000 where we could see a further upside to the weekly resistance level at 1.43000, in line with the graphical swing high area and 78.6% Fibonacci extension. On the daily time frame, our support area at 1.39500 coincides with the 38.2% Fibonacci retracement.
On the H4 timeframe, prices are facing bullish pressure from our key support area at 1.39500, which is also the support level found on the daily time frame. This support area coincides with the H4 ascending trend line and we could see a bounce above this level towards our resistance target at 1.41800, in line with the graphical swing high resistance area found on the H4 time frame.
Areas of consideration:
- 41800 resistance area found on H4 time frame
- 3950 support area found on H4 timeframe
AUD/USD:
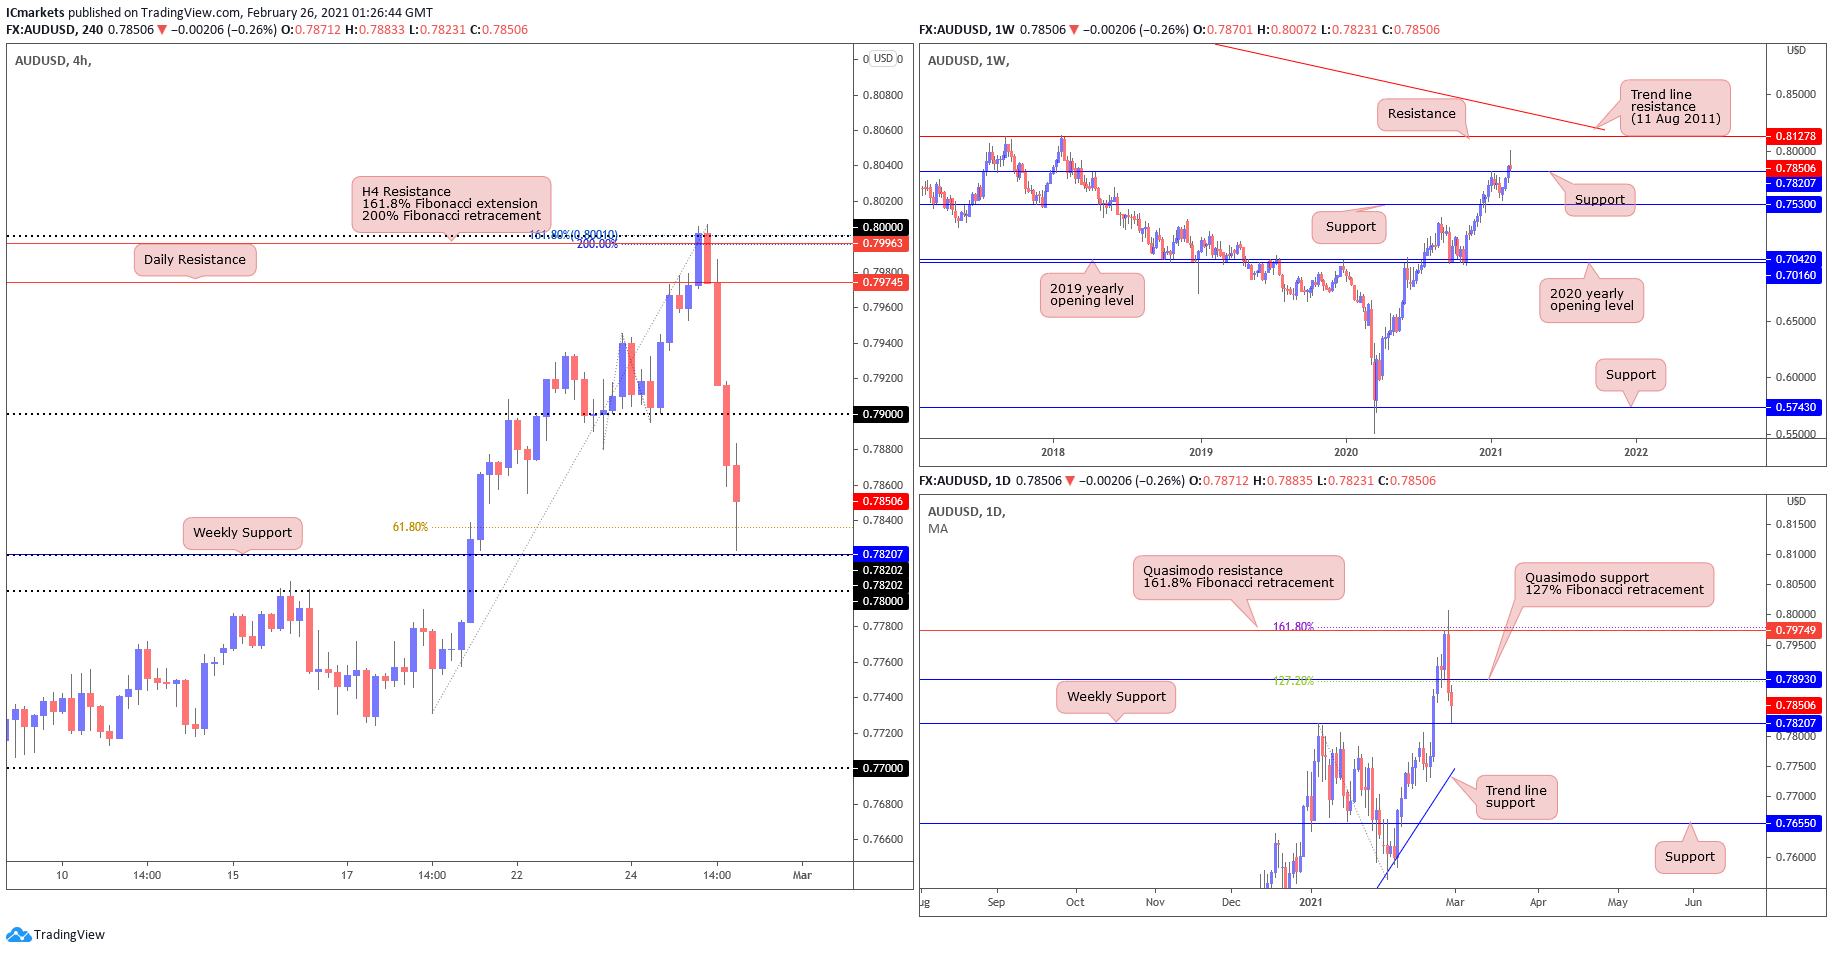
As the Bullish momentum strengthens, we may witness the continuation of this trend towards the next H4 resistance level of 0.79963, in line with 161.8% fibonacci extension, 200% fibonacci retracement and the major figure of 0.8.
From the Weekly timeframe, we can see that the price has pushed past the 0.78207 level where the previous high was made and has closed above that level, signalling the continuation of this bullish momentum. On the Daily timeframe, price has tapped and reversed 180pips from the Quasimodo resistance at 0.79749, which is also in line with the 161.8% fibonacci retracement. On H4, we can see a little more clearly how price have reversed at the resistance level of 0.79963, in line with 161.8% fibonacci extension, 200% fibonacci retracement and the major figure of 0.8, it made a beeline straight back down onto Weekly support level of 0.78207, and also the 61.8% fibonacci retracement level, we may see a continuation of bullish trend from here. If not, price may swing towards the next support level of major figure 0.78
Areas of consideration:
- H4 may bounce from 61.8% fibonacci retracement and Weekly support before continuation of Bullish momentum.
- Weekly and Daily time frames are showing strong bullish momentum.
USD/JPY
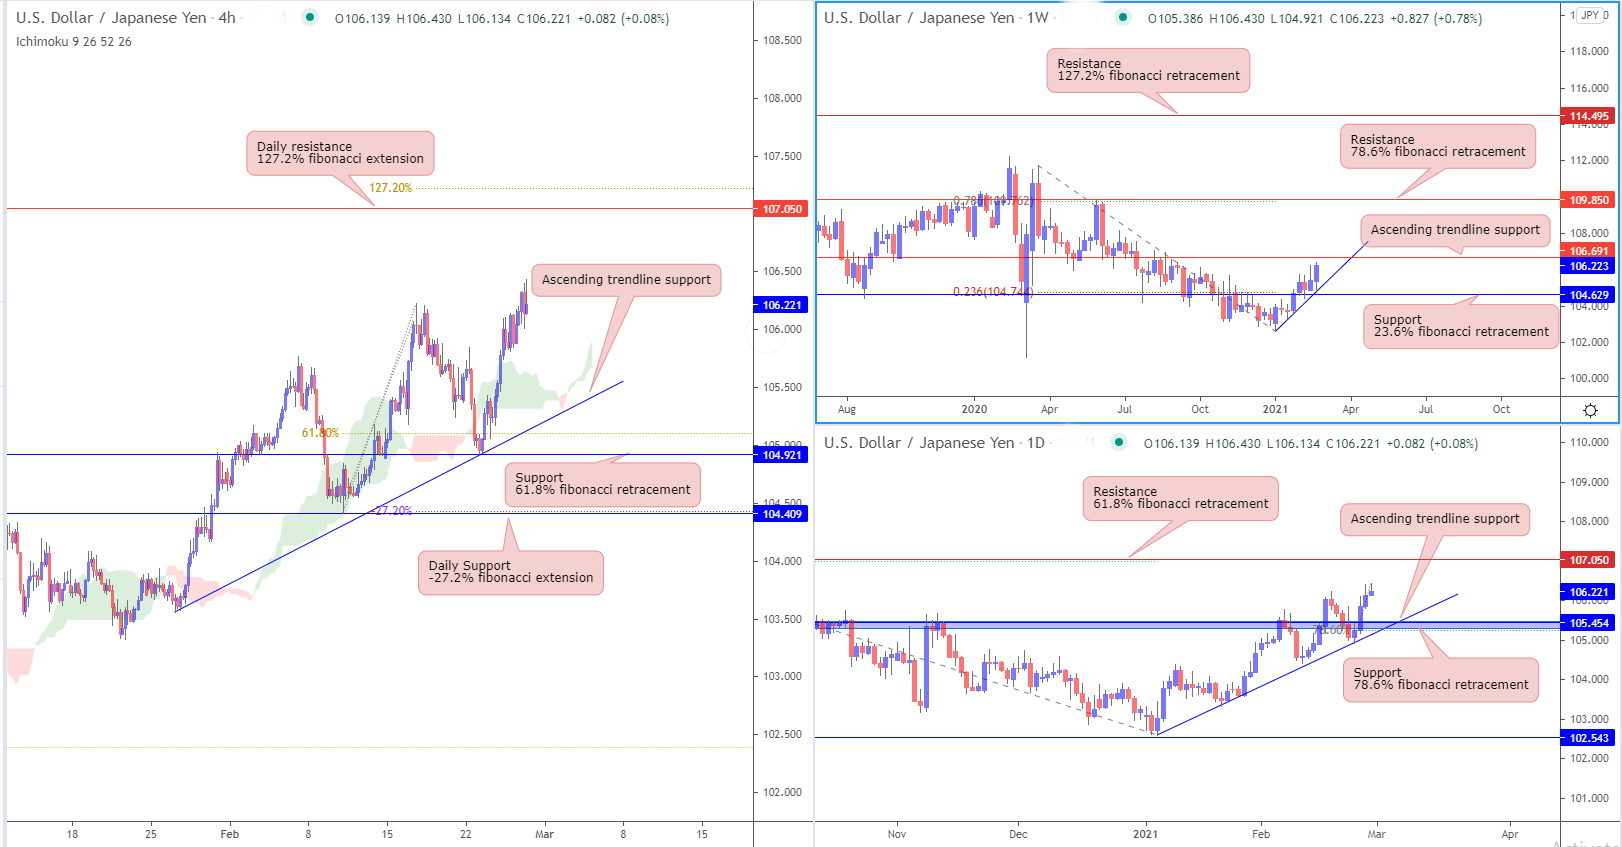
From the weekly timeframe, we can see that the price is holding nicely above a steady ascending trendline support and is on a steady uptrend. Price is holding above support which coincides with 23.6% fibonacci retracement. On the daily time frame, price is also on a steady uptrend and prices have broken past the resistance turned support zone which is also a 78.6% fibonacci retracement. On H4, prices are taking support from the ascending trendline as well and have bounced up from previous trendline support which coincides with 61.8% fibonacci retracement. Prices might make a pull back to the trend line and bounce back up towards the resistance which coincides with the 127.2% fibonacci extension level. Furthermore, prices are holding above the Ichimoku cloud, showing bullish momentum.
Areas of consideration:
- 05 resistance on the H4 and daily time frame is a possible upside target
- 45 support level on daily timeframe in line with the ascending trendline support, support turned resistance and 78.6% fibonacci retracement
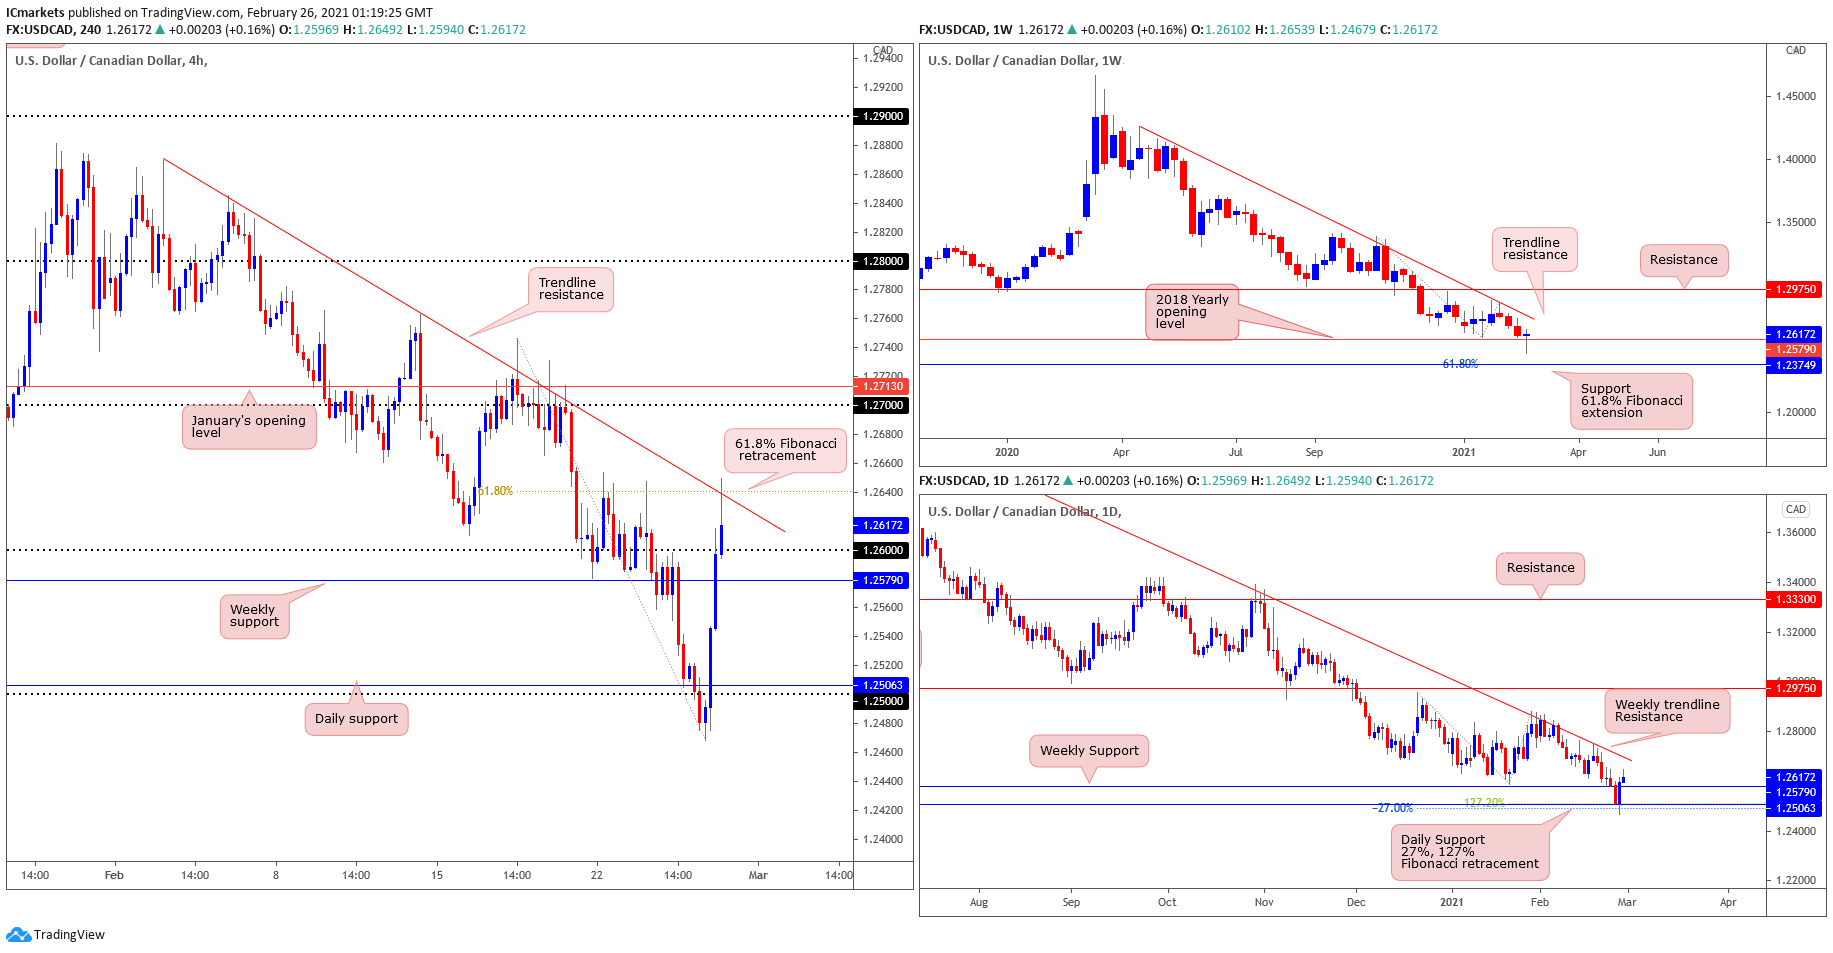
USD/CAD:
Looking at the weekly chart, price is currently testing the 2018 Yearly Opening level of support at 1.2579, and is still respecting the descending trendline drawn from 13 April (2020) high. It is important to note that the long-term picture has pointed the direction down (trend) since March (2020). In the daily time frame, price has bounced off the Daily Support level of 1.25063, where the -27% and 127% fibonacci retracement are. Price is hovering above the Weekly support. And on the H4 timeframe, we are able to witness a 180 pips bullish push upwards breaking all previous resistance levels with no pull backs. This spring of action sent prices back into the descending trendline drawn from 2nd February (2021), looking at the candle sticks, sellers may wait for more confirmation of bearish momentum before entering. Currently, price has tapped on the 61.8% fibonacci retracement, we may see the start of a reversal on this point. If not, price may break the descending trendline and test the next major figure of 1.27.
Areas of consideration:
- H4 returned to a descending trendline and 61.8% fibonacci retracement level, may continue a bearish move from here.
- Weekly and Daily both showing bearish momentum in the longer-term picture, in line with a bearish view.
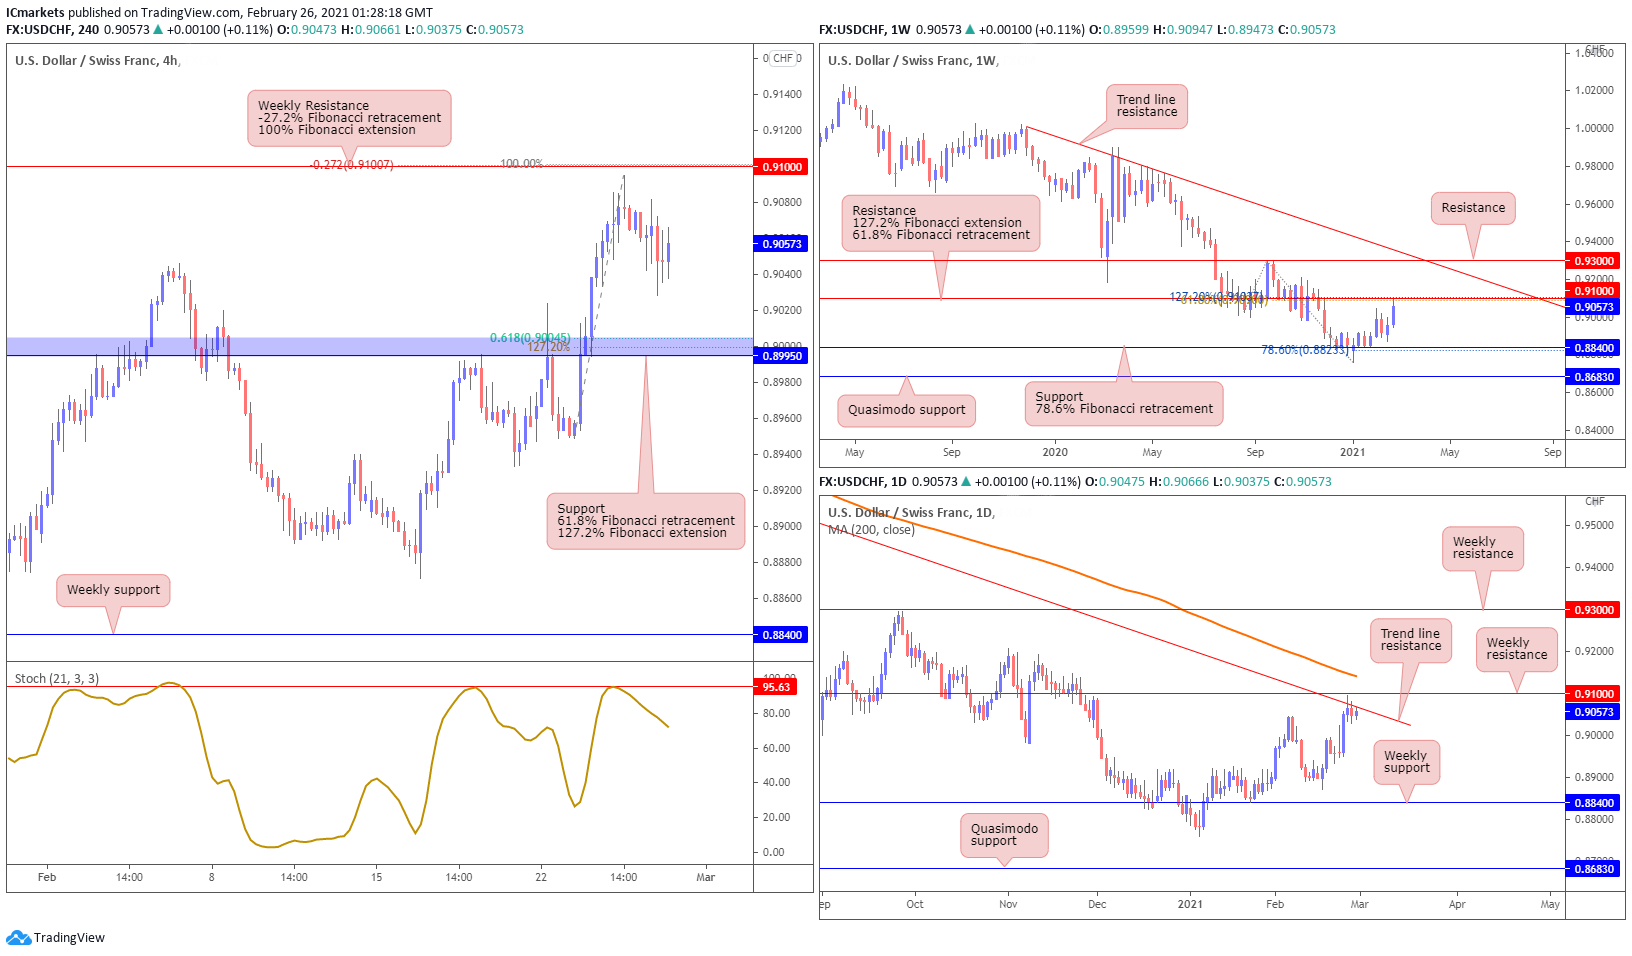
USD/CHF:
USD/CHF continues to see bearish pressure on the weekly and daily timeframes. Looking at the weekly timeframe, we can see that price has managed to hold below the weekly resistance level at 0.91000, which is in line with our 61.8% Fibonacci retracement and 127.2% Fibonacci extension levels. On the daily timeframe, we see that price is facing major resistance as it continues to hold below both the descending trendline and moving average. In this scenario, we could potentially see further downside towards the weekly support at the 0.88400 level.
On the H4 chart, we can see that price has reversed from the weekly 0.91000 resistance level, which is in line with our -27.2% Fibonacci retracement and 100% Fibonacci extension levels. We note that the Stochastic indicator has reversed from the 95.63 level where it has reacted from before. We expect price to face further bearish pressure and push lower down south to test the 0.89950 support level, which is in line with our 61.88% Fibonacci retracement, 127.2% Fibonacci extension and horizontal pullback support levels. Otherwise, a break and close above the 0.91000 level will see price pushing higher above.
Areas of consideration:
- Price managed to hold below the weekly 0.91000 resistance level.
- 89950 support level is a potential downside target for sellers in this bearish scenario.
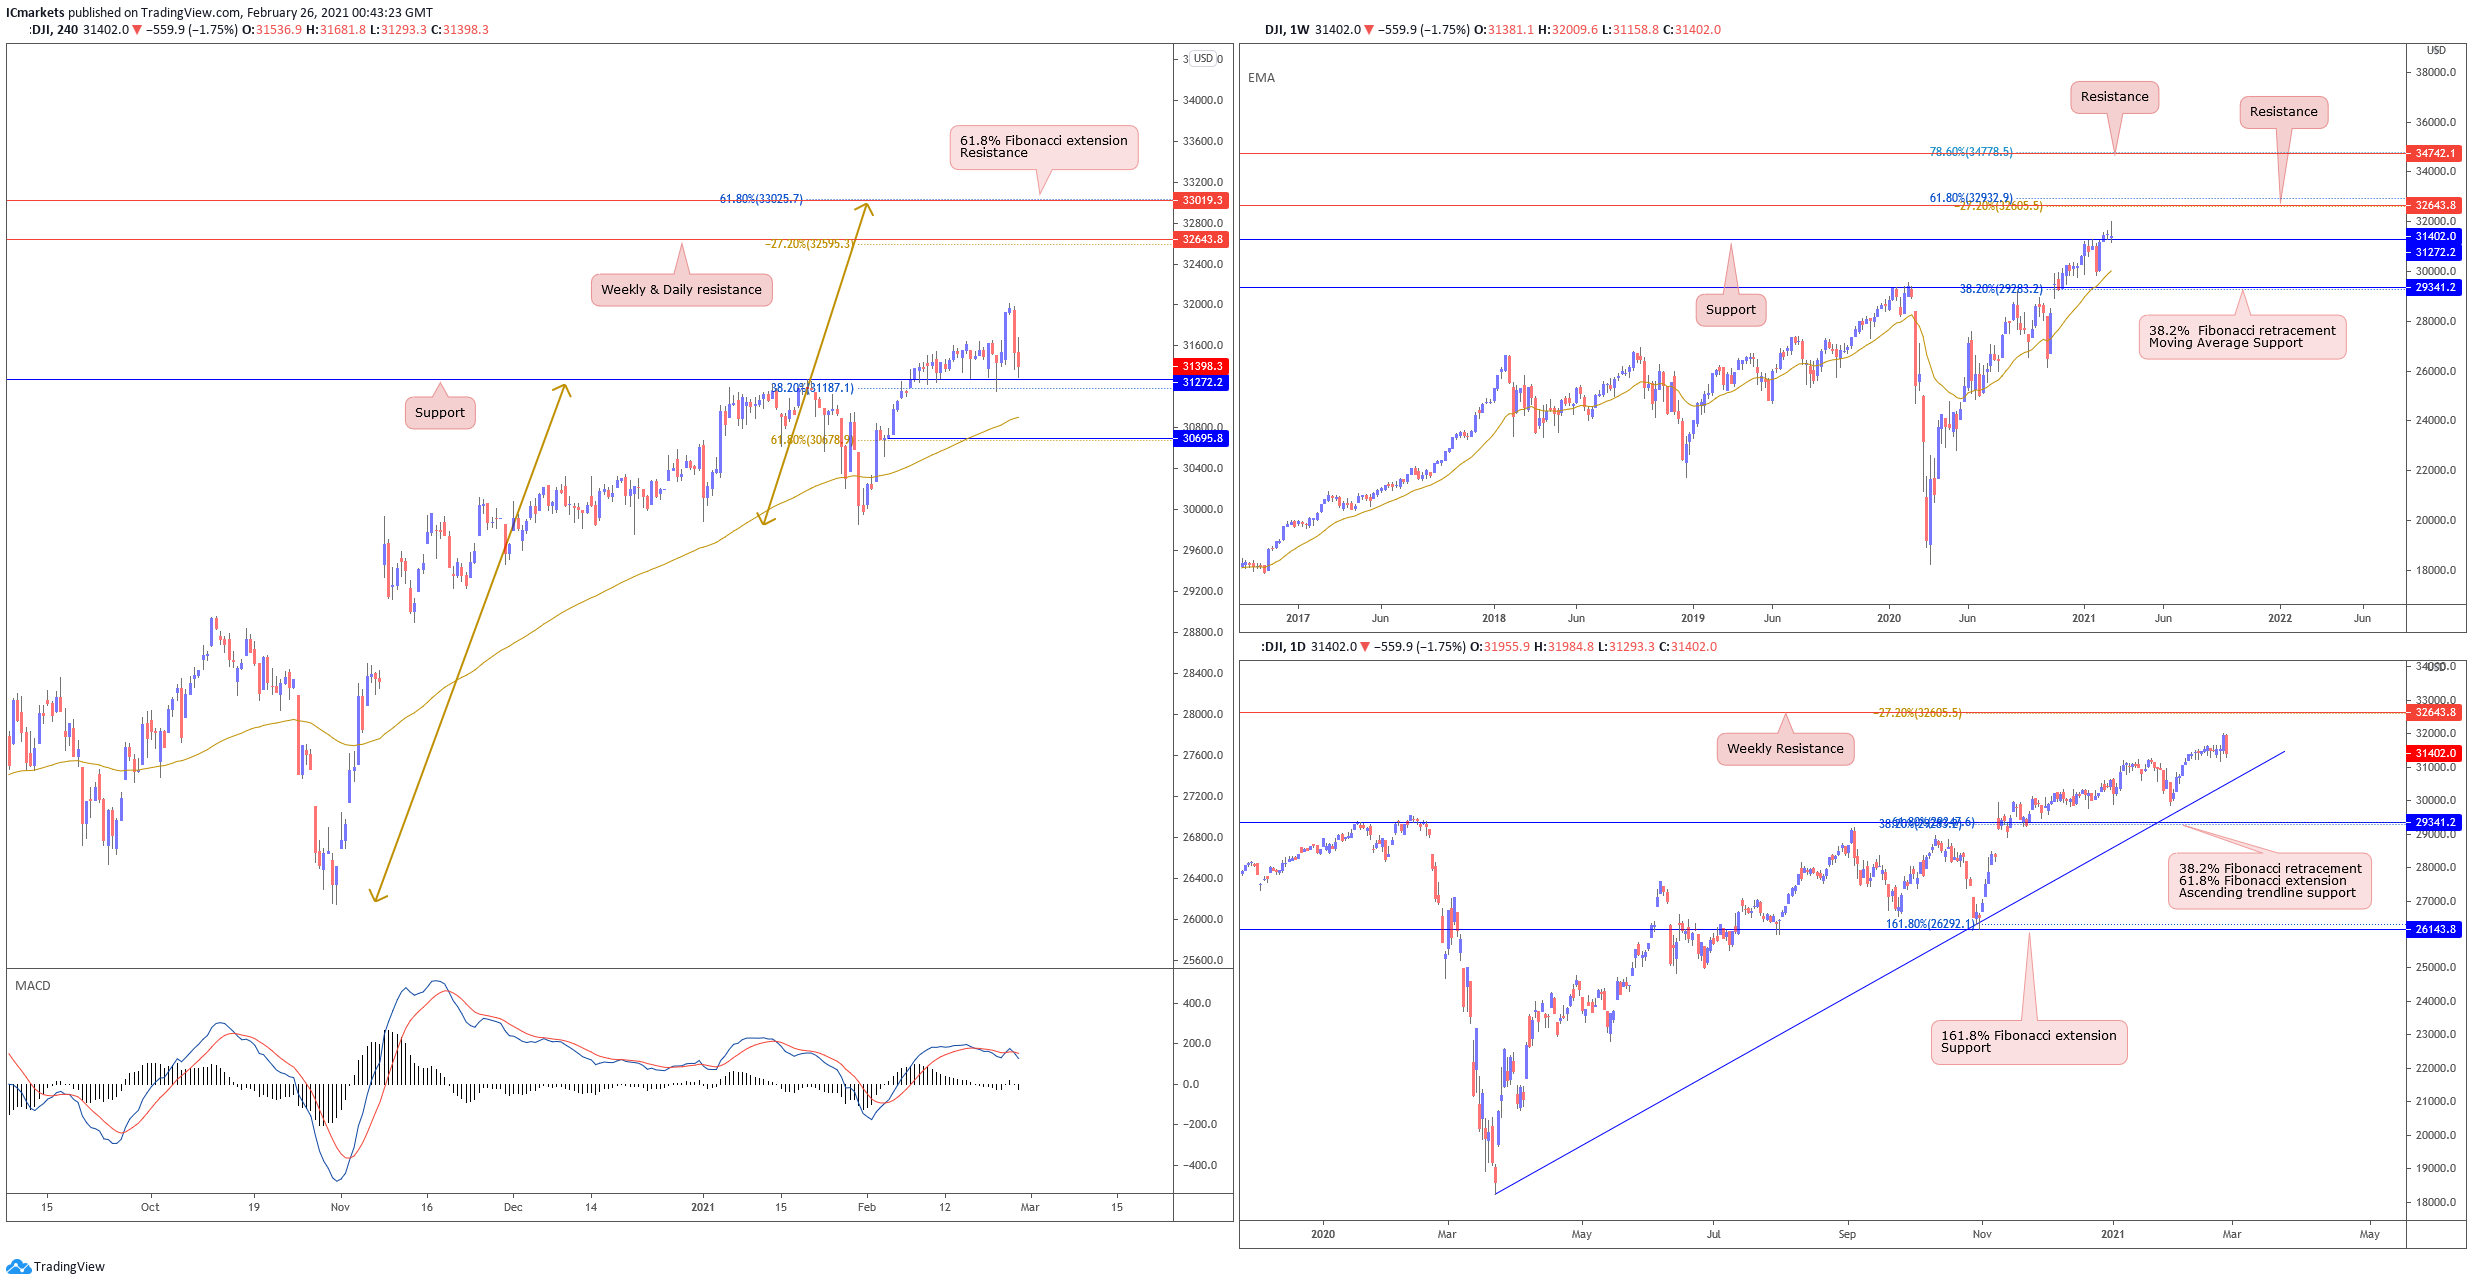
Dow Jones Industrial Average:
On the weekly chart, price continues to hold above 31272 resistance. Traders can expect to see price pushing even higher towards the next resistance at 32643. Otherwise, failure to hold above 31272 could mean that this is a fake out and probably pull back towards 29341 support. With no change for the Daily, price continues to hold very strongly above ascending trendline support. Traders should be careful when deciding to trade any short term pullbacks as the bullish momentum on the longer term still remains very strong.
On the H4, price pulled back overnight, and came back to test graphical overlap support at 31272. We note that Technical indicators continue to show room for further bullish upside. And could probably see buyers add to their longs at 31272 to with a target at 32643. Otherwise, failure to hold above 31272 could see price swing to 30695.
Areas of consideration:
- Intraday support at 31272 level to watch
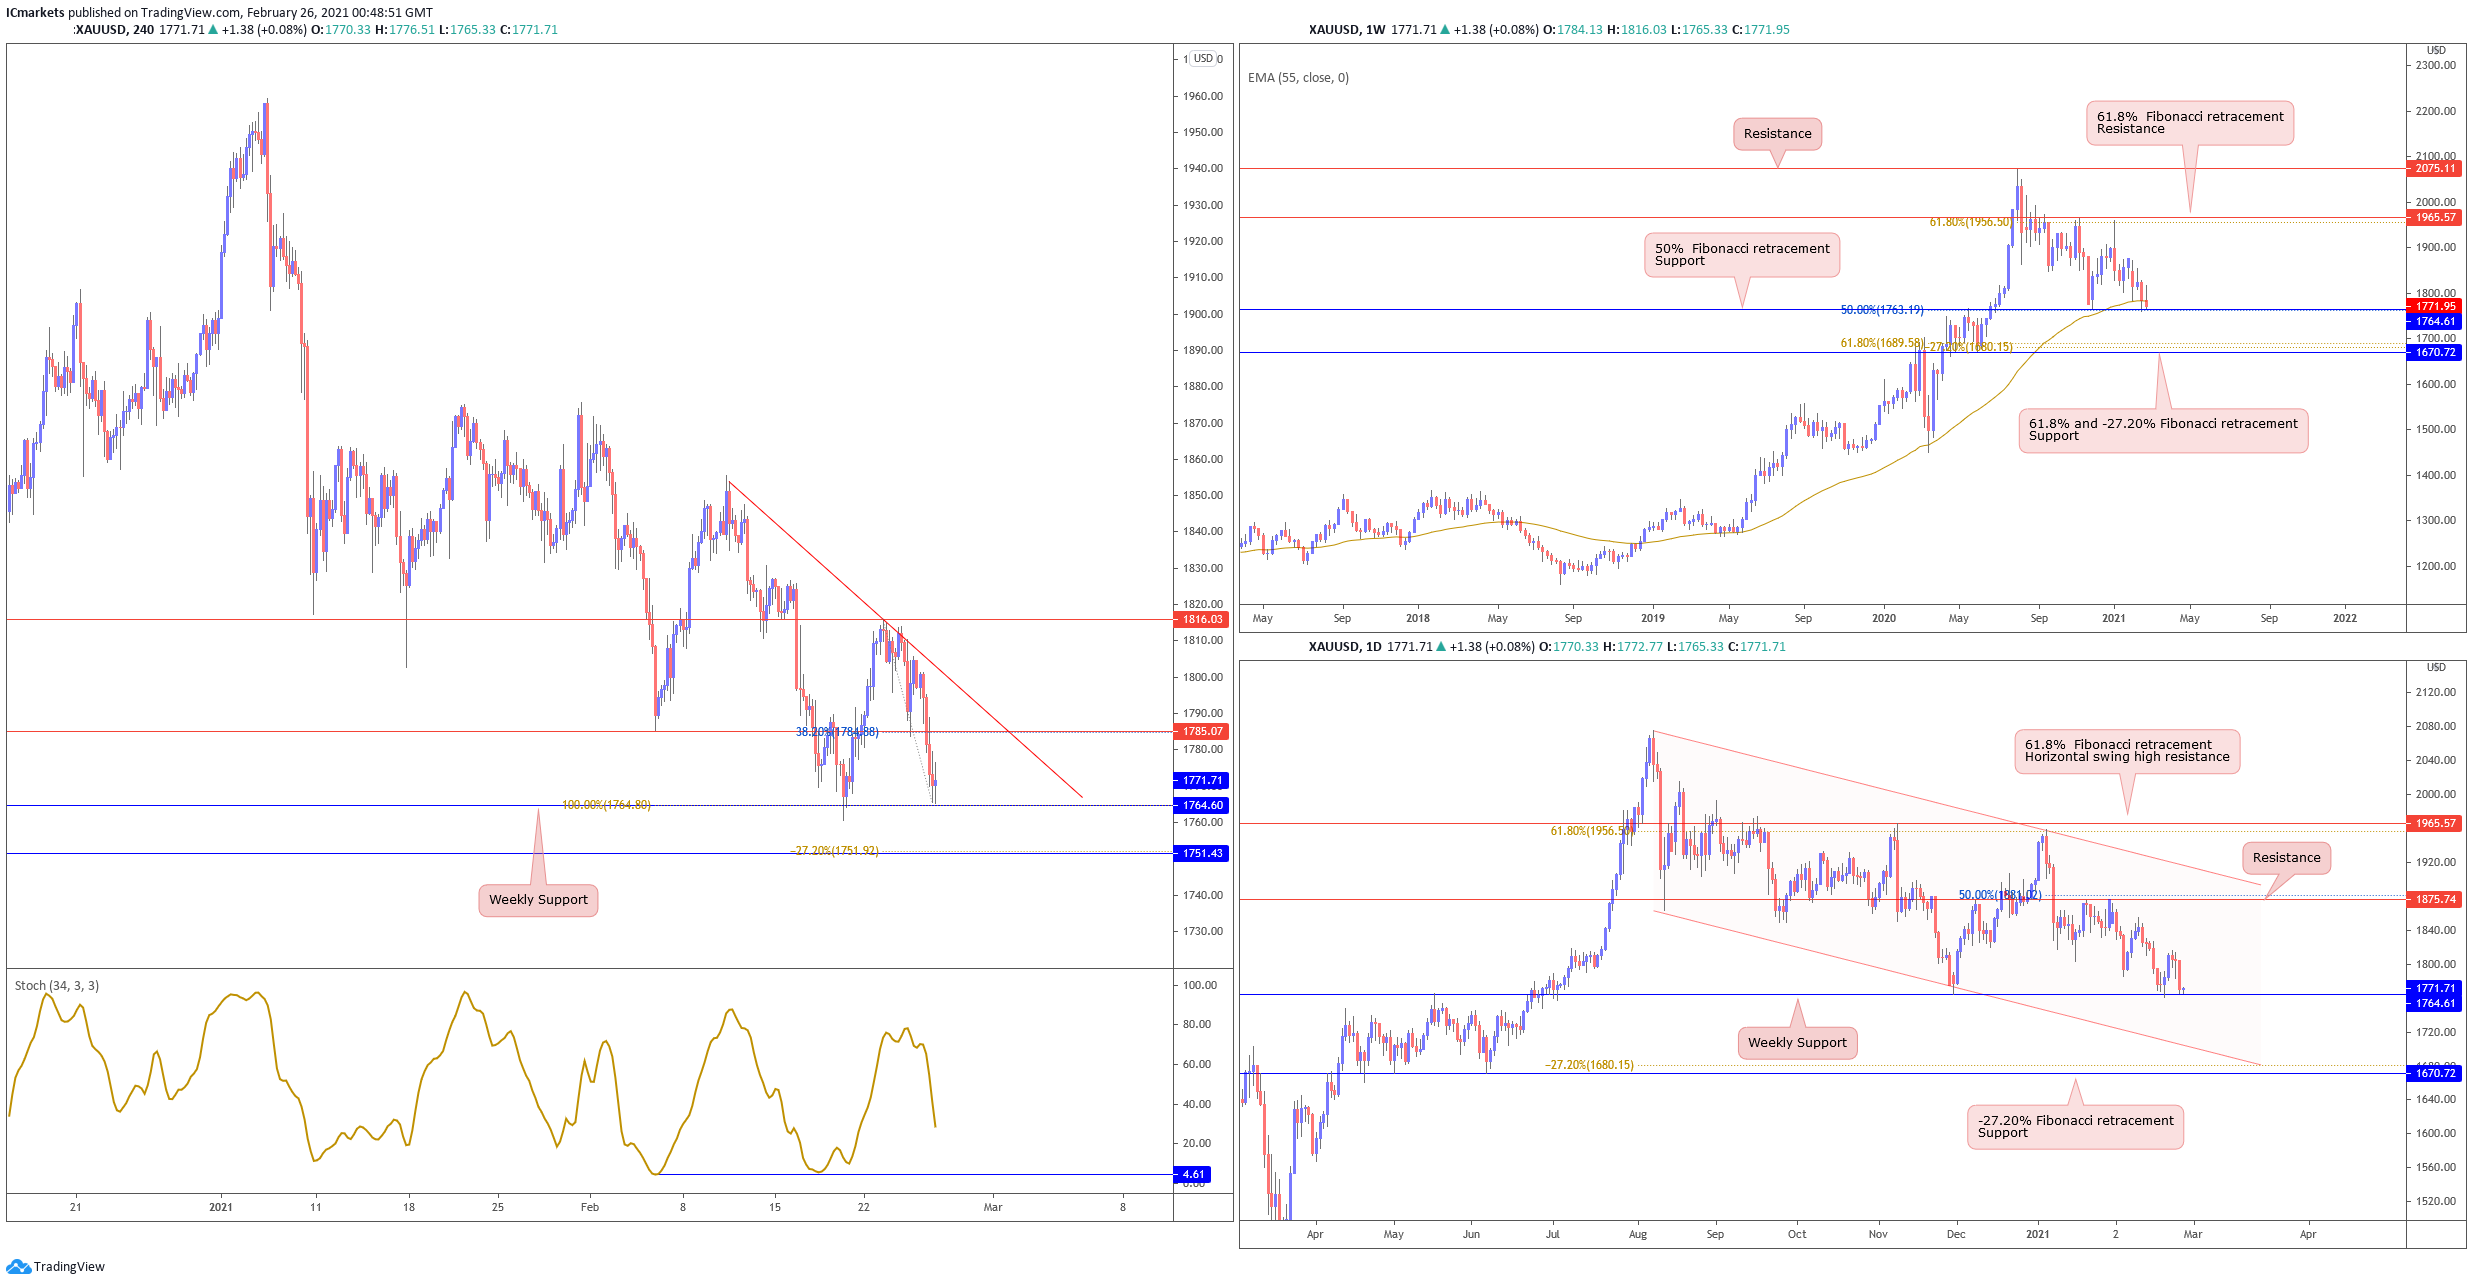
XAU/USD (GOLD):
On the weekly timeframe, gold is still holding above long term moving average support and tested 1764 support, above which there could be a possibility of a bounce reaction. On the daily chart, with price pulled back to test and continues to hold above 1764 support, buyers could possibly consider this level and add to their longs while looking at 1875 resistance as a possible target. Otherwise, we could see price breaking below 1764 and push towards descending channel support at 1670.
On the 4H timeframe, price pushed lower and is holding below a short term descending trendline resistance. With price now close to weekly support at 1764 and stochastic also approaching support where price bounced in the past, we see 1764 as a strong support where buyers in the neighbourhood could very well add to their longs to push price higher towards 1785 resistance. Otherwise, a break and a weekly close below 1764 will see price drop even lower.
Areas of consideration:
- 1764 key weekly support to watch
The accuracy, completeness and timeliness of the information contained on this site cannot be guaranteed. IC Markets does not warranty, guarantee or make any representations, or assume any liability regarding financial results based on the use of the information in the site.
News, views, opinions, recommendations and other information obtained from sources outside of www.icmarkets.com.au, used in this site are believed to be reliable, but we cannot guarantee their accuracy or completeness. All such information is subject to change at any time without notice. IC Markets assumes no responsibility for the content of any linked site.
The fact that such links may exist does not indicate approval or endorsement of any material contained on any linked site. IC Markets is not liable for any harm caused by the transmission, through accessing the services or information on this site, of a computer virus, or other computer code or programming device that might be used to access, delete, damage, disable, disrupt or otherwise impede in any manner, the operation of the site or of any user’s software, hardware, data or property.


