
Key risk events today:
US Core Durable Goods Orders m/m; US Durable Goods Orders m/m.
(Previous analysis as well as outside sources – italics).
EUR/USD:
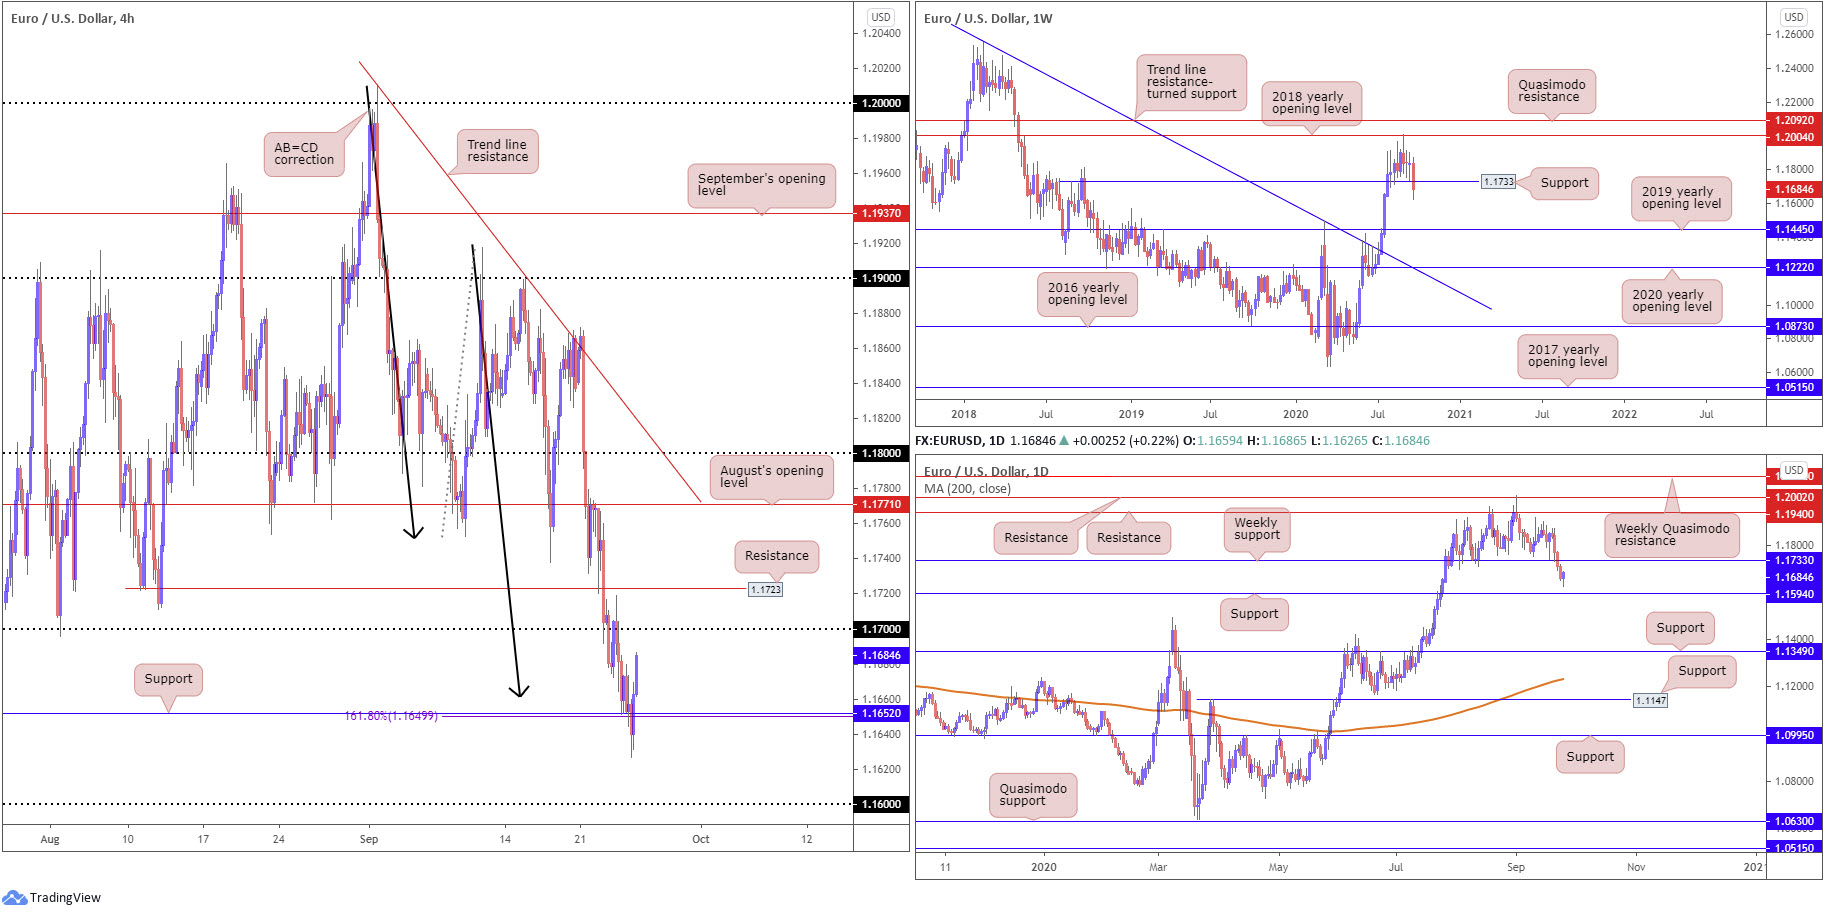
Despite mildly surpassing H4 support at 1.1652, a level closely joined by AB=CD structure (black arrows) at 1.1660 and 1.618 BC projection at 1.1649, EUR/USD bulls went on the offensive Thursday. Focus, therefore, has shifted back to the 1.17 handle, sheltered by a resistance level at 1.1723 (previous Quasimodo support). Below 1.1652, traders will acknowledge the chart appears starved of support until reaching the 1.16 handle.
On the weekly timeframe, support at 1.1733, a prior Quasimodo resistance level, remains under attack. A notable close beyond the aforementioned level shines the spotlight on the 2019 yearly opening level at 1.1445. Interestingly, the daily timeframe also displays room to explore lower levels, targeting support priced in at 1.1594.
Areas of consideration:
Short term, the H4 AB=CD correction around 1.1660 and H4 support at 1.1652 has clearly interested buyers. There is, of course, one cautionary point to consider here: the higher timeframes exhibit limited support until 1.1594 on the daily timeframe. For that reason, H4 gaining much beyond 1.17 and the resistance level at 1.1723 is unlikely.
With that being the case, 1.1723/1.17 offers an interesting resistance area to target for current longs, and a potential reversal zone for sellers seeking to join the (possible) move lower to daily support at 1.1594 (essentially the 1.16 handle on the H4).
GBP/USD:
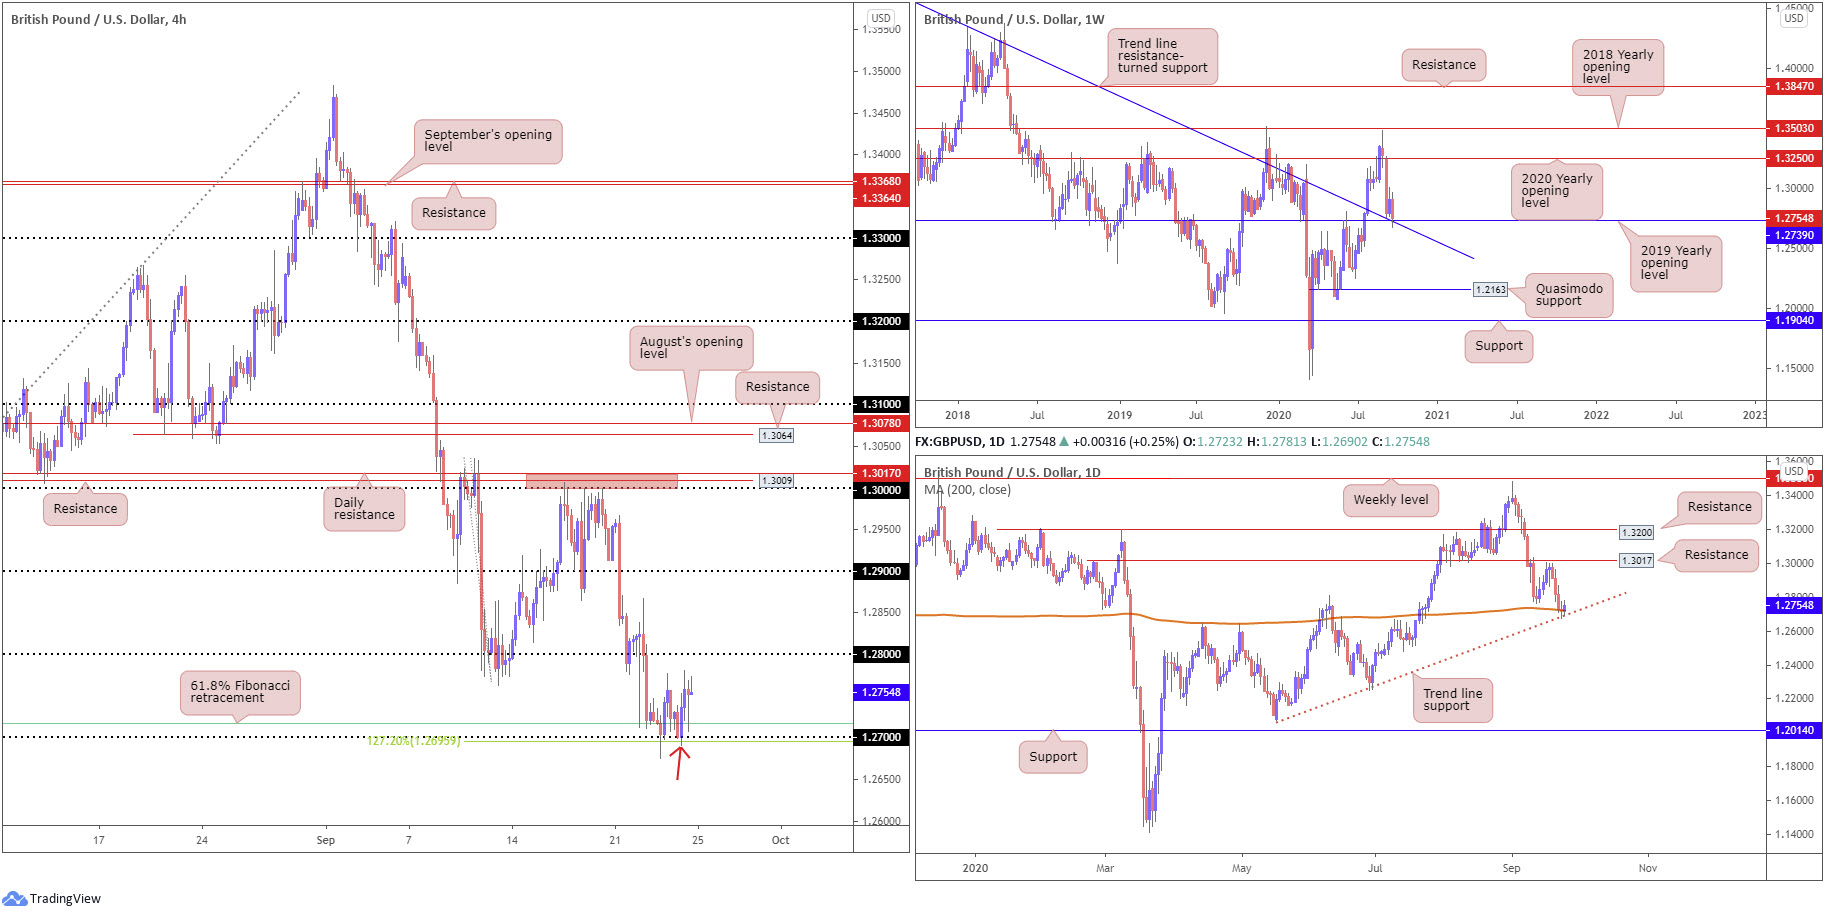
GBP/USD, as highlighted in recent reports, continues to trade at incredibly confluent support.
- Out of the weekly timeframe, the pair is crossing swords with the 2019 yearly opening value at 1.2739 and intersecting trend line resistance-turned support, taken from the high 1.5930.
- From the daily timeframe, trend line support, extended from the low 1.2075, and the 200-day SMA (orange – 1.2719) are in play.
- H4 is seen rebounding from the 1.27 handle and converging 61.8% Fibonacci retracement at 1.2718, as well as a 127.2% Fibonacci extension point at 1.2695.
Areas of consideration:
The reaction from 1.27 (and Fibonacci confluence), in the form of a H4 bullish engulfing candle (red arrow), along with current support on the higher timeframes, is likely appealing, enough to perhaps draw in buyers towards the 1.28 handle on the H4. A break higher also possibly exposes 1.29.
AUD/USD:
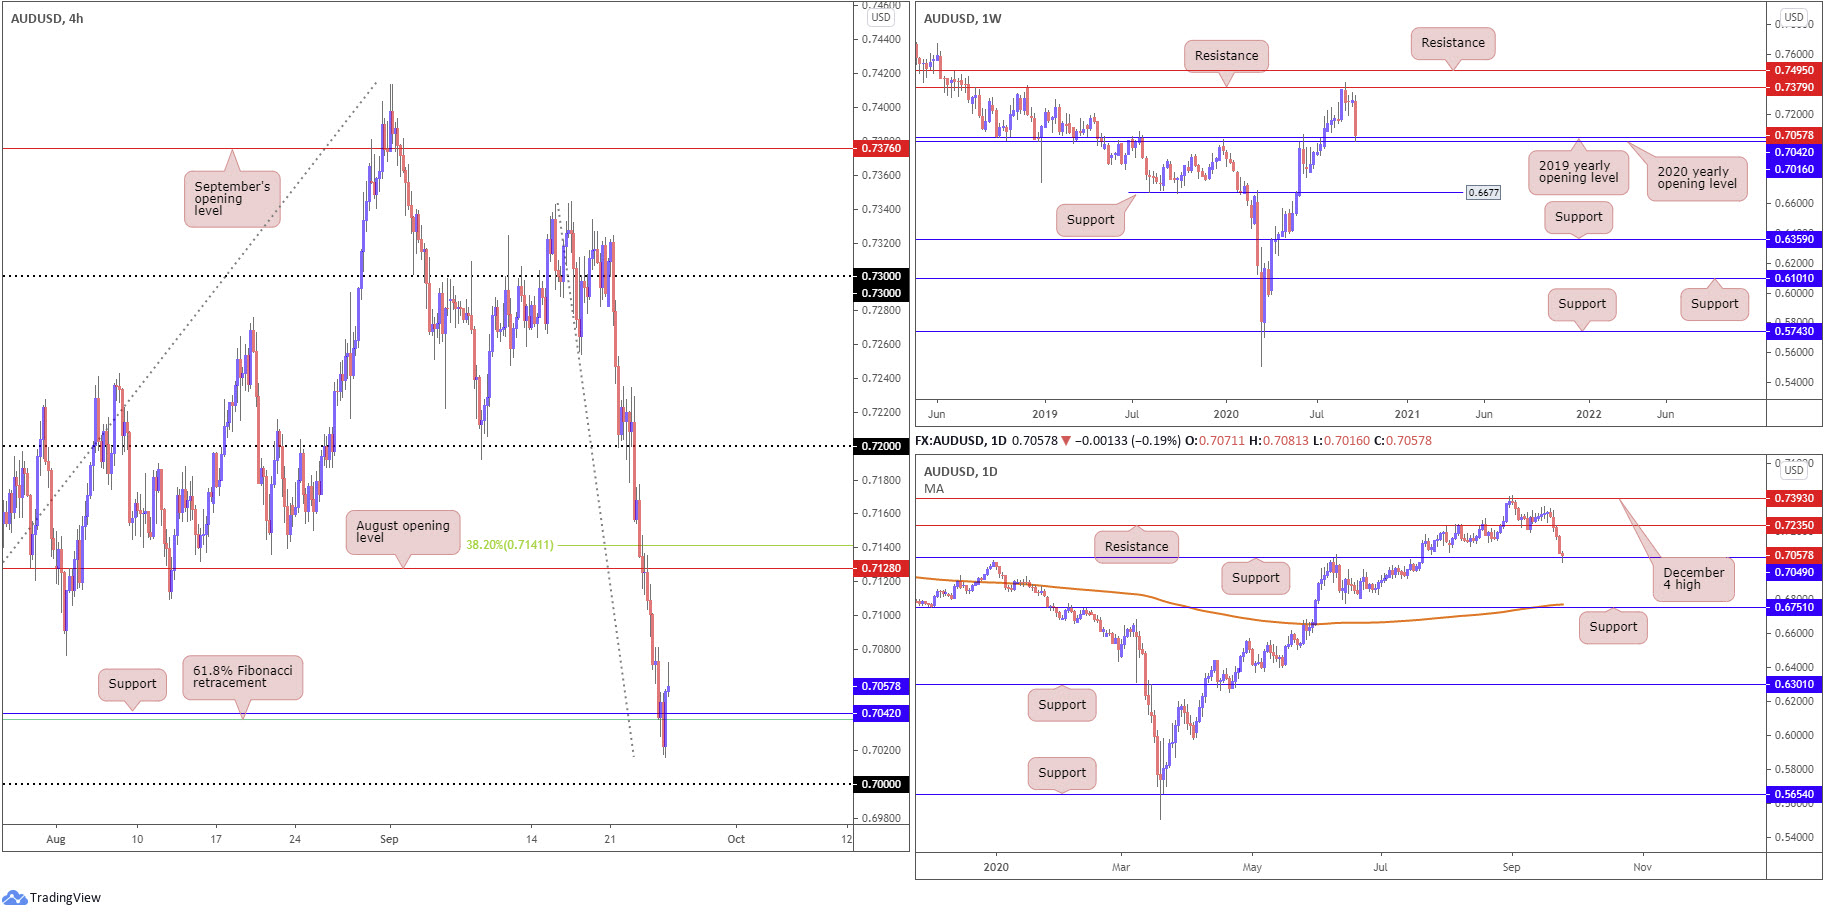
Thursday had AUD/USD bulls reassert some dominance.
Despite dipping through orders at H4 support drawn from 0.7042 and aligning 61.8% Fibonacci retracement ratio (green) at 0.7038, buyers staged a reasonably strong comeback ahead of the key figure 0.70 heading into US hours.
Aiding buyers are the 2020 and 2019 yearly opening values on the weekly timeframe at 0.7016 and 0.7042, respectively. Additional support is seen from the daily timeframe coming in at 0.7049.
Areas of consideration:
With higher timeframe supports recently elbowing into the spotlight, the pendulum appears to be swinging in favour of buyers right now. This, on top of the H4 recently fashioning a bullish engulfing candle off support at 0.7042, may be enough to encourage further buying today.
In terms of upside targets, the nearest (obvious) resistance on the higher timeframes rests at 0.7235, while on the H4 chart resistance is found at the 0.71 handle, followed by August’s opening value at 0.7128 and a 38.2% Fibonacci retracement ratio plotted at 0.7141.
USD/JPY:
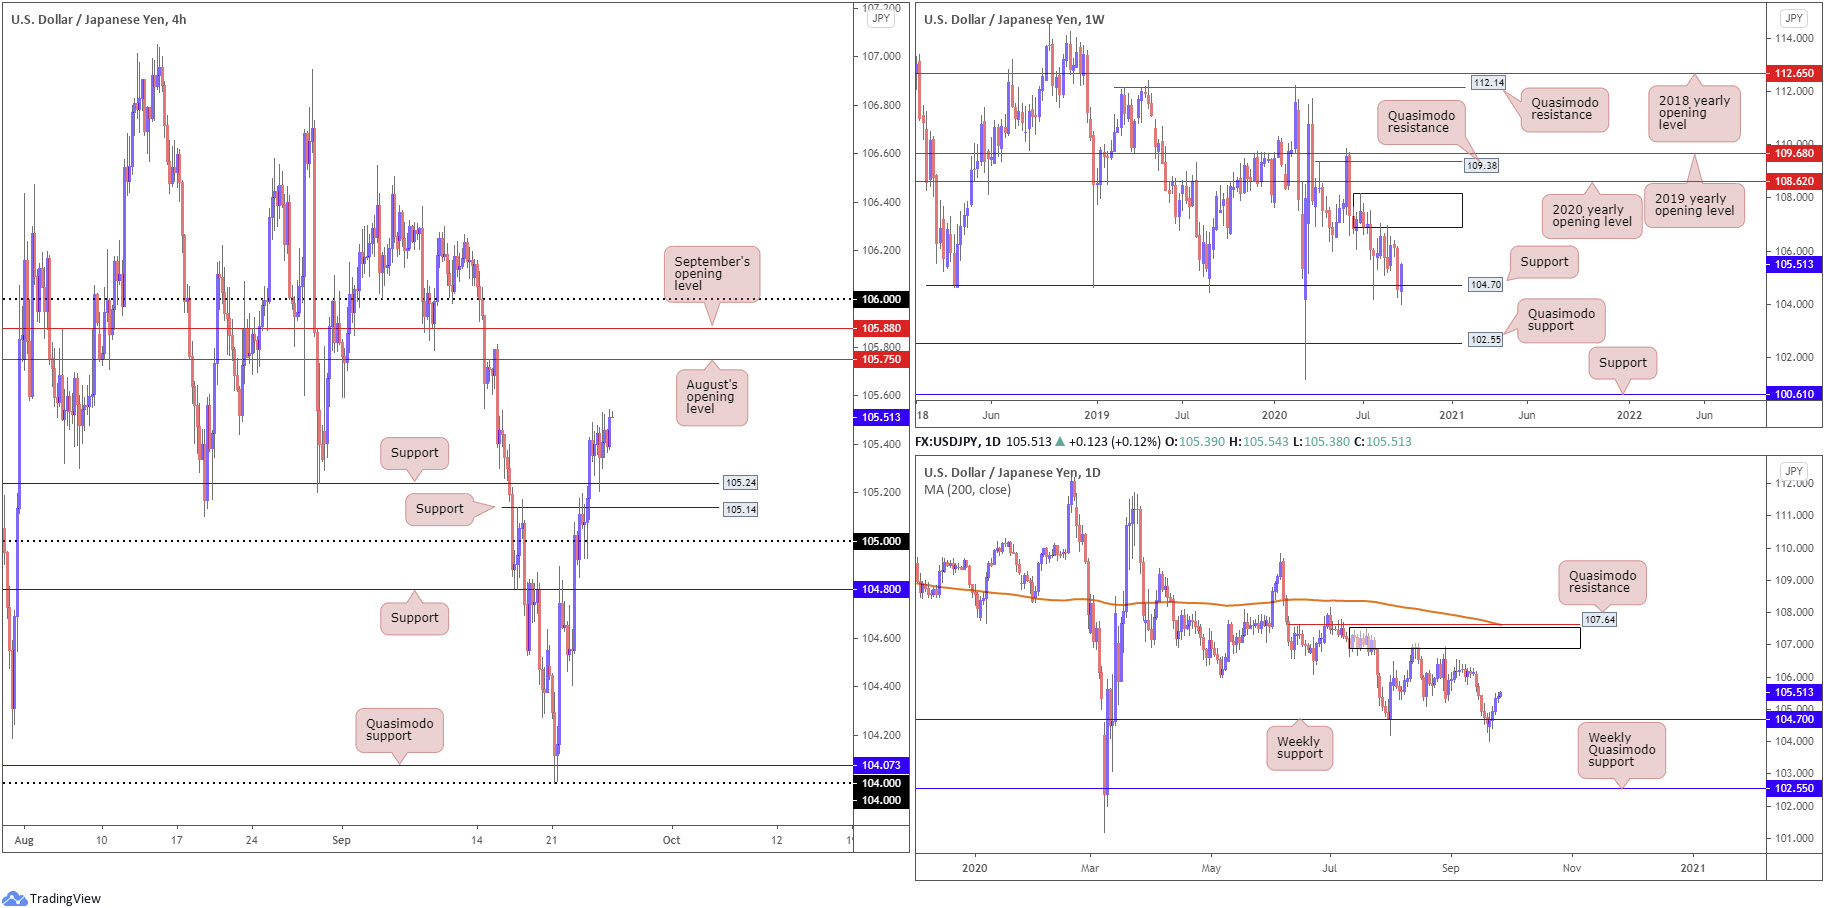
Upward momentum on USD/JPY displayed signs of weakening Thursday. Although managing to form fresh peaks at 105.53 and close higher for a fourth consecutive session, price remained somewhat stationary around the upper border of Wednesday’s range: 104.84/105.49.
For those who read Thursday’s technical briefing you may recall the piece highlighted the following (italics):
Retesting 105 on the H4, the pair, as you can see, latched onto fresh bids above Quasimodo resistance at 105.14 and resistance plotted at 105.24. This, from a technical standpoint, has perhaps cleared the river north until August’s opening value at 105.75 and September’s opening value at 105.88.
From the higher timeframes, we can see the unit regained footing above weekly support at 104.70.
Interestingly, Thursday retested 105.24 on the H4 and held firm, sponsoring bullish themes.
Areas of consideration:
Those long the 105.24 retest (a noted move to watch for in recent analysis) are likely looking for the currency pair to reach for August’s opening value at 105.75, with a break throwing September’s opening value at 105.88 and the 106 handle into the mix.
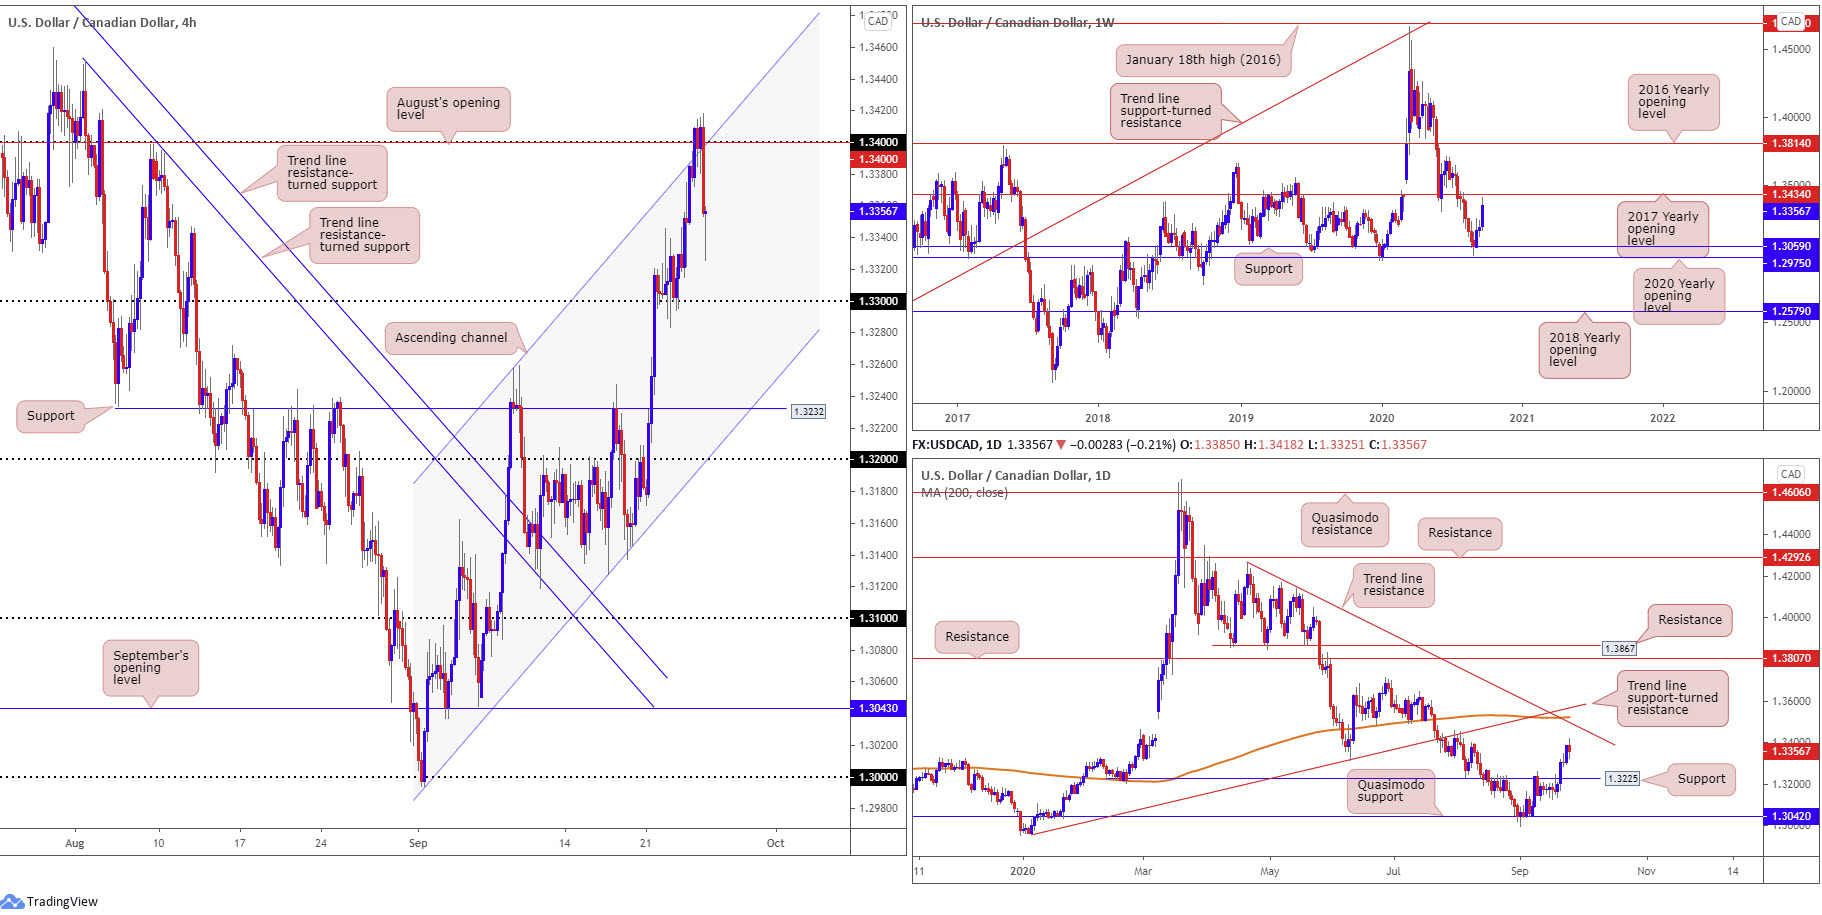
USD/CAD:
Early hours Thursday observed USD/CAD shake hands with the 1.34 handle and August’s opening value, two levels that merge closely with channel resistance, taken from the high 1.3257. As the pair transitioned into the US session, however, buyers stepped aside and the pair aggressively pushed lower, fuelled on the back of the DXY fading session peaks at 94.59 and WTI prices exploring ground above $40.00 a barrel.
Interestingly, weekly price left the 2017 yearly opening value at 1.3434 (resistance) unchallenged yesterday. On the daily timeframe, resistance is not expected to make an appearance until trend line resistance, etched from the high 1.4265, which happens to align closely with the 200-day SMA (orange – 1.3522). Also in close view is trend line support-turned resistance, taken from the low 1.2957.
Technically on the H4 timeframe, support is seen around the 1.33ish region, followed by channel support, etched from the low 1.2994.
Areas of consideration:
While sellers came in strong from the 1.34 neighbourhood yesterday, buyers remain firmly in the fight, according to the higher timeframes. Weekly price shows room for buyers to test 1.3434, while daily action could stretch as far north as the 1.35ish region.
Should H4 retest 1.33, therefore, bullish scenarios could be on the cards. Also, a break of 1.34 may invite intraday breakout strategies to the stage, targeting weekly resistance at 1.3434 as the initial point.
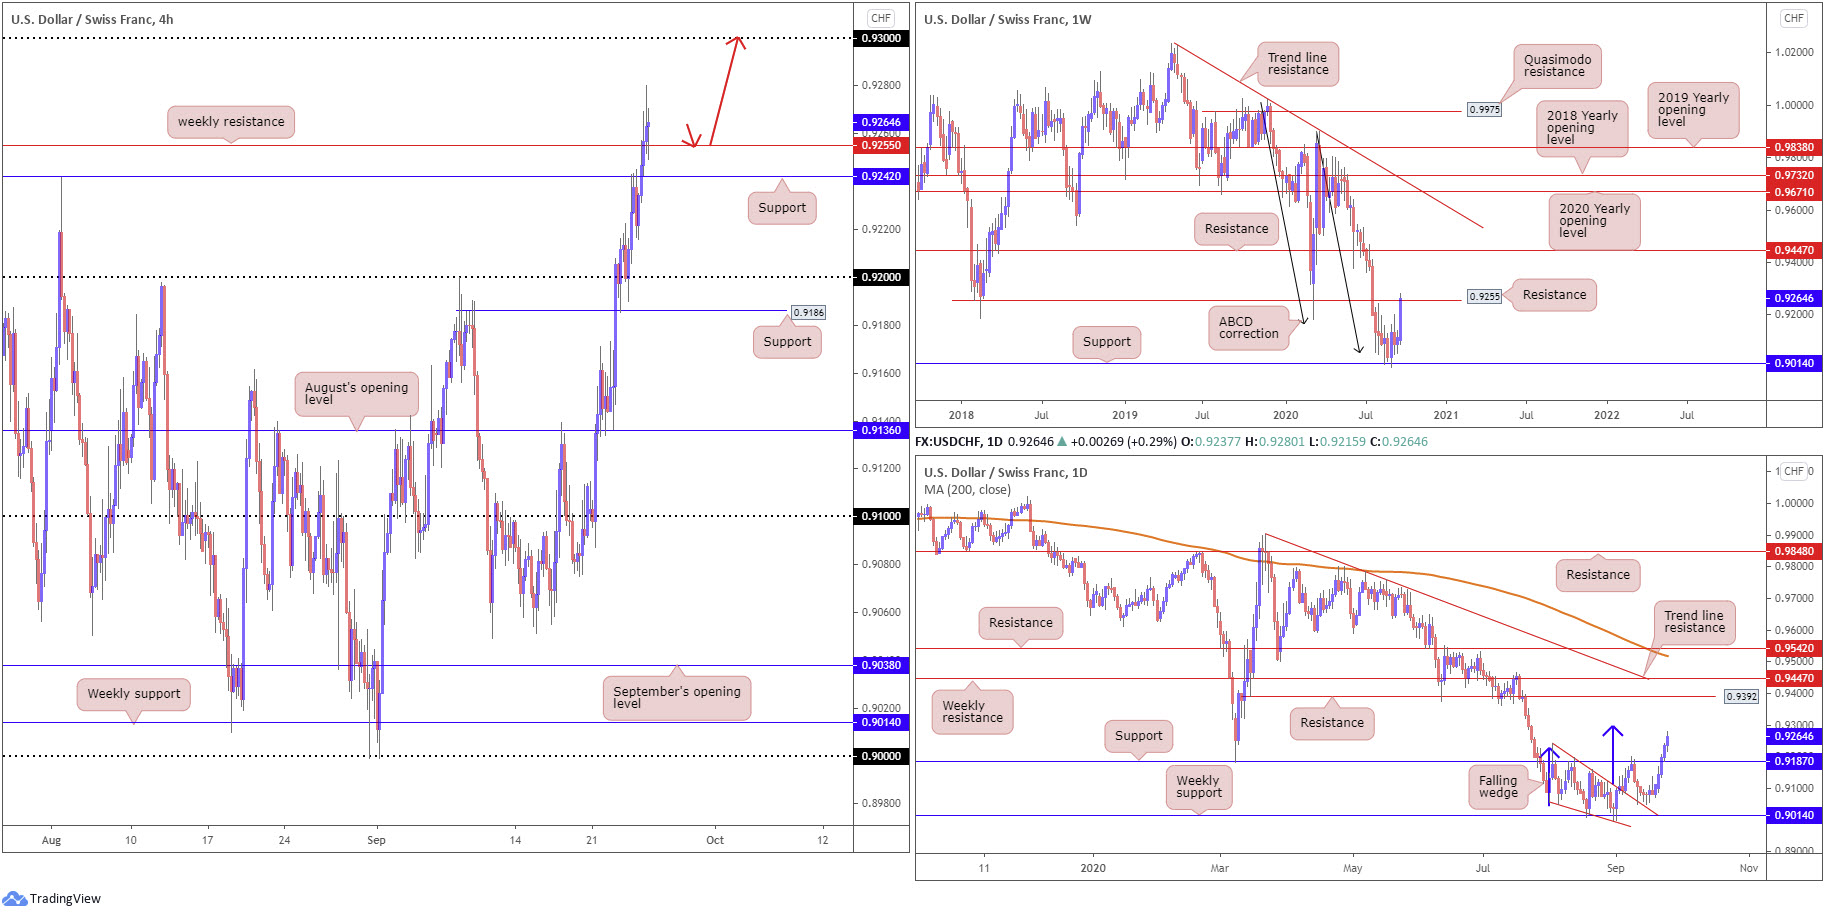
USD/CHF:
Upside pressure remained unabated Thursday, as the Swiss franc struggled to find a footing in wake of the SNB’s quarterly policy review that sprung no surprises. With the DXY clocking fresh weekly peaks at 94.59, USD/CHF ran through resistance at 0.9242 on the H4 timeframe and challenged weekly resistance at 0.9255. As evident from the H4 chart, price action is seen retesting the weekly level as support, with 0.93 set as the next upside target.
Movement on the weekly timeframe reveals buyers recently staged an impressive recovery off support at 0.9014, potentially gleaning additional impetus from ABCD support at 0.9051 (black arrows). Resistance mentioned above at 0.9255 (a previous Quasimodo support level) is now in play.
From the daily timeframe, the beginning of September observed the upper border of a falling wedge pattern (drawn from the high 0.9241 and a low of 0.9056) give way, consequently unlocking a bullish reversal signal. Although resistance at 0.9187 initially put a lid on gains, buyers regained consciousness after retesting the falling wedge and recently engulfed the aforementioned resistance level. Breaking through weekly resistance at 0.9255 is likely to guide the currency pair towards the daily falling wedge take-profit target (blue arrows) at 0.9297.
Areas of consideration:
Some traders will interpret H4 action retesting weekly resistance at 0.9255 (as support) as a sign we might be heading for higher terrain, and look to secure bullish positions off the weekly base. As noted above, the next upside target beyond the weekly resistance level is the daily falling wedge take-profit target at 0.9297, conveniently aligning with the next upside target on the H4: the 0.93 handle.
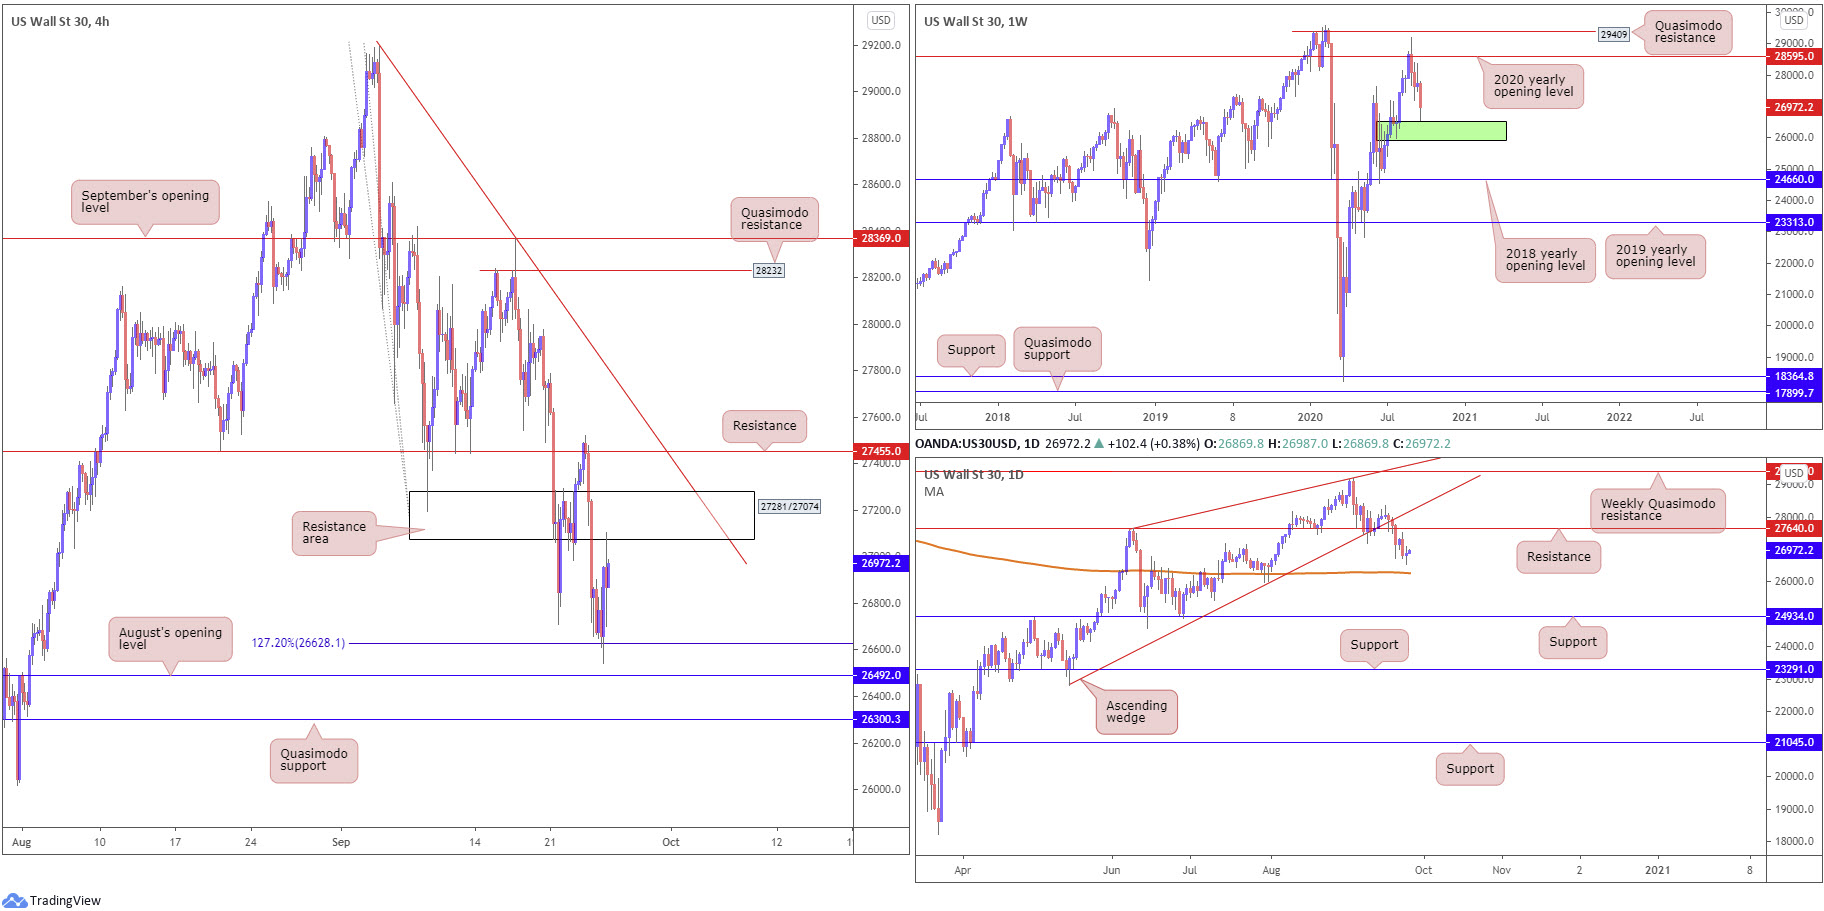
Dow Jones Industrial Average:
US equity benchmarks ended Thursday eking out modest gains amid a recovery in technology shares. The Dow Jones Industrial Average added 52.31 points, or 0.20%; the S&P 500 gained 9.67 points, or 0.30% and the Nasdaq traded higher by 39.28 points, or 0.37%.
The technical landscape on the weekly timeframe reveals price movement recently spiked to within touching distance of demand (green) at 25916-26523, an area active buyers may try and defend. This follows a recent attempt to overrun the 2020 yearly opening value at 28595 (sited just under Quasimodo resistance at 29409).
Trading on the daily timeframe recently elbowed through an ascending wedge, taken from the low 22803, and support from 27640 (now a serving resistance). This perhaps sets the stage for a move to the 200-day SMA (orange – 26269), followed by a possible run to support priced in at 24934.
H4 resistance at 27455 side-lined hopes of additional recovery gains on Wednesday, as price aggressively turned to lower levels. Engulfing Monday’s low at 26708, Thursday crossed swords with a 127.2% Fibonacci extension point at 26628, which, as you can see, held firm and motivated a mild recovery play to a resistance area at 27281/27074. Traders will acknowledge August’s opening value at 26492 is situated just south of the current Fib. Additional downside seen through the aforementioned support levels points to an approach towards Quasimodo support at 26300.
Areas of consideration:
The weekly and daily timeframes suggest additional losses until weekly demand at 25916-26523 makes an appearance.
While the 127.2% Fibonacci extension point at 26628 welcomed buyers on the H4 yesterday, the H4 resistance area priced in at 27281/27074 could prove troublesome.
Therefore, renewed selling may materialise today, targeting August’s opening value at 26492. This level could encourage buying, given the base residing within weekly demand at 25916-26523. H4 Quasimodo support at 26300 is equally likely to entice buyers should we reach this low, due to the 200-day SMA merging closely with the level (and also being positioned within the aforementioned weekly demand).
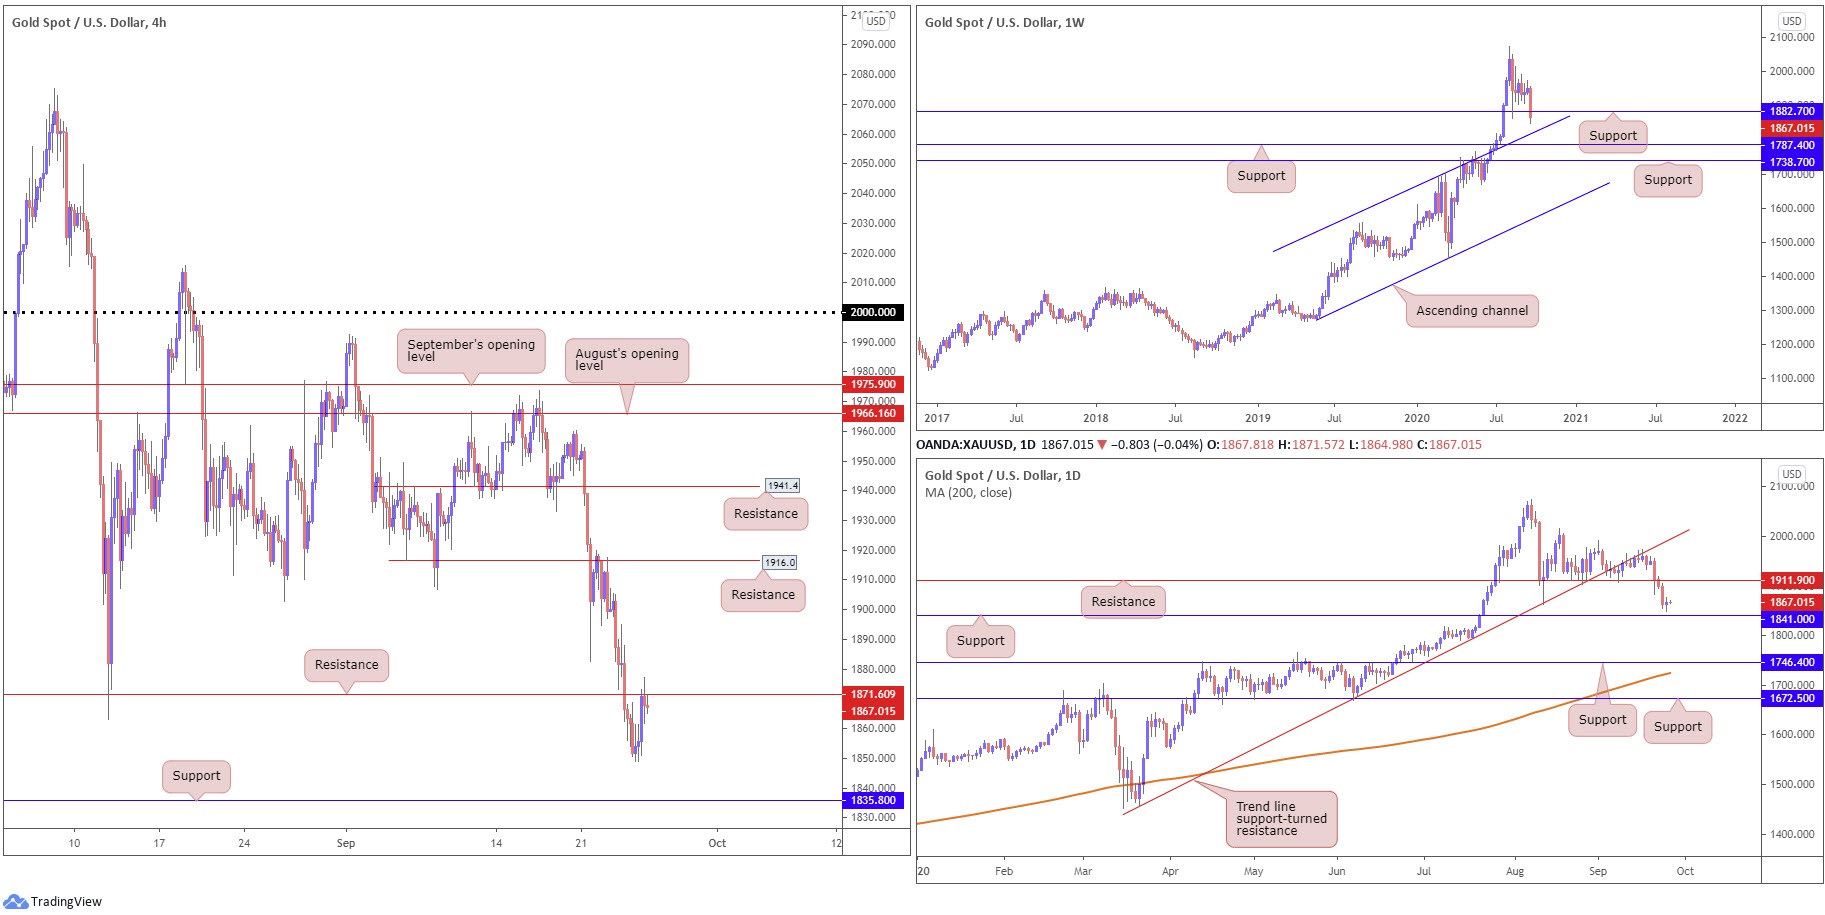
XAU/USD (GOLD):
H4 support at $1,871 was taken out on Wednesday, consequently directing the technical radar to support at $1,835 and unlocking the possibility of $1,871 establishing resistance, which, as you can see, is what occurred in recent hours.
From the weekly timeframe, technical structure remains unchanged since Thursday:
Weekly support at $1,882 recently made its way back into the spotlight and is currently under pressure, with gold trading lower by nearly 4.5% on the week. Should sellers strengthen their grip, channel resistance-turned support, etched from the high $1,703, might enter view.
Support from $1,911 was recently engulfed (now serving as resistance) on the daily timeframe, following last week’s action gripping trend line support-turned resistance, taken from the low $1,455. Despite Thursday’s mild recovery attempt, which snapped a three-day bearish phase, focus remains on nearby support at $1,841.
Areas of consideration:
As aired in Thursday’s technical briefing, sellers appear to have the advantage until connecting with daily support at $1,841, closely shadowed by H4 support at $1,835 and then the weekly channel support (around $1,825ish).
$1,871 recently retested as resistance on the H4, therefore, could unearth bearish scenarios today, targeting supports underlined above in bold.
The accuracy, completeness and timeliness of the information contained on this site cannot be guaranteed. IC Markets does not warranty, guarantee or make any representations, or assume any liability regarding financial results based on the use of the information in the site.
News, views, opinions, recommendations and other information obtained from sources outside of www.icmarkets.com.au, used in this site are believed to be reliable, but we cannot guarantee their accuracy or completeness. All such information is subject to change at any time without notice. IC Markets assumes no responsibility for the content of any linked site.
The fact that such links may exist does not indicate approval or endorsement of any material contained on any linked site. IC Markets is not liable for any harm caused by the transmission, through accessing the services or information on this site, of a computer virus, or other computer code or programming device that might be used to access, delete, damage, disable, disrupt or otherwise impede in any manner, the operation of the site or of any user’s software, hardware, data or property.


