Lower timeframe confirmation: is something we use a lot in our analysis. All it simply means is waiting for price action on the lower timeframes to confirm direction within a higher timeframe area. For example, some traders will not enter a trade until an opposing supply or demand area has been consumed, while on the other hand, another group of traders may only need a trendline break to confirm direction. As you can probably imagine, the list is endless. We, however, personally prefer to use the two methods of confirmation mentioned above in our trading.
EURUSD:
The EUR/USD pair, as you can see, did indeed continue to rally during yesterday’s sessions. This saw price burst through the 4hr swap level at 1.0854, and connect up with a 4hr supply zone coming in at 1.1034-1.1000. For those who read our previous report on the Euro (http://www.icmarkets.com/blog/thursday-23rd-july-daily-technical-outlook-and-review/) you may recall that we had a long position live in the market from 1.0858 (this has now been liquidated at 1.0995 for a very nice 1:3 risk/reward).
Following this, we went on to explain that should price should reach 1.1000, we would then begin looking for confirmed sells into this market since it converged beautifully with the following structures:
- 4hr supply mentioned above at 1.1034-1.1000.
- Minor 4hr Harmonic AB=CD bearish pattern which completes at 1.1014 within the aforementioned 4hr supply.
- Positioned within a daily supply area coming in at 1.1083-1.1006.
- 50.0% Fibonacci resistance taken from the high 1.1214 to the low 1.0807.
A few hours after closing our long trade, we found a confirmed short on the 15 minute timeframe at 1.10013 off of the back of a very subtle Quasimodo resistance level going into yesterday’s London afternoon session, which, at the time of writing, is just sitting in the green. We have to be honest here though; we’re a little concerned about the 4hr swap level below at 1.0964, as support is being seen from this region. Essentially, for us to feel confident here, we’ll need to see this barrier taken out, where at which point, we’ll look to target 1.0900 which converges with the 50.0% Fibonacci retracement (circled in pink) of swings A-D (minor bearish AB=CD pattern) to end the week.
For anyone else currently short with us, we must be clear here guys that we remain prepared to close this short should bullish support continue to hold as let’s not forget that we have effectively sold into potential weekly buyers from demand at 1.0519-1.0798.

Levels to watch/live orders:
- Buys: Flat (Stop loss: N/A).
- Sells: 1.10013 [Live] (Stop loss: 1.1040).
GBP/USD:
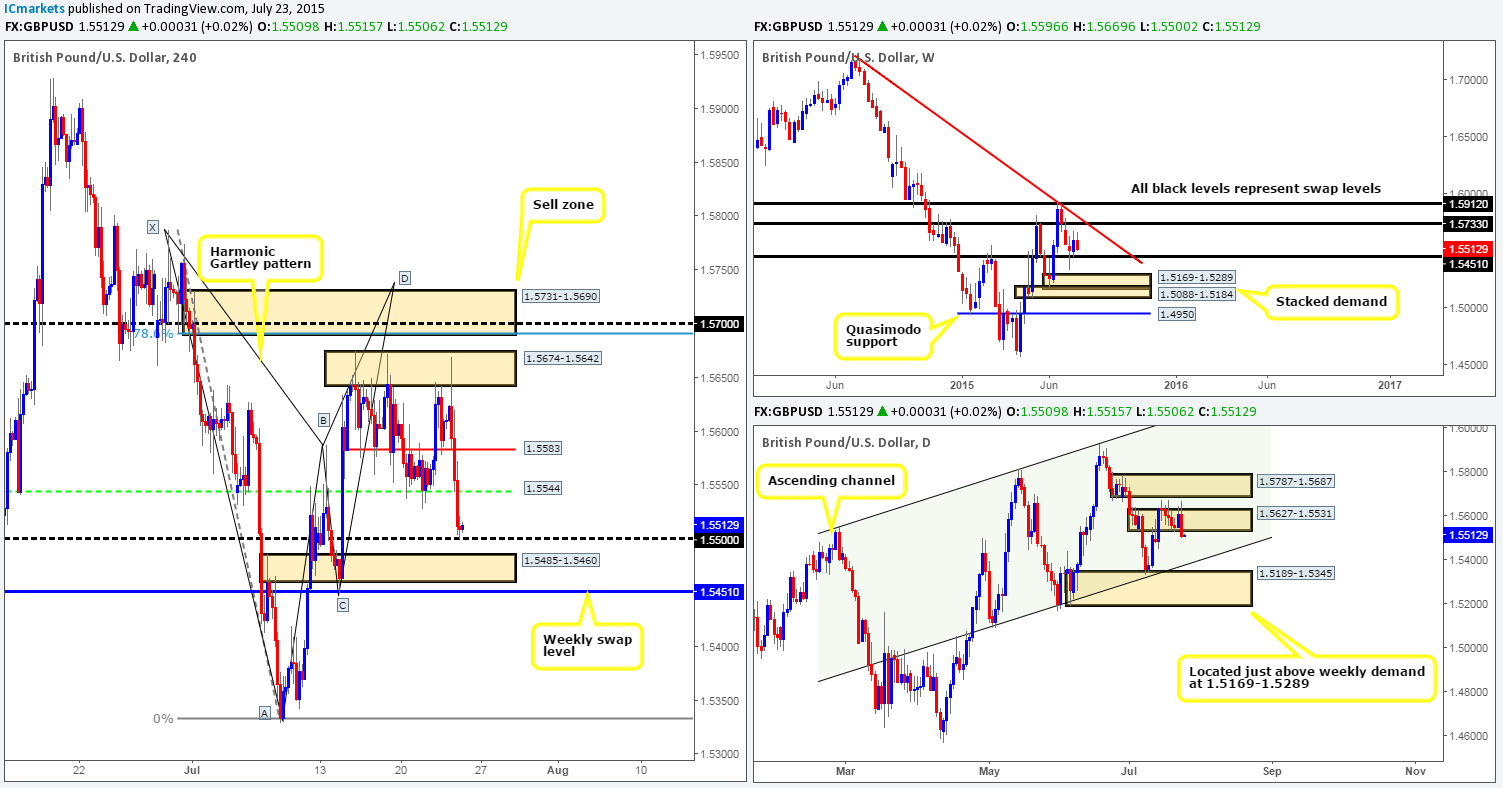
Yesterday’s action shows Cable took a turn for the worst due to a heavy wave of offers coming into the market from a clear base of 4hr resistance at 1.5674-1.5642. This, as you can see, took out both 1.5583 and 1.5544 with little trouble, consequently driving into round-number support at 1.5500.
From the bigger picture, however, we can see that consequent to the recent movements; price has formed a bearish engulfing candle on the daily timeframe, while on the weekly timeframe price is also now very nearly crossing swords with a weekly swap level coming in at 1.5451.
With relatively steep support being seen below current price at the moment (1.5500/1.5485-1.5460/1.5451), and also potentially problematic 4hr resistance seen overhead (1.5544/1.5583), it could prove a very frustrating feat to try and trade this market today. Therefore, until more conducive price action presents itself, remaining flat may be the best path to take today.
Levels to watch/ live orders:
- Buys: Flat (Stop loss: N/A).
- Sells: Flat (Stop loss: N/A).
AUD/USD:
From the AUD/USD’s recent movement, it is clear to see that a 4hr consolidation area is currently being chiseled out between 0.7436/0.7348 at the moment.
Focusing only on the daily timeframe (as the weekly timeframe shows pretty much the same as the daily) today, we can see that price is currently sandwiched in between a daily swap area at 0.7449-0.7598 and a daily swap level coming in at 0.7326. However, price is, as you can see, drawing nearer to the daily swap (support) level as we speak (top-side limit of weekly demand at 0.6951-0.7326).
Given the points made above, our team has absolutely no interest in shorting this market even though price has sunk lower for nearly five straight weeks now! As such, our prime focus for today will be on looking for a confirmed intraday long off of the 4hr range lower limit 0.7348. Should we manage to spot an entry here, we’ll aim to target yesterday’s high 0.7416, and maybe, dependent on the time of day, the upper limit of the 4hr range, 0.7436.

Levels to watch/ live orders:
- Buys: 0.7348 [Tentative – confirmation required] (Stop loss: dependent on where one confirms this level).
- Sells: Flat (Stop loss: N/A).
USD/JPY:
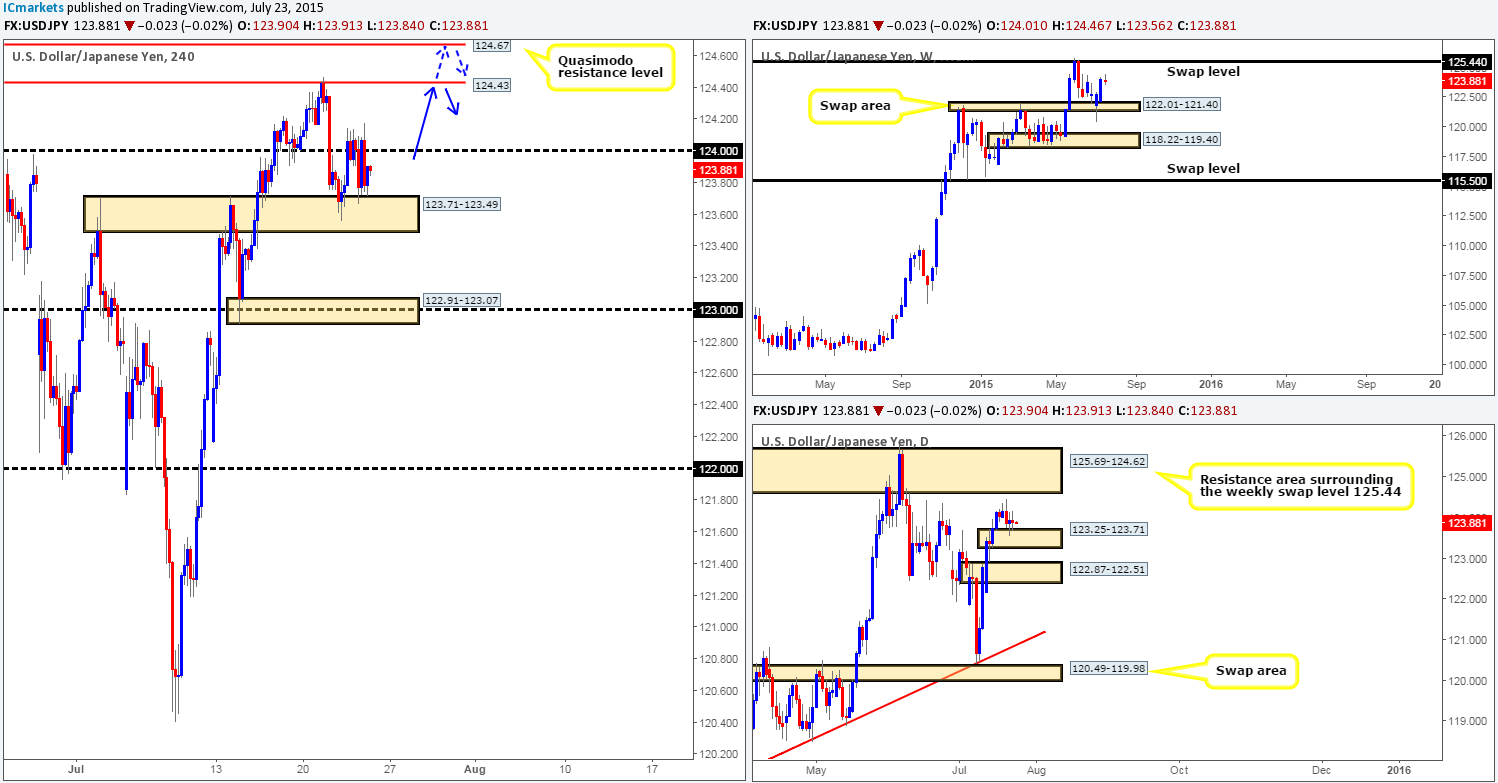
The USD/JPY pair spent much of yesterday’s sessions ping-ponging between round-number resistance at 124.00 and a 4hr swap area coming in at 123.71-123.49. The majority of offers at 124.00 have very likely been chewed through now, thus opening up the trap door for price to challenge either the 4hr resistance level 124.43, or the 4hr Quasimodo resistance level at 124.67 (positioned just within a daily resistance zone at 125.69-124.62).
In addition to this, The weekly chart shows price is ‘resistance free’ so to speak up to a weekly swap level coming in at 125.44, while the daily timeframe shows price is currently trading off of a small daily demand area at 123.25-123.71, which also shows room for price to move higher until we reach a daily resistance area at 125.69-124.62.
Therefore, much the same as yesterday’s report, we remain confident that 124.00 will be broken today and price will likely shoot higher to connect with the either of the aforementioned 4hr resistance levels mentioned above. In our opinion, both of these levels are viable shorting zones, but seeing as it is nearly impossible to tell which one will see the sweetest reaction, we’re going to wait for the lower timeframes to confirm strength is present before considering shorts.
Levels to watch/ live orders:
- Buys: Flat (Stop loss: N/A).
- Sells: 124.43 [Tentative – confirmation required] (Stop loss: dependent on where one confirms this level) 124.67 [Tentative – confirmation required] (Stop loss: dependent on where one confirms this level).
USD/CAD:
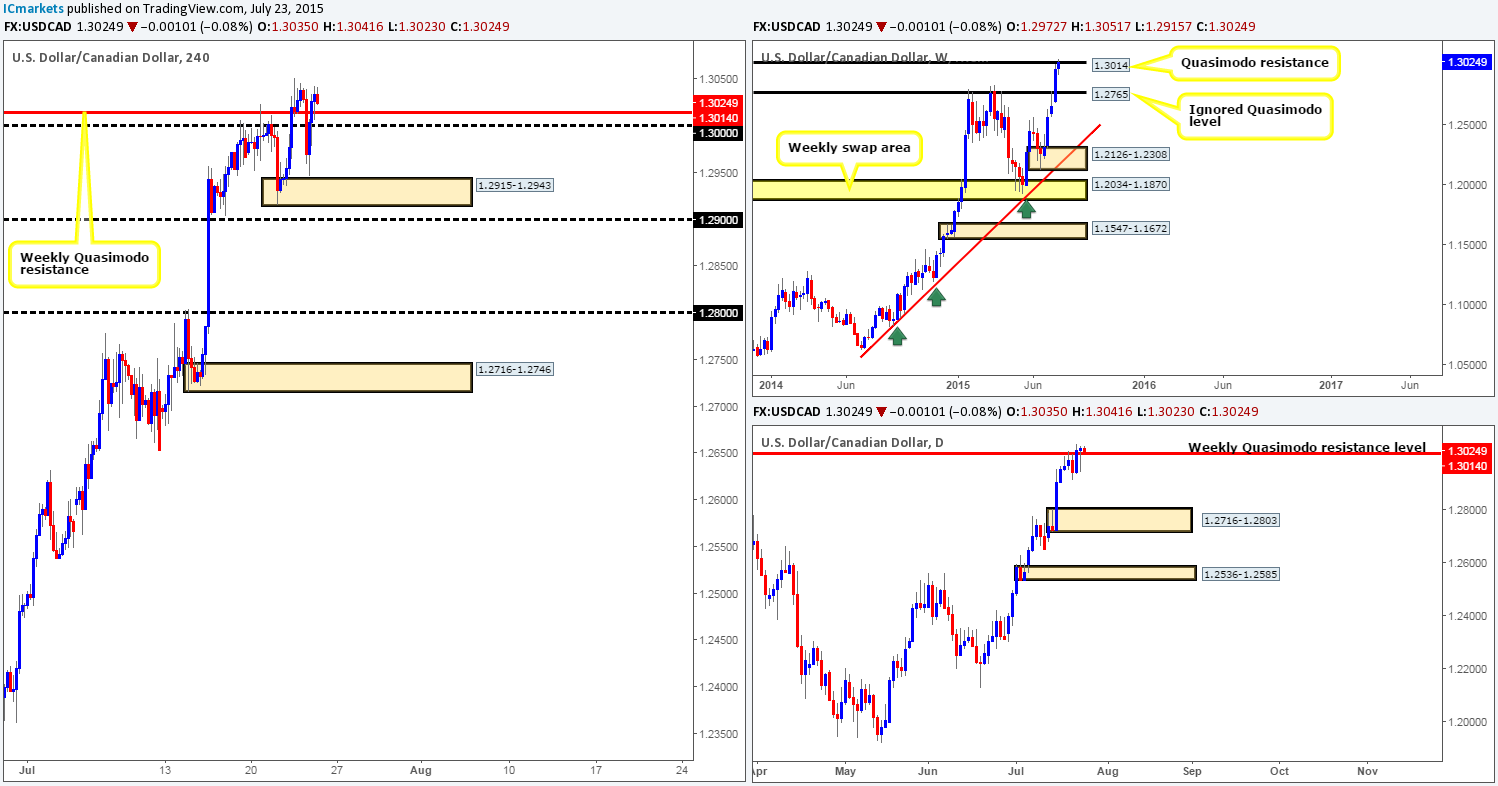
Using a top-down approach this morning, we can see that price is still trading just above the long-term weekly Quasimodo resistance level at 1.3014. However, as we mentioned in yesterday’s analysis, it is very difficult (especially from this timeframe alone) to discount this level until the weekly candle closes. Scanning lower down, the daily timeframe shows that price printed a bullish pin-bar candle going into yesterday’s close 1.3035 around the aforementioned long-term weekly Quasimodo resistance level. We would usually say this likely confirms that the weekly level is failing, but seeing as though price drove so deep (selling pressure still present) below the weekly barrier before closing positively, we still remain unsure here.
Technically, the 4hr timeframe has not seen much change from the prior day’s close 1.3028. What we did see from this angle, however, was that there is clear demand sitting around the 4hr demand area at 1.2915-1.2943. Price never even touched the base and still saw an aggressive push higher, this, at least to us, indicates strong demand is present here.
Seeing as though we are unsure on both the weekly and daily timeframe structures at the moment, and the fact that today is the last trading day of the week, we’ve decided to remain flat until the week closes out.
Levels to watch/ live orders:
- Buys: Flat (Stop loss: N/A).
- Sells: Flat (Stop loss: N/A).
USD/CHF:
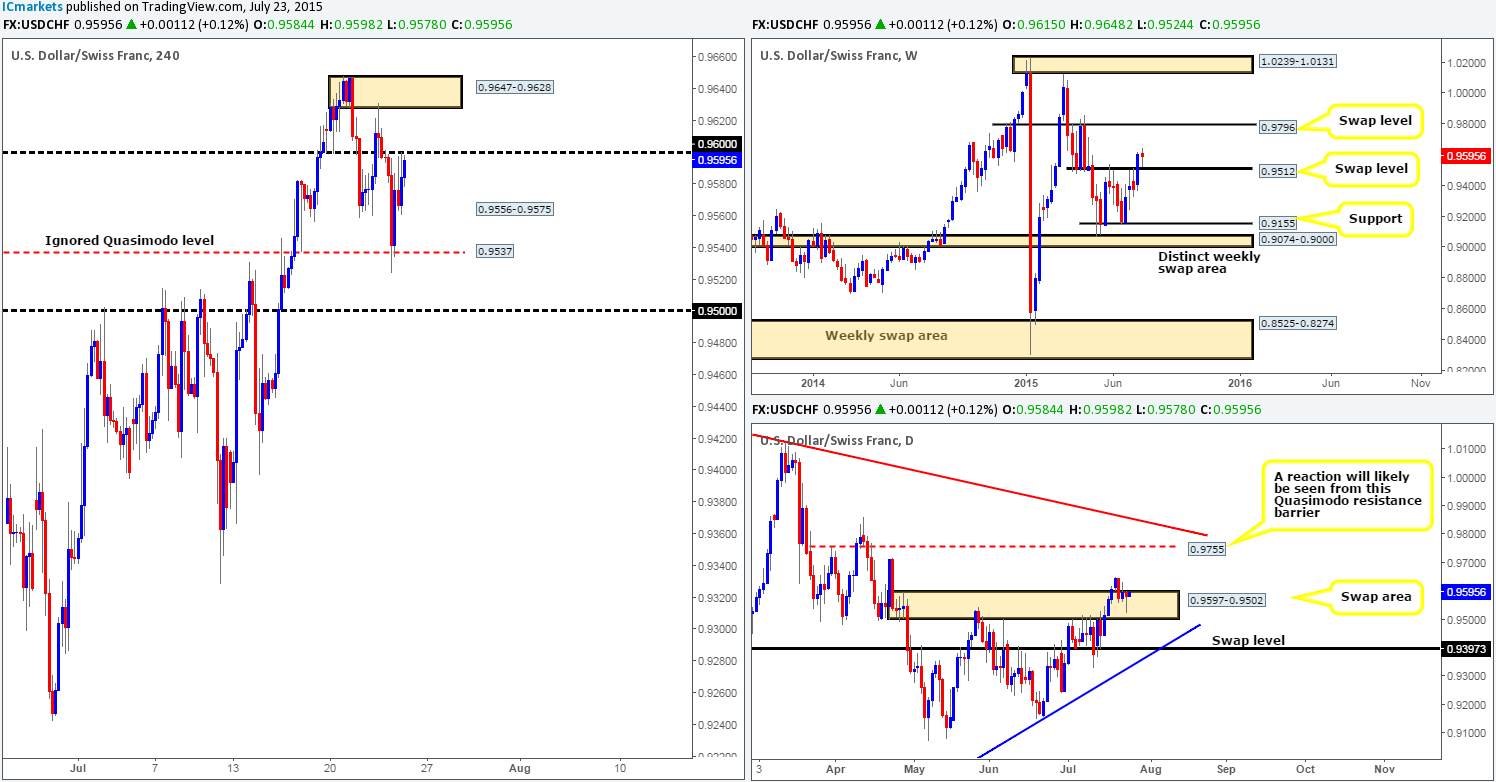
The rebound seen from 4hr supply at 0.9647-0.9628 saw price extended lower yesterday. This move consequently pushed price into the jaws of an ignored 4hr Quasimodo level coming in at 0.9537, which, as you can see, was clearly enough to support a counter-attack back up to the round number 0.9600.
This recent movement saw price come very close to connecting with a weekly swap (support) level at 0.9512 – just missing it by a mere twelve pips. What is more, the daily timeframe printed a daily bullish pin-bar candle within a daily swap (demand) area coming in at 0.9597-0.9502. Despite the positive vibe we’re receiving from the higher timeframes at the moment, we still cannot justify buying into potential round-number resistance at 0.9600. However, should this level be violated today, we may consider taking a long position if price retests this level as support (waiting for lower timeframe confirmation is advised), since price likely took out a major section of offers around the 4hr supply sitting above at 0.9647-0.9628 on Wednesday at 0.9631, thus indicating the path north may potentially be free for further upside (as we’re seeing on the higher timeframe picture currently).
Levels to watch/ live orders:
- Buys: Watch for 0.9600 to be consumed and then look to enter long on any retest seen (confirmation required).
- Sells: Flat (Stop loss: N/A).
DOW 30:
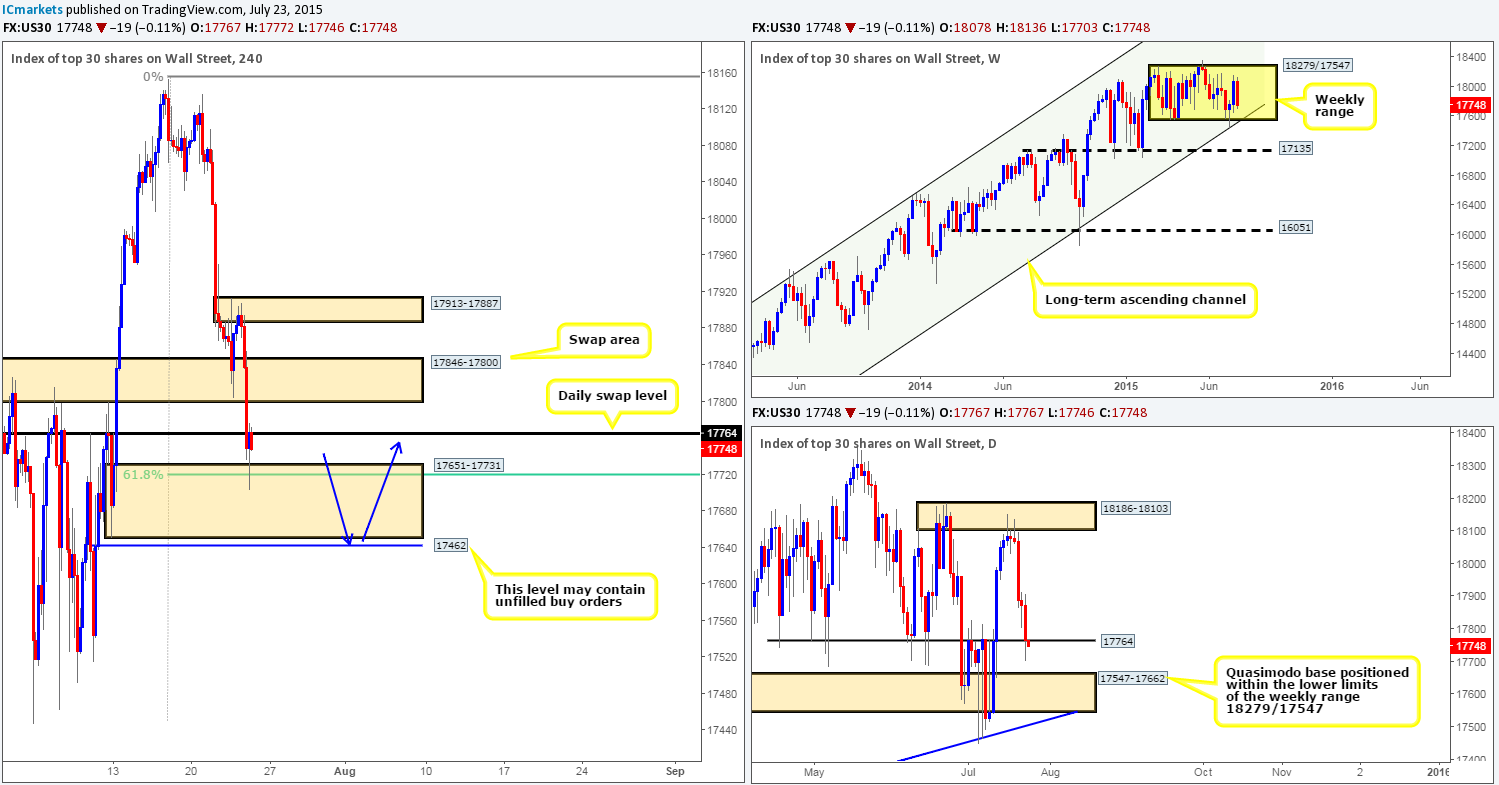
Following a brief rebound seen from the 4hr swap area at 17846-17800, the DOW fell sharply yesterday taking out both this 4hr swap barrier and also the daily swap level coming in at 17764. It was only once price shook hands with a 4hr demand area at 17651-17731 (converges with the 61.8% Fibonacci retracement number) did we see this market begin to stabilize.
With resistive pressure currently being seen at the underside of the aforementioned daily swap level at the moment, and the aforementioned 4hr swap (resistance) area lurking just above it, buying this market today is certainly out of the question for us, unless price gets down to 17462, as we feel there are likely unfilled buy orders still sitting here. The reason for why comes from seeing price initially stab north to17968 on the 09/07/2015, which was then followed by a quick retrace, only to just as quickly shoot north, thus there may have been a struggle to fill all the buy orders before price rallied, so do keep an eye on this hurdle today.
In closing, even though 17462 is situated beautifully within the daily Quasimodo support base at 17547-17662, lower timeframe buying confirmation will need to be seen here for us to commit to a long position, since we could still effectively fake lower to connect with the lower limits of the weekly range (17547), which converges nicely with the ascending weekly channel (low: 10402 high: 13287).
Levels to watch/ live orders:
- Buys: 17462 [Tentative – confirmation required] (Stop loss: dependent on where one confirms this level).
- Sells: Flat (Stop loss: N/A).
XAU/USD: (Gold)
(Slightly revised from the previous report)
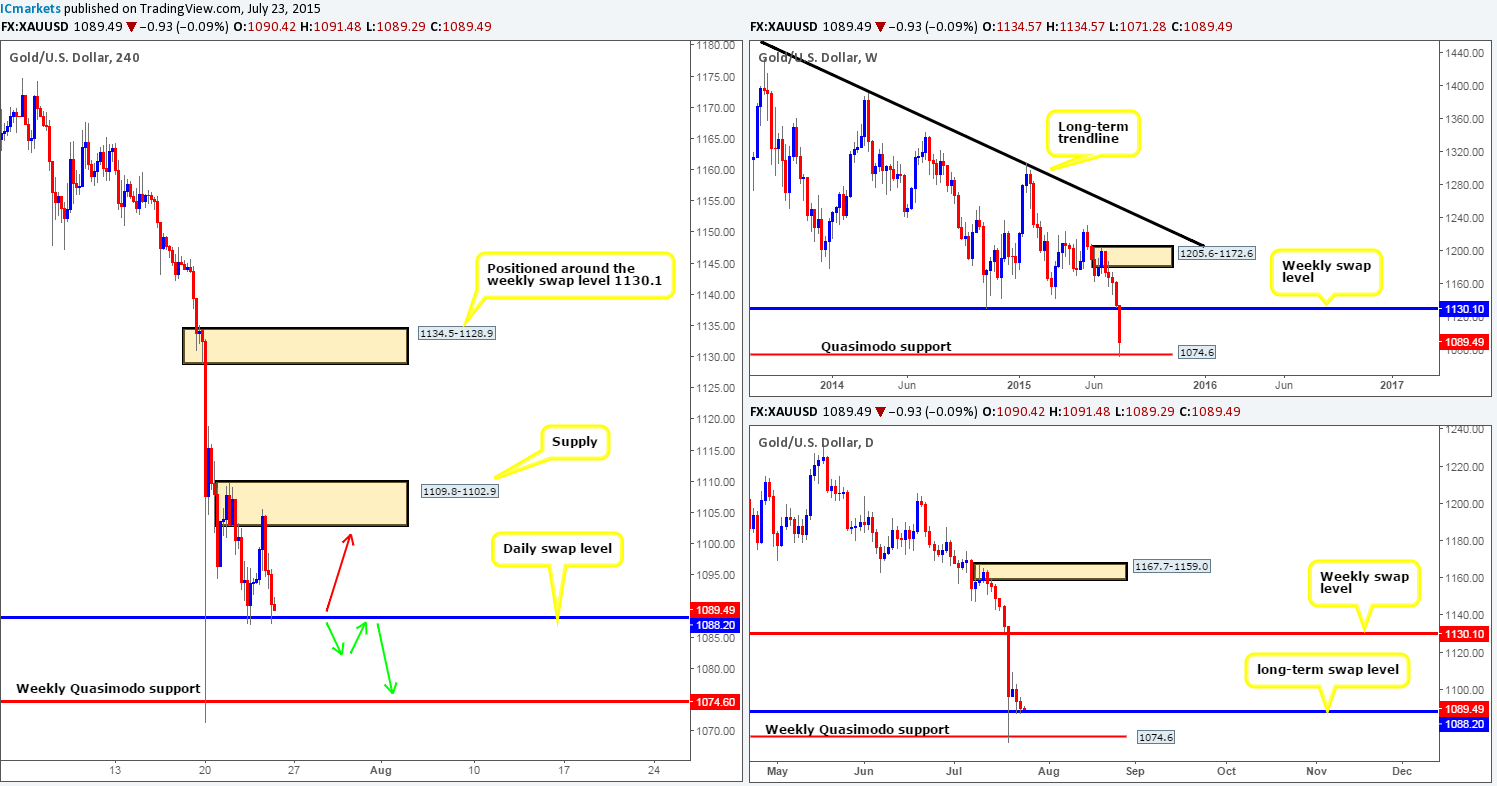
Ever since Gold aggressively rebounded off of the weekly Quasimodo support level at 1074.6 at the beginning of the week, price action drifted lower until buyers came in and defended the daily swap level at 1088.2 on Wednesday. However, as you can see, the buying was relatively short-lived as offers around 4hr supply at 1109.8-1102.9 was able to send this market back down to the aforementioned daily swap level.
Given the points made above, this is what we have logged so far for today’s upcoming action:
- Given Wednesday’s relatively aggressive reaction seen off of the daily swap level at 1088.2, we could, if lower timeframe price action was agreeable, look to take an intraday long position from 1088.2 today, targeting the aforementioned 4hr supply area as per the red arrow.
- If 1088.2 were to give way today, however, a potential short opportunity may present itself if price were to retest 1088.2 as resistance and show some sort of lower timeframe selling confirmation. Should this play out, we’d personally look to target 1074.6 to end the week.
Levels to watch/ live orders:
- Buys: 1088.2 [Tentative – confirmation required] (Stop loss: dependent on where one confirms this level).
- Sells: Watch for 1088.2 to be consumed and then look to enter long on any retest seen (confirmation required).