
EUR/USD:
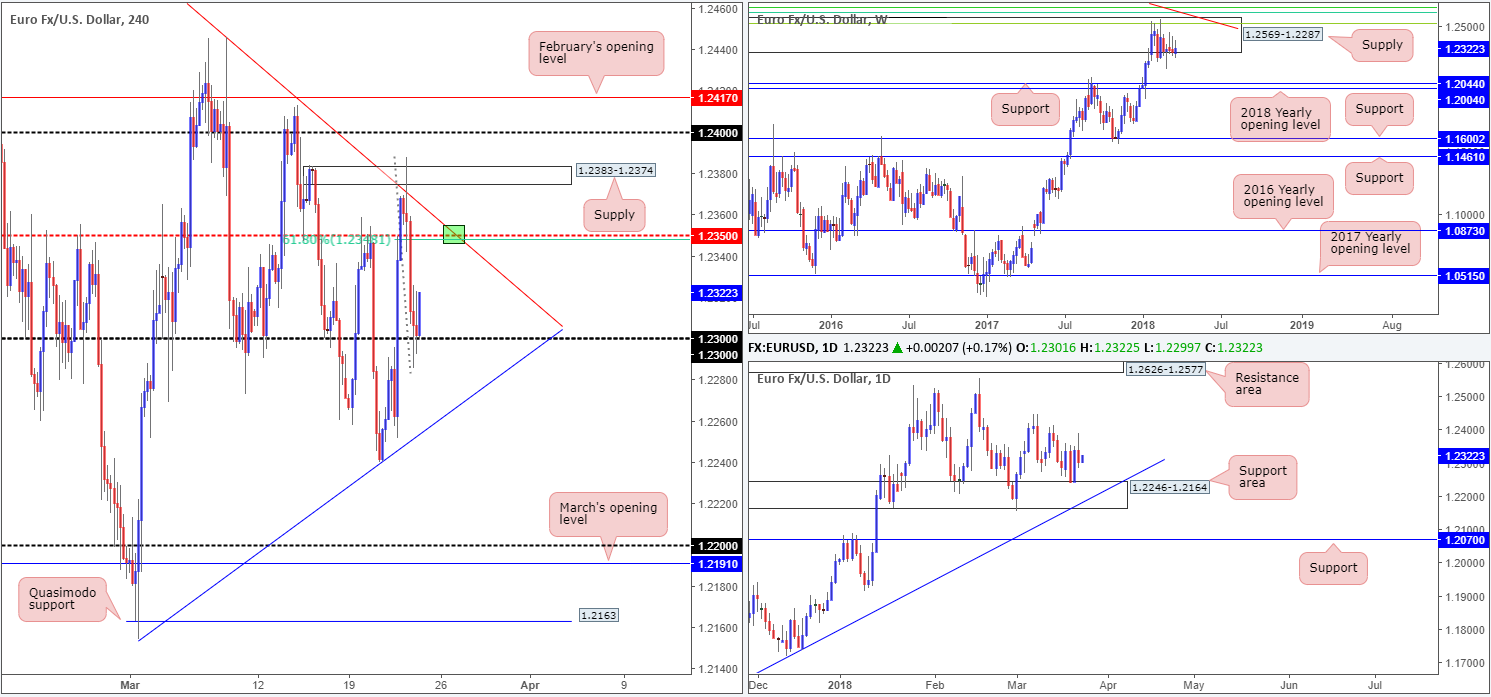
The shared currency entered into a phase of selling on Thursday after marginally whipsawing through a H4 trendline resistance extended from the high 1.2555, as well as a H4 supply base coming in at 1.2383-1.2374. Influenced by a round of USD buying and less-than-stellar Eurozone manufacturing PMIs, this prompted the H4 candles to navigate the 1.23 band.
Branching over to the weekly timeframe, we can see that the current candle is on track to print its third consecutive weekly selling wick within the walls of a major-league weekly supply zone at 1.2569-1.2287. Meanwhile, though, traders may have also noticed that daily action is seen hovering just north of a familiar daily support area at 1.2246-1.2164, which, as you can see, has been in play since mid-January.
Potential trading zones:
Despite weekly price threatening lower prices, the 1.23 handle seen on the H4 timeframe is holding ground. However, with the top edge of the daily support area at 1.2246 and a clear H4 trendline support (taken from the low 1.2154) seen below – we feel 1.23 may eventually give way as we move into European hours today.
Ultimately, the only area that really stands out to us this morning is a short off of the H4 mid-level resistance based at 1.2350 (shaded in green). Note that it intersects nicely with the aforementioned H4 trendline resistance and a 61.8% H4 Fib resistance value at 1.2348. Downside targets from this point can be seen at 1.23, followed by the H4 trendline support and then quite possibly the top edge of the daily support area mentioned above.
Data points to consider: FOMC member Bostic speaks at 12.10pm; US core durable goods orders m/m at 12.30pm GMT.
Areas worthy of attention:
Supports: 1.23; H4 trendline support; 1.2246-1.2164.
Resistances: 1.2350; H4 trendline resistance; 1.2348; 1.2383-1.2374; 1.2569-1.2287.
GBP/USD:
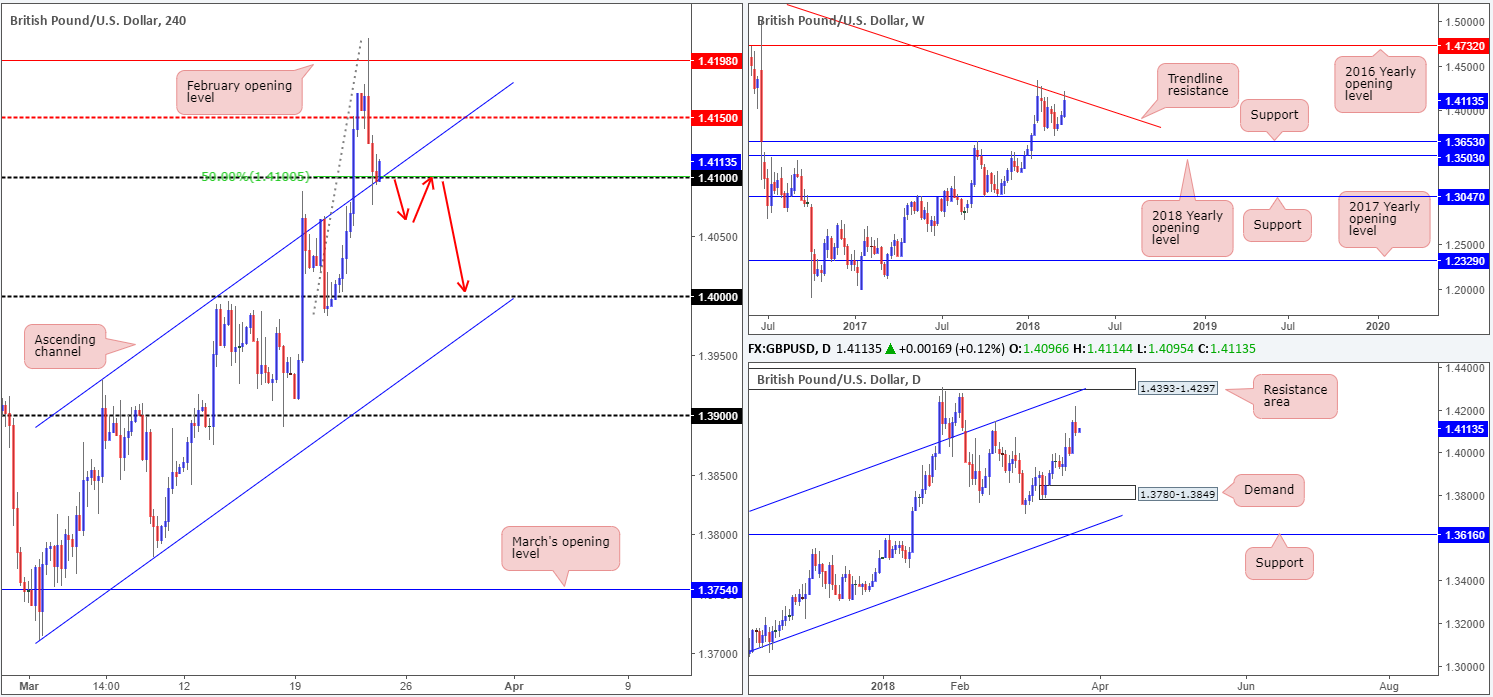
Following Thursday’s BoE’s monetary policy announcement, the British pound immediately struck a high of 1.4216, consequently whipsawing through February’s opening level seen on the H4 timeframe at 1.4198. BoE voted 7-2 (Exp. 9-0) to keep rates unchanged at 0.5%. BoE also voted 9-0 in favor of maintaining the current stock of UK government bond purchases and voted 9-0 in favor of maintaining the current stock of corporate bonds.
As you can clearly see from the H4 timeframe, though, the unit was unable to sustain its recent upside move. Technically speaking, this could have had something to do with the fact that weekly price is seen fading a long-term weekly trendline resistance taken from the high 1.5930. H4 movement chomped through H4 mid-level support at 1.4150 and shook hands with 1.41, which houses a 50.0% support value and a H4 channel resistance-turned support taken from the high 1.3929.
Potential trading zones:
Given the threat of weekly sellers entering the fray, the 1.41 handle on the H4 timeframe may eventually give way, despite its surrounding H4 confluence. A H4 close beneath this number could set the stage for a continuation move down to the key figure 1.40. Should a break come to fruition, look for the piece to retest 1.41 as resistance and hold in the shape of a full or near-full bodied H4 candle. This, in our opinion, would be enough to suggest a short, targeting 1.40 as the initial take-profit zone.
Data points to consider: MPC member Vlieghe speaks at 12.30pm; FOMC member Bostic speaks at 12.10pm; US core durable goods orders m/m at 12.30pm GMT.
Areas worthy of attention:
Supports: 1.41; H4 channel support; 1.40.
Resistances: weekly trendline resistance.
AUD/USD:
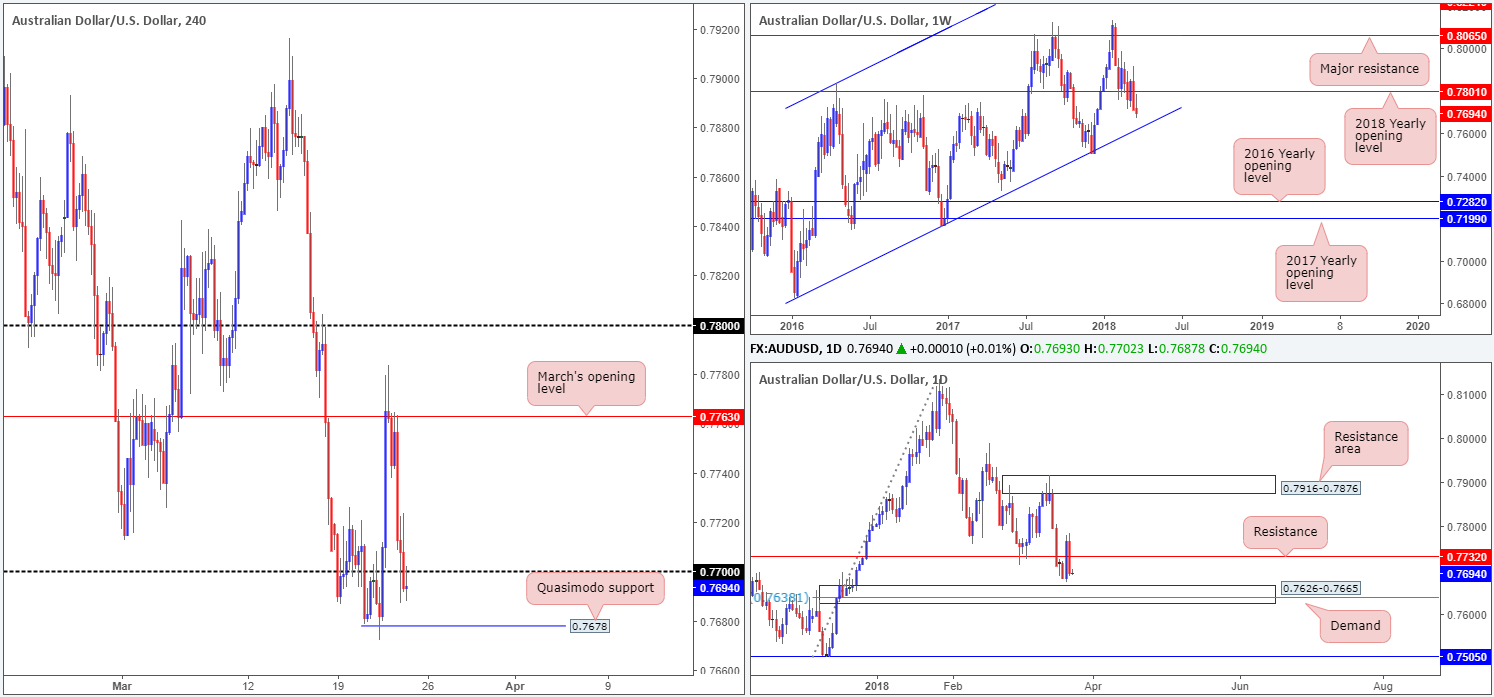
In recent trade, we can see that the commodity currency gave up almost all of Wednesday’s Fed-fuelled gains, as price waned against the USD. The move, which initially came about following a test of March’s opening level at 0.7763 on the H4 timeframe and weaker-than-expected Aussie employment data, prompted the pair to explore beneath the 0.77 handle. This, as you can see, has consequently positioned the H4 candles within striking distance of a H4 Quasimodo support at 0.7678.
The story on the weekly timeframe shows weekly price still has room to press lower. The next area of interest on this scale is seen in the form of a long-term weekly channel support extended from the low 0.6827. Looking at things a little lower on the curve, we can also see a nearby daily demand area plotted at 0.7626-0.7665, which happens to house a 78.6% Fib support value within at 0.7638.
Potential trading zones:
We really like the 78.6% Fib support mentioned above for a medium-term bounce. Not only is it positioned within a daily demand, it also intersects with the aforementioned weekly channel support! Stop-loss orders, technically speaking, would be best positioned a few pips beneath the said daily demand base, with the first medium-term take-profit target set at daily resistance pegged at 0.7732.
Data points to consider: FOMC member Bostic speaks at 12.10pm; US core durable goods orders m/m at 12.30pm GMT.
Areas worthy of attention:
Supports: 0.7678; 0.7626-0.7665; 0.7638; weekly channel support.
Resistances: 0.77; 0.7732; 0.7763.
USD/JPY:
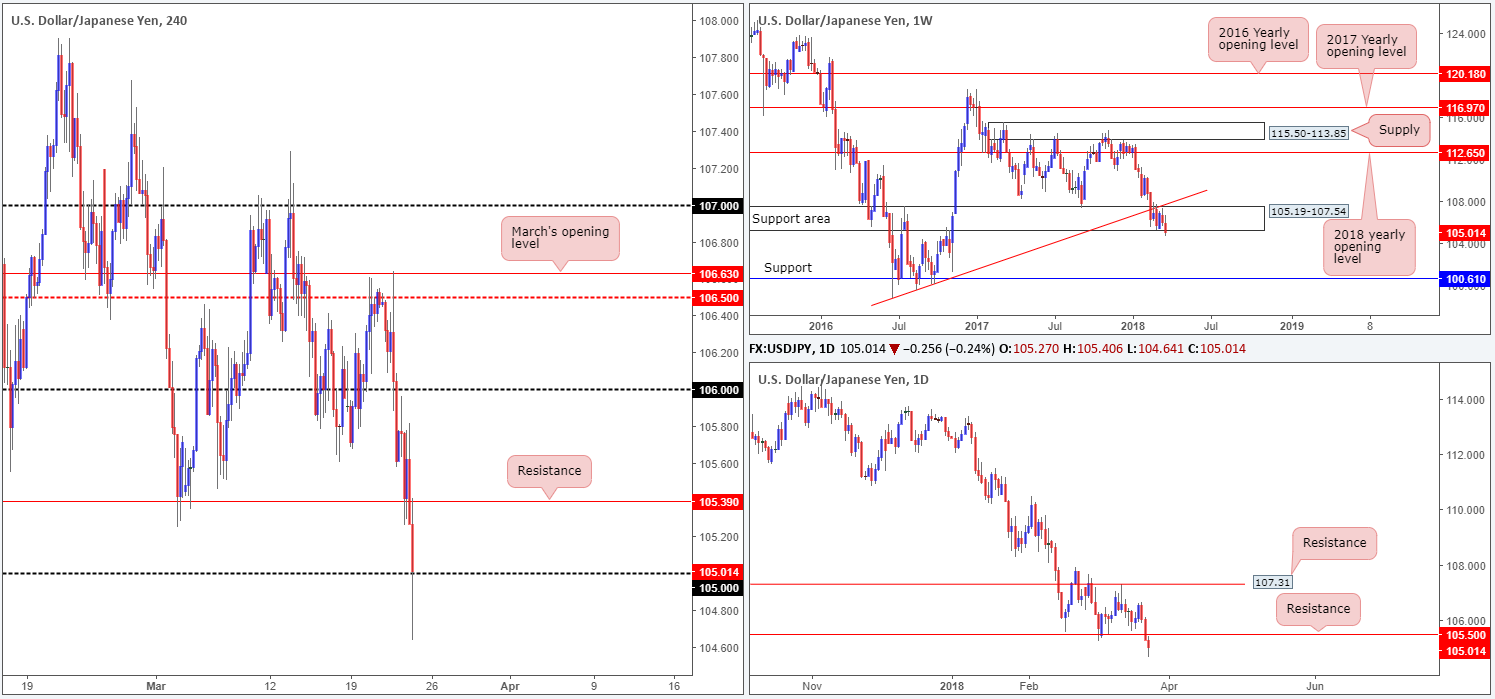
News of trade fears is seen affecting the USD/JPY movement this morning, with the H4 candles seen aggressively probing the 105 handle (reaching as low as 104.64). What this recent move has also accomplished is a marginal break of a weekly support area pegged at 105.19-107.54, which has been in motion since early Feb. In addition to this, we have also seen daily price pop below daily support at 105.50 (now acting resistance).
The next port of call of the H4 scale below 105 comes in at 104. Meanwhile, daily flow shows space to push as far south as daily support seen at 102.89 (not seen on the screen) alongside the weekly timeframe highlighting a possible drop to weekly support coming in at 100.61.
Potential trading zones:
With such an aggressive start to the morning, trading this market (no matter how efficient your trading methodology) is going to be a challenge. Given that, we feel it is best to remain on the sidelines for the time being with a look at reassessing structure going into European hours.
Data points to consider: FOMC member Bostic speaks at 12.10pm; US core durable goods orders m/m at 12.30pm GMT.
Areas worthy of attention:
Supports: 105; 104; 105.19-107.54; 102.89; 100.61.
Resistances: 105.39; 105.50.
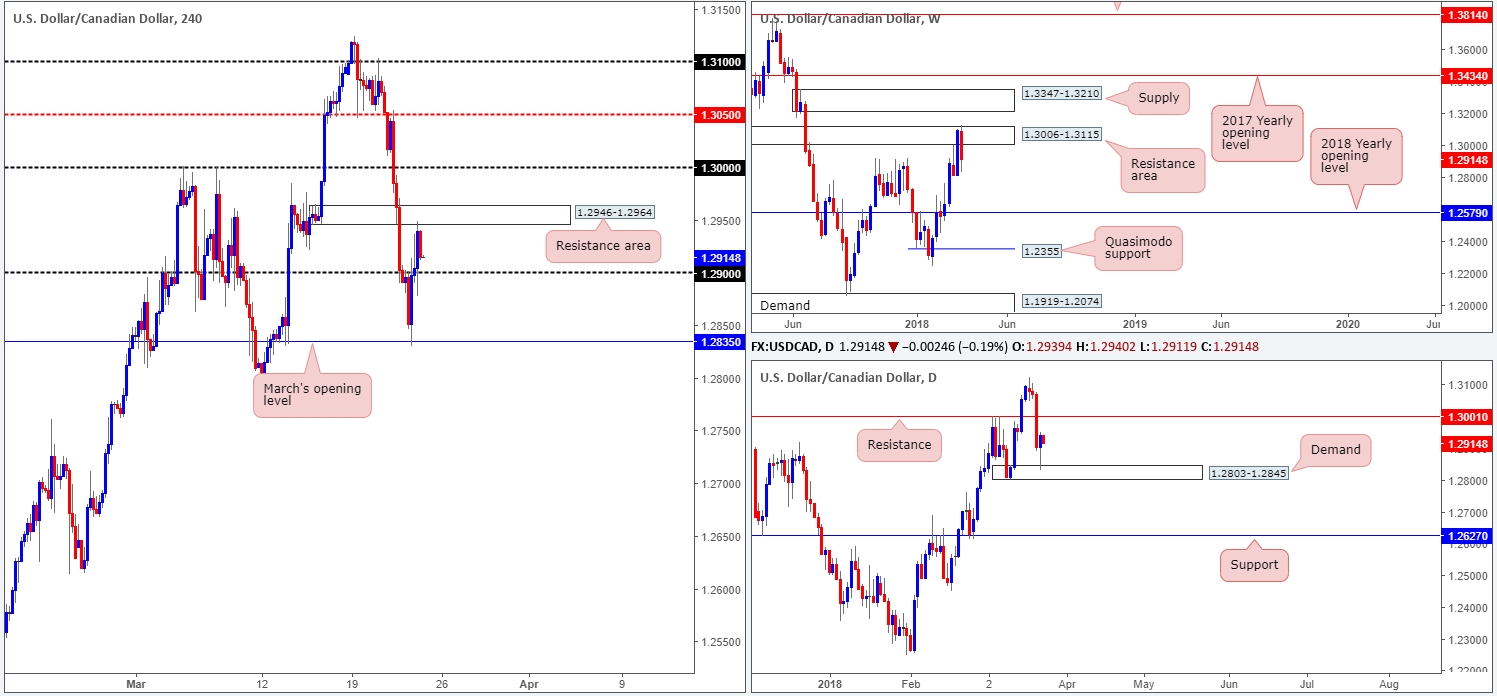
USD/CAD:
The USD/CAD, as you can see, printed a healthy recovery on Thursday, tapping March’s opening level at 1.2835 almost to the pip. H4 price managed to bid the unit beyond 1.29 and challenge the underside of a recently broken H4 demand area at 1.2946-1.2964.
In addition to the above, yesterday’s movement chalked up a nice-looking daily buying tail off the back of a daily demand base coming in at 1.2803-1.2845. Continued buying from this point has the daily resistance level plotted at 1.3001 to target. Weekly price, on the other hand, continues to reflect a bearish stance after a precipitous fall from a weekly resistance area plotted at 1.3006-1.3115.
Potential trading zones:
Right now there is not a lot of wiggle room in this market. On the H4, price is sandwiched between 1.2946-1.2964 and 1.29, while weekly and daily price show opposing structure which could affect medium-term direction finding a path. Hopefully with the slew of Canadian data on the docket scheduled to be released later on today, we’ll have more to talk about as we move into US trading hours.
Data points to consider: FOMC member Bostic speaks at 12.10pm; US core durable goods orders m/m at 12.30pm; Canadian inflation figures at 12.30pm GMT.
Areas worthy of attention:
Supports: 1.29; 1.2835; 1.2803-1.2845.
Resistances: 1.2946-1.2964; 1.3001; 1.3006-1.3115.
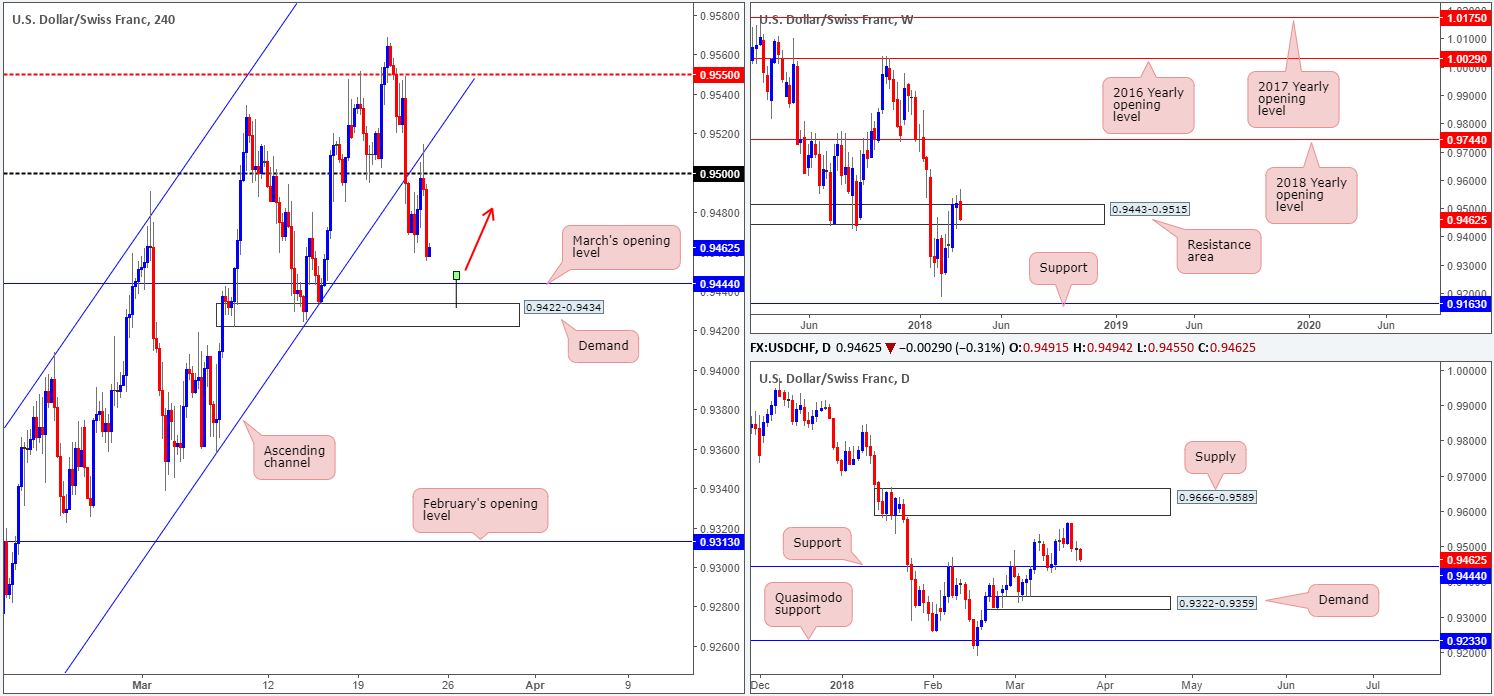
USD/CHF:
As highlighted in Thursday’s report, the 0.95 handle seen on the H4 timeframe was likely to hold firm. Following a brief push to highs of 0.9514 which tapped the underside of a recently broken H4 channel support (taken from the low 0.9187), the pair sold off and ended the day closing not too far off its lows at 0.9463. Well done to any of our readers who took advantage of this move!
Those who are currently short likely have their crosshairs firmly pinned on the daily support level at 0.9444, which also happens to represent March’s opening level seen on the H4 timeframe, followed closely by a H4 demand area located at 0.9422-0.9434.
Potential trading zones:
Keep an eye on March’s opening level today. Given how close this level is positioned to the already proven H4 demand, a fakeout play could be in store. Should a H4 bullish tail pierce through the monthly level and tap the H4 demand (see chart for a drawn example), we feel an intraday bounce to the upside could take place and potentially target 0.95.
Data points to consider: FOMC member Bostic speaks at 12.10pm; US core durable goods orders m/m at 12.30pm GMT.
Areas worthy of attention:
Supports: 0.9444; 0.9422-0.9434.
Resistances: 0.95.
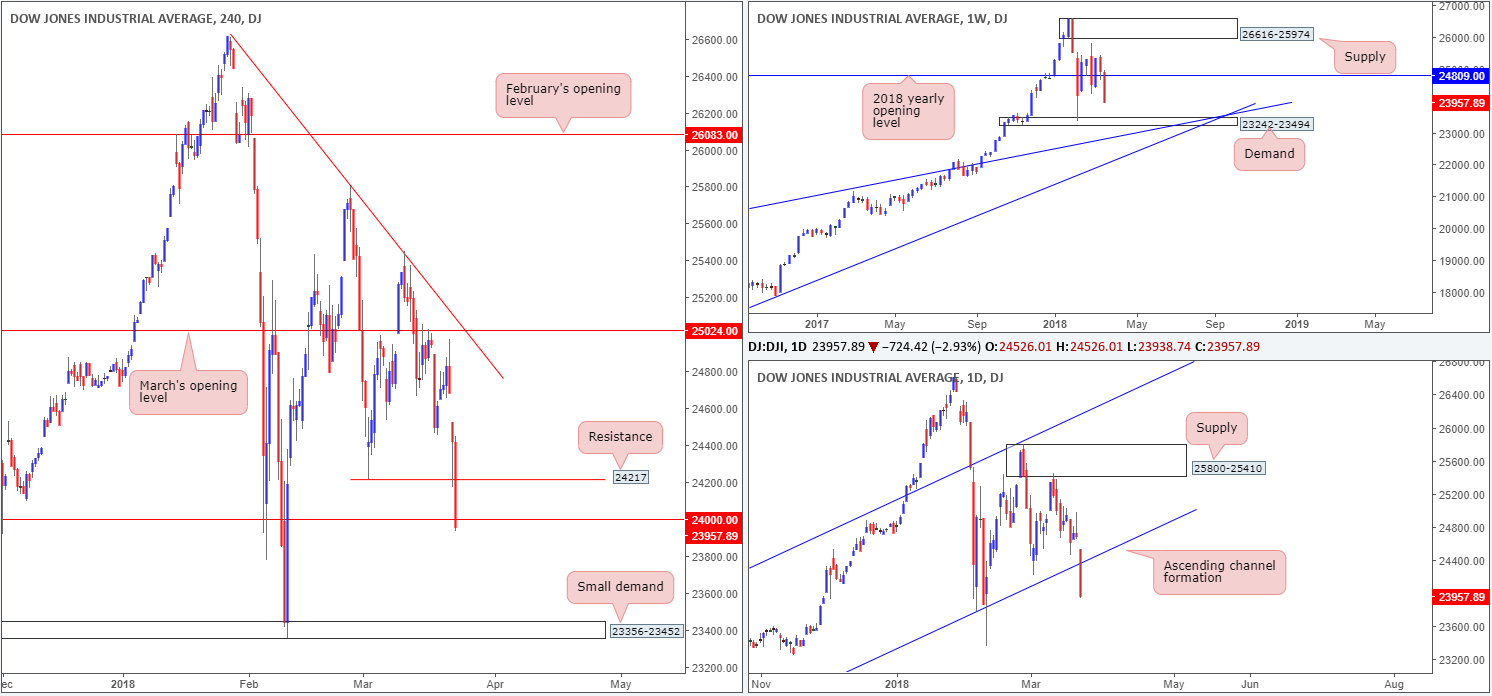
DOW 30:
Across the board, US indexes nose-dived lower on Thursday amid escalating concerns regarding a trade war. News that President Trump plans to impose additional tariffs on China revived fears, which fully came to light after China responded that they will retaliate!
Despite a firm rejection seen off the 2nd March low 24217, H4 price concluded trade marginally breaching the 24K mark. Should the bears remain defensive beneath this number, eyes will likely be on the small H4 demand base coming in at 23356-23452, which, as you can see, held price firm on 9th Feb of this year.
Peering over to the bigger picture, we can see that weekly price is on track to retest weekly demand pegged at 23242-23494 (houses the current H4 demand within), after daily action chewed its way through an ascending channel support taken from the low 17883.
Potential trading zones:
Shorts beyond 24K this morning look like a reasonably safe play, according to our technicals, targeting the top edge of the said weekly demand base at 23494. Conservative traders, however, may want to consider waiting for a retest of 24K to form before pulling the trigger.
Data points to consider: FOMC member Bostic speaks at 12.10pm; US core durable goods orders m/m at 12.30pm GMT.
Areas worthy of attention:
Supports: 23356-23452; 23242-23494.
Resistances: 24K; daily channel resistance; 24217.
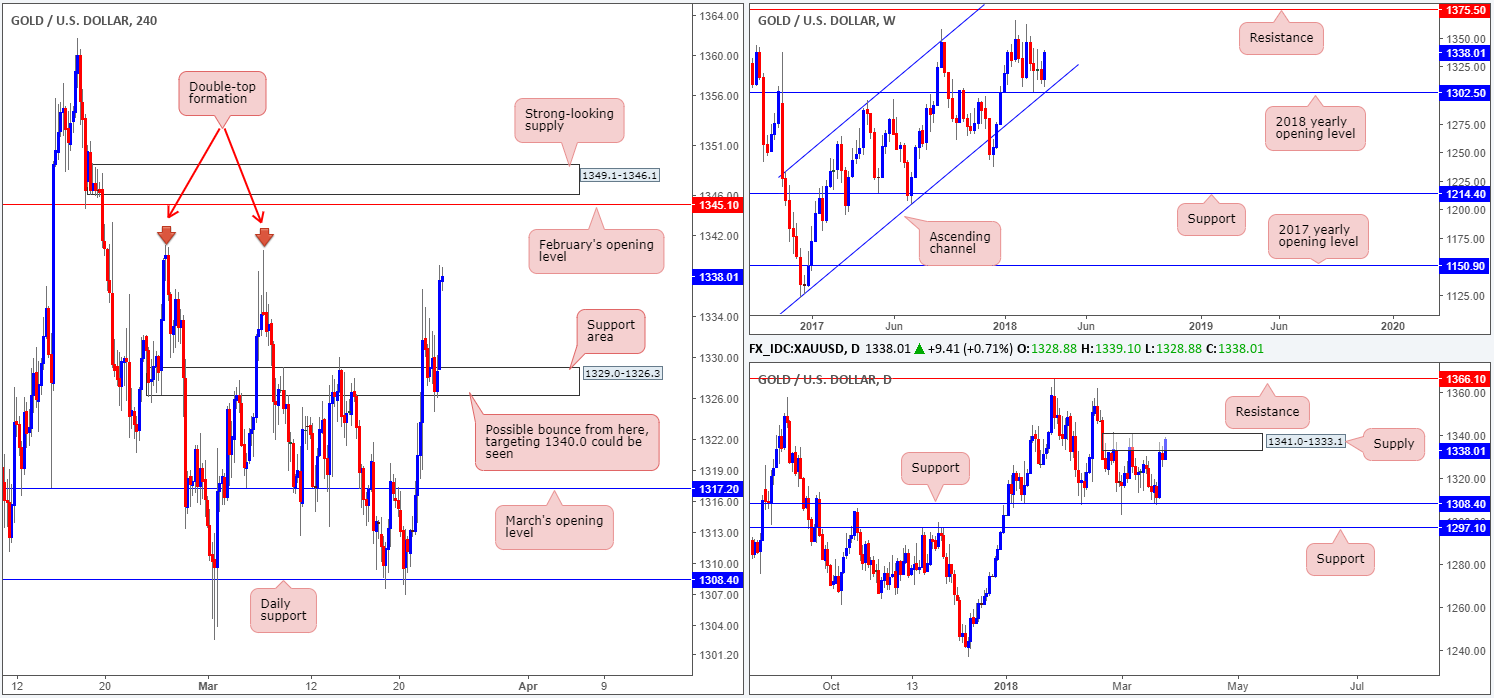
GOLD:
In recent hours, we’ve seen the price of gold, alongside the safe-haven yen, advance against the USD on the back of escalating trade fears.
As you can see, this has, as anticipated, held H4 price firm on the retest of a H4 support area coming in at 1329.0-1326.3 (likely helped by the fact that weekly price shows room to trade as far north as weekly resistance at 1375.5), despite daily price interacting with a daily supply at 1341.0-1333.1.
The next upside objective on the H4 scale falls in at 1340.4ish: a H4 double-top formation, which is shadowed closely by February’s opening level at 1345.1 and then a nearby H4 supply at 1349.1-1346.1. Well done to any of our readers who managed to take advantage of this move.
Potential trading zones:
Besides the long setup advertised from the current H4 support area, we do not see much else on offer at this time. Overall though, we do expect gold to continue climbing.
Areas worthy of attention:
Supports: 1329.0-1326.3.
Resistances: 1340.4; 1345.1; 1349.1-1346.1; 1341.0-1333.1; 1375.5.
This site has been designed for informational and educational purposes only and does not constitute an offer to sell nor a solicitation of an offer to buy any products which may be referenced upon the site. The services and information provided through this site are for personal, non-commercial, educational use and display. IC Markets does not provide personal trading advice through this site and does not represent that the products or services discussed are suitable for any trader. Traders are advised not to rely on any information contained in the site in the process of making a fully informed decision.
This site may include market analysis. All ideas, opinions, and/or forecasts, expressed or implied herein, information, charts or examples contained in the lessons, are for informational and educational purposes only and should not be construed as a recommendation to invest, trade, and/or speculate in the markets. Any trades, and/or speculations made in light of the ideas, opinions, and/or forecasts, expressed or implied herein, are committed at your own risk, financial or otherwise.
The use of the site is agreement that the site is for informational and educational purposes only and does not constitute advice in any form in the furtherance of any trade or trading decisions.
The accuracy, completeness and timeliness of the information contained on this site cannot be guaranteed. IC Markets does not warranty, guarantee or make any representations, or assume any liability with regard to financial results based on the use of the information in the site.
News, views, opinions, recommendations and other information obtained from sources outside of www.icmarkets.com.au, used in this site are believed to be reliable, but we cannot guarantee their accuracy or completeness. All such information is subject to change at any time without notice. IC Markets assumes no responsibility for the content of any linked site. The fact that such links may exist does not indicate approval or endorsement of any material contained on any linked site.
IC Markets is not liable for any harm caused by the transmission, through accessing the services or information on this site, of a computer virus, or other computer code or programming device that might be used to access, delete, damage, disable, disrupt or otherwise impede in any manner, the operation of the site or of any user’s software, hardware, data or property.


