
EUR/USD:
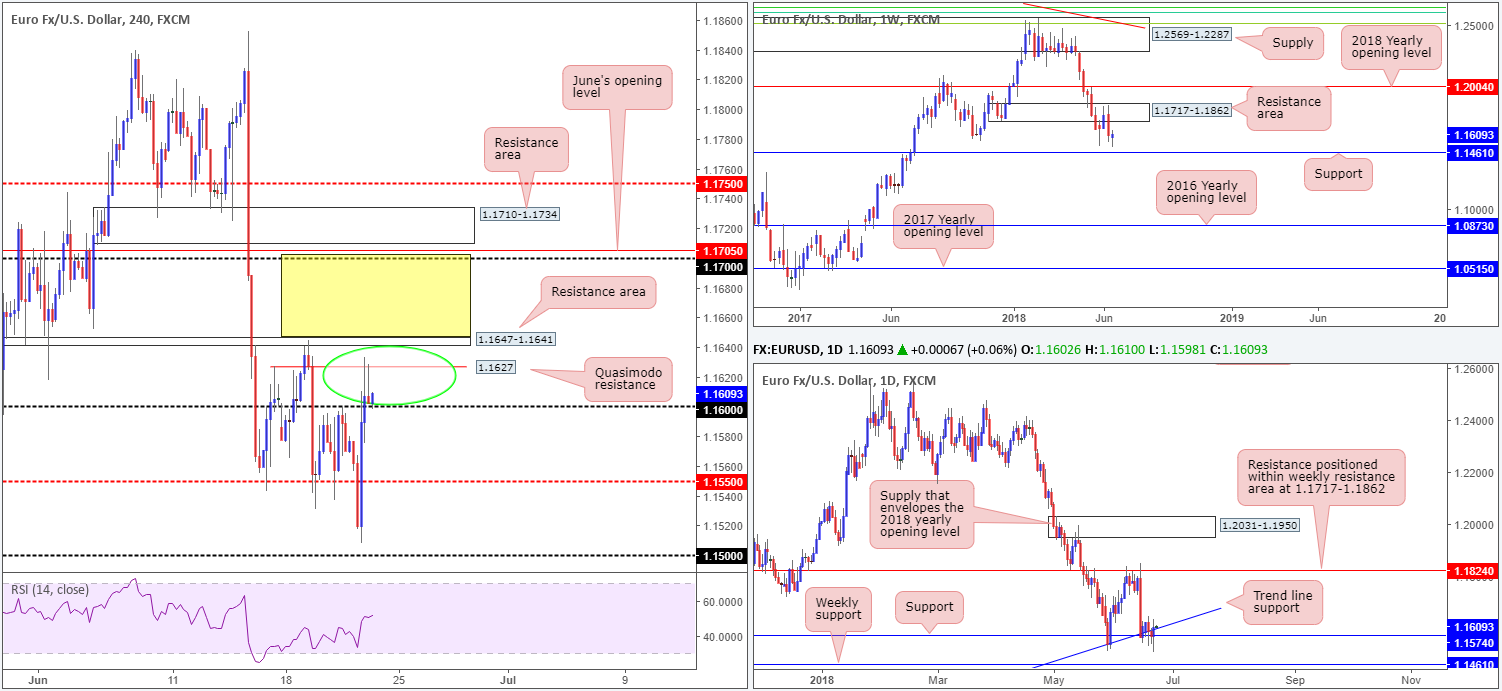
After bottoming just north of the 1.15 handle amid London’s morning session on Thursday, the tide began to turn as the shared currency found active buyers. Influenced by the Bank of England’s hawkish tone and disappointing US economic data, H4 price climbed above 1.16 and ended the day attempting to tackle the H4 Quasimodo resistance seen at 1.1627.
As you can see, the aforementioned H4 Quasimodo resistance level remains intact with the candles now seen retesting 1.16 as support. Outside of this chart, we can see that daily price has spent the week crossing swords with a support level priced in at 1.1574, which happens to converge with a daily trend line support taken from the low 1.0340. Higher up on the curve, nevertheless, weekly flow is seen bottoming (thanks to daily support) just ahead of a weekly support level coming in at 1.1461. Further upside from this point has the nearby weekly resistance area to target at 1.1717-1.1862.
Areas of consideration:
As of current price, we feel initiating trades between 1.1647/1.16 (marked with a green circle on the H4 timeframe) is a chancy move. Our rationale behind this simply comes down to weekly price showing room to probe lower and daily price displaying support. Further adding to this, breakout sellers below 1.16 may also want to exercise caution since they’d be shorting into daily support at 1.1574.
The only area that permits some wiggle room at the moment is above the H4 resistance area at 1.1647-1.1641. A H4 close above this small zone potentially clears the path north to the 1.17 handle, June’s opening level at 1.1705 and nearby H4 resistance area at 1.1710-1.1734, which converges with the underside of the noted weekly resistance area. Therefore, longs within the yellow area on the H4 timeframe appear reasonably safe, according to current structure.
Today’s data points: French flash manufacturing PMI; German flash manufacturing PMI; Eurozone flash manufacturing PMI.
GBP/USD:
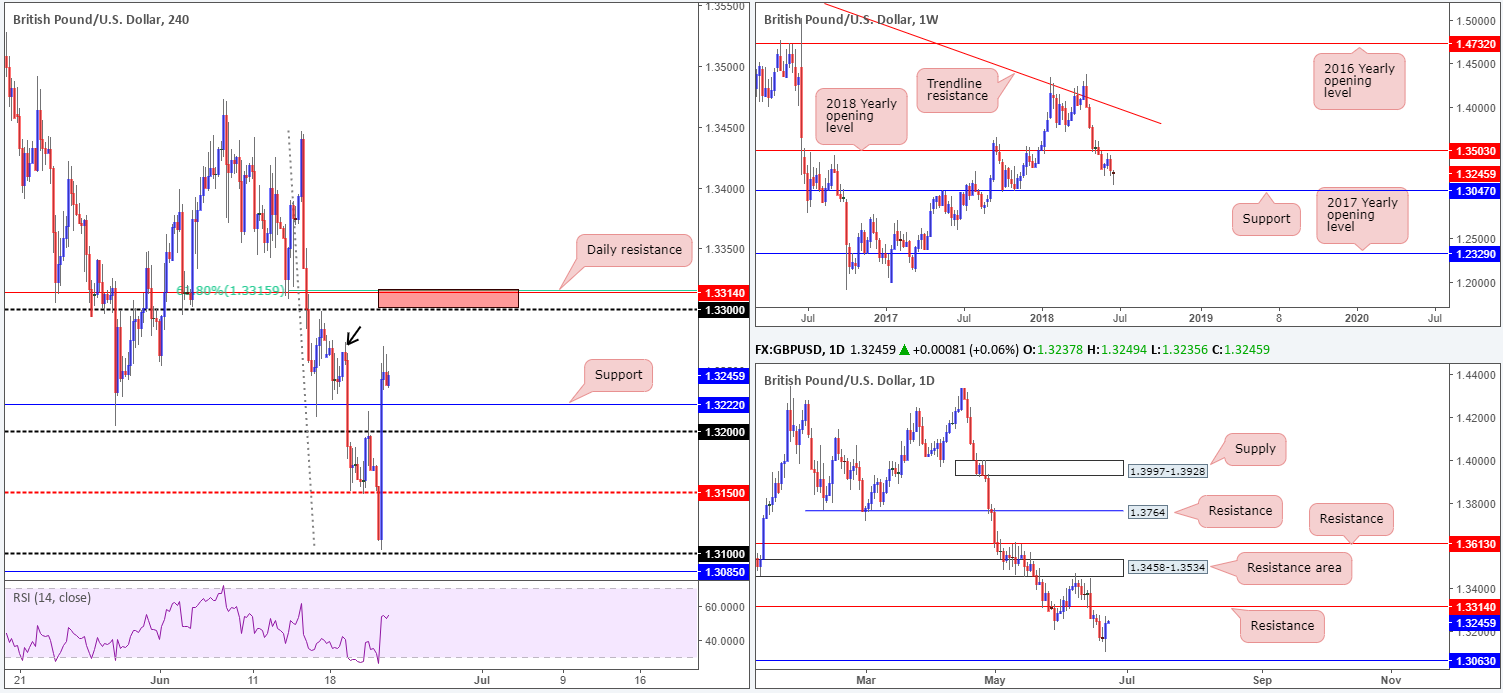
As is evident from the charts this morning, the British pound surged north on Thursday and annihilated multiple H4 tech resistances along the way. Although the Bank of England kept interest rates unchanged, the gap between hawks and doves tightened, increasing the odds for an August rate hike.
While H4 momentum diminished as we entered US hours, thanks partially to H4 supply marked with a black arrow at 1.3272-1.3254, traders now likely have their crosshairs fixed on the 1.33 handle. Why this area? Well, not only is it an easily visible number to all, it’s also bolstered by nearby daily resistance plotted at 1.3314 and a 61.8% H4 Fib resistance value at 1.3315.
Areas of consideration:
Keeping it Simple Simon this morning, the team has noted to keep eyeballs on the 1.3315/1.33 red zone drawn on the H4 chart for possible shorting opportunities. Due to the areas small size, though, traders will need to be prepared for the possibility of a fakeout occurring. To help tackle this problem, consider waiting for H4 price to show intent before considering a short. What we mean by this is simply waiting and seeing if H4 action can print a full or near-full-bodied bearish candle. Should this come to fruition, stop-loss orders can be positioned above the candle’s rejection wick. Regarding the first take-profit target, however, this will be dependent on the approach (which has yet to complete).
Today’s data points: Limited.
AUD/USD:
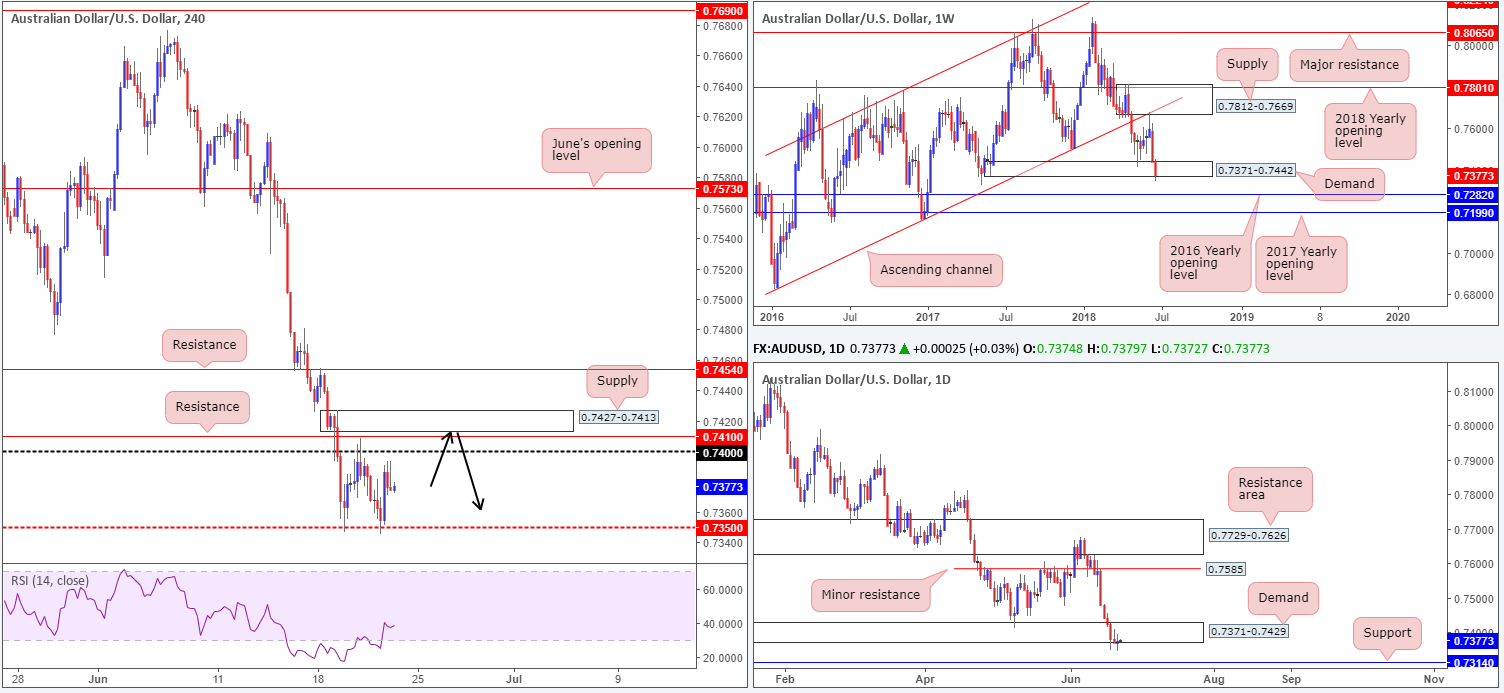
Early Europe witnessed a fresh daily low of 0.7345 on Thursday, which happened to marginally pierce through H4 mid-level support at 0.7350. This did little to encourage selling activity as the commodity currency staged a modest recovery to highs of 0.7393, largely on the back of a waning USD.
On the whole, market structure remains pretty much unchanged, as H4 price continues to carve out a consolidation between the 0.74 handle and aforementioned H4 mid-level support. In terms of the bigger picture, higher-timeframe movement shows price action chewing on the lower edge of a weekly demand at 0.7371-0.7442, and its partner demand on the daily timeframe at 0.7371-0.7429. Given a large portion of long-term buyers’ stop-loss orders have likely been triggered as a result of this, there’s a chance further downside could be on the cards.
Areas of consideration:
A H4 candle close beyond the 0.7350 point on the H4 scale would be interesting, since we see little support until reaching the 0.73 neighborhood. Disappointingly, however, the higher timeframes highlight nearby support on the daily scale at 0.7314. Therefore, there’s not much wiggle room to execute shorts beyond 0.7350.
The only other area of interest can be seen at the H4 supply zone at 0.7427-0.7413. Underlined in yesterday’s briefing, we noted this area due to the zone boasting strong momentum to the downside along with its position just above the 0.74 handle and H4 resistance at 0.7410. Fakeouts are a common occurrence around psychological numbers (as we witnessed in recent trade), so another whipsaw above the 0.74 handle into our aforementioned H4 supply, is certainly a possibility today. An ideal sell signal, as far as we can see, would be for H4 price to print a bearish pin-bar formation that pierces through 0.74 (and the aforesaid H4 resistance) into the noted H4 supply zone (sells on the close of the candle pattern should be targeted with an initial take-profit zone set at 0.7350).
Today’s data points: Limited.
USD/JPY:
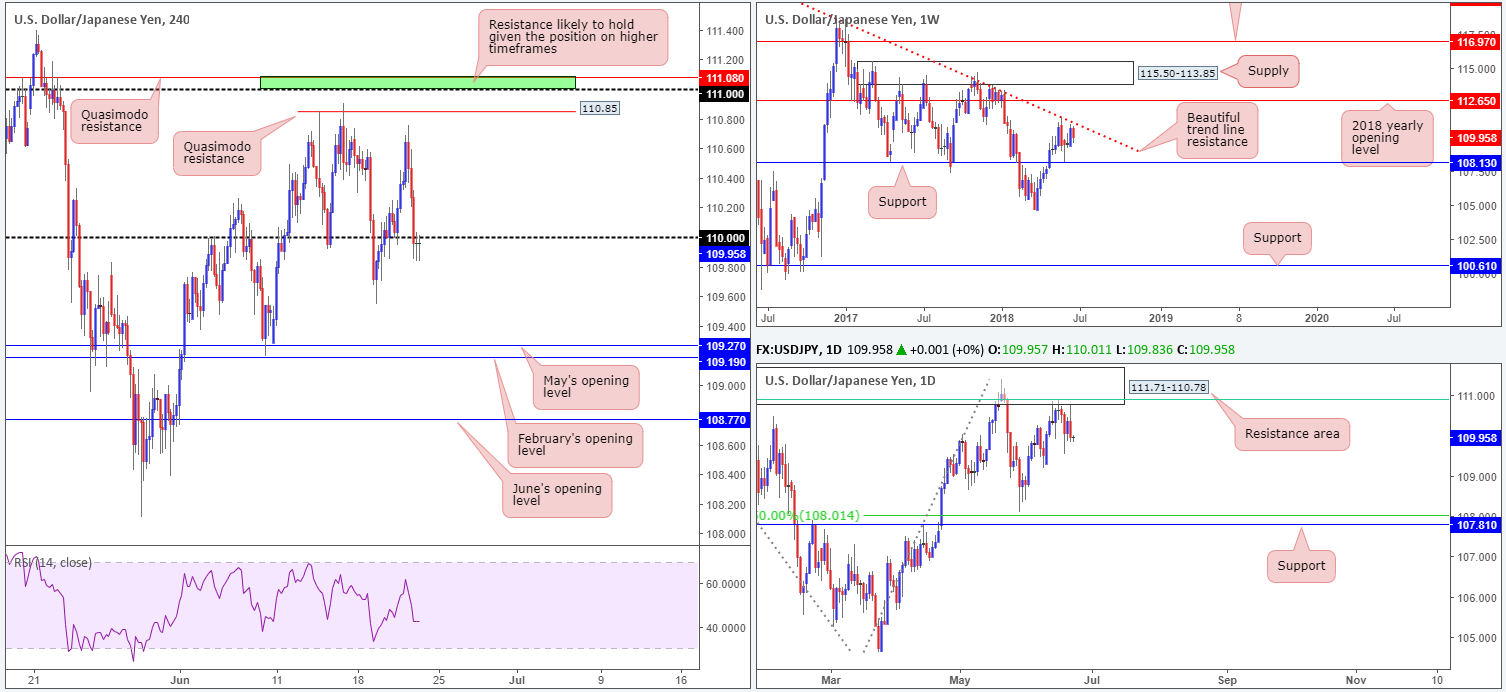
Demand for the safe-haven Japanese yen increased on Thursday after the USD/JPY clocked session highs of 110.75 in early Europe. Concerns over global trade, coupled with a modest USD (US dollar index) retracement, saw the pair conclude trade marginally breaching the 110 handle seen on the H4 timeframe.
While H4 price is seen lingering beneath 110, weekly price action is currently trading just south of a trend line resistance taken from the high 123.67, with room to stretch as far south as weekly support plotted at 108.13. In terms of daily movement, the daily resistance zone seen at 111.71-110.78 remains firmly intact (this is an area that not only fuses with the aforementioned weekly trend line resistance, it also converges with a 61.8% daily Fib resistance value at 110.91 [green line] and has reasonably significant history dating back to August 2017), with sellers now likely eyeing the June 8 lows at 109.19.
Areas of consideration:
In light of a clear bearish vibe being seen in this market at the moment, shorts at the underside of 110 could very well be an option today. Downside targets on the H4 scale fall in around May’s opening level at 109.27, shadowed closely by February’s opening level at 109.19, which, as you may recall, marks the June 8 low noted above on the daily timeframe.
Today’s data points: Limited.
USD/CAD:
Despite a reasonably well-bid oil market on Thursday, the USD/CAD remained somewhat stationary around the 1.33 handle after tapping highs of 1.3335. The reasons behind this lackluster movement may be likely due to where price is positioned on the higher timeframes.
A few pips above 1.33 is a daily Quasimodo resistance level marked at 1.3308. Further adding to this, weekly price is in the process of completing a three-drive formation (see black arrows) that terminates within the upper limit of a weekly supply (1.3347-1.3210) at 1.3340ish.
Areas of consideration:
As price reached highs of 1.3335 yesterday, we could be in for a downside move in this market on the back of weekly structure highlighted above. A decisive H4 close beneath 1.33 would, in our humble view, be enough to confirm bearish strength which could potentially send the unit as far south as the 1.32 handle. An ideal setup here would be for H4 price to close below 1.33 and shortly after retest it as resistance in the shape of a full or near-full-bodied bearish formation. Stops can then be positioned nicely above the candle’s rejection wick.
Today’s data points: Canadian inflation and retail sales figures due for release early US hours.

USD/CHF:
Leaving the key figure 1.00 (parity) unchallenged, the USD/CHF fell sharply lower on Thursday. In the shape of a clear-cut daily bearish engulfing candle off daily resistance at 0.9982, the H4 candles managed to overcome H4 mid-level support at 0.9950 and close the day out testing the 0.99 handle and its closely associated May’s opening level at 0.9907.
Areas of consideration:
According to the daily timeframe, there’s space seen for the market to probe lower at least until we reach the daily Quasimodo support located at 0.9826. With that being in mind, should we observe a H4 close print below the 0.99 handle (followed by a retest to the underside of this number as resistance is preferable), selling this market could be something to consider, targeting June’s opening level at 0.9842, followed closely by the aforementioned daily Quasimodo support level.
Today’s data points: Limited.

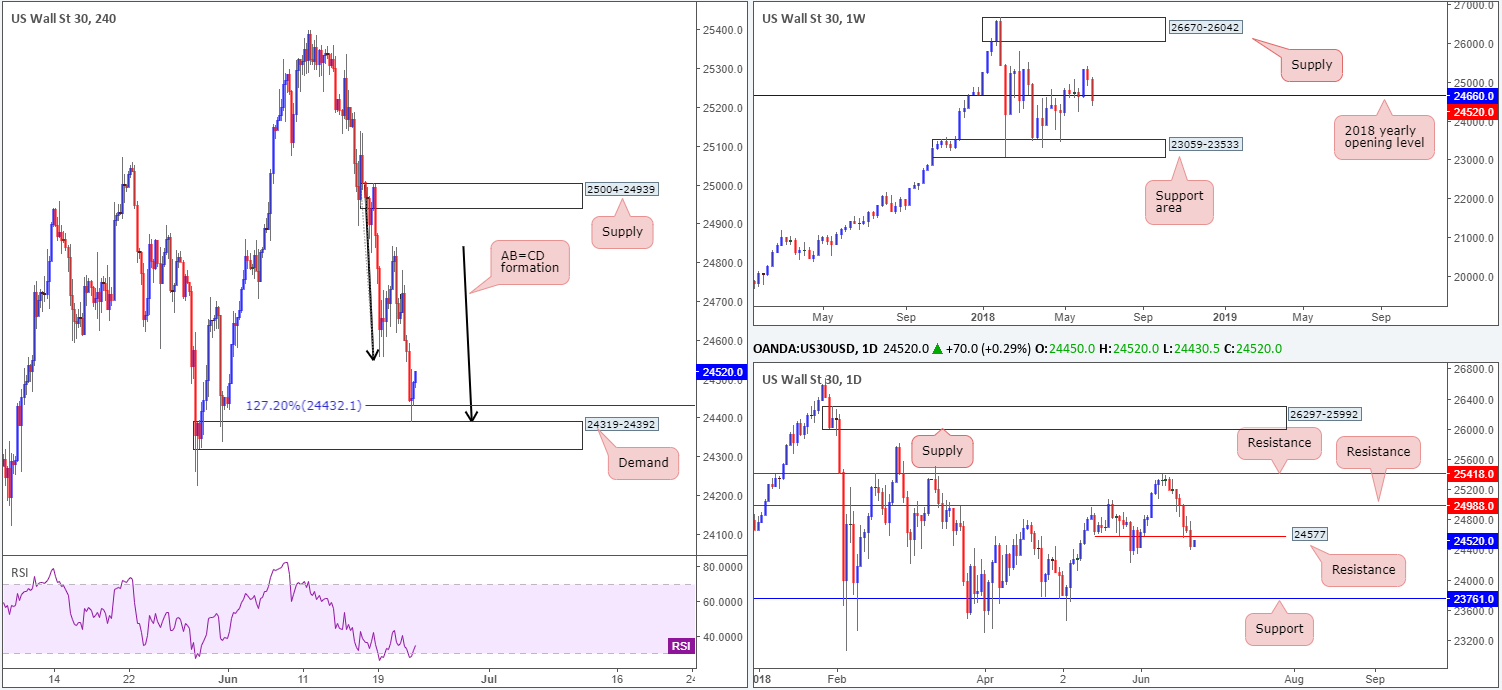
Dow Jones Industrial Average:
US equities extended their losing streak to five days on Thursday amid concerns over trade conflict, and the US Supreme Court’s decision to allow the government to tax sales from online retailers.
Yesterday’s move brought weekly price back beneath the 2018 yearly opening level at 24660. The next downside support on the weekly scale can be seen at an area drawn from 23059-23533.
Daily movement recently eclipsed daily support at 24577 in strong fashion. Apart from the May 29 low at 24224, there’s not much support seen stopping the index from reaching the 23761 mark.
Over on the H4 timeframe, we’ve had an AB=CD completion to the downside form that terminates around the 127.2% H4 Fib ext. point at 24432, seen just north of H4 demand plotted at 24319-24392. The reaction off this area is likely partly due to shorts covering their positions. However, this could be sufficient enough to bring the unit back up to the underside of the daily support-turned resistance at 24577.
Areas of consideration:
A move up to the aforementioned daily resistance level today may bring sellers into the market, and therefore is a level worthy of attention. Should one observe H4 price action reject the daily level and form a full or near-full-bodied bearish formation, this is, given weekly price is also trading beneath 2018 yearly opening level, likely sufficient enough to warrant shorts. The initial downside target will, of course, be the current H4 demand base. Beyond here, though, eyes will likely be on the May 29 low at 24224 mentioned above on the daily scale.
Today’s data points: Limited.
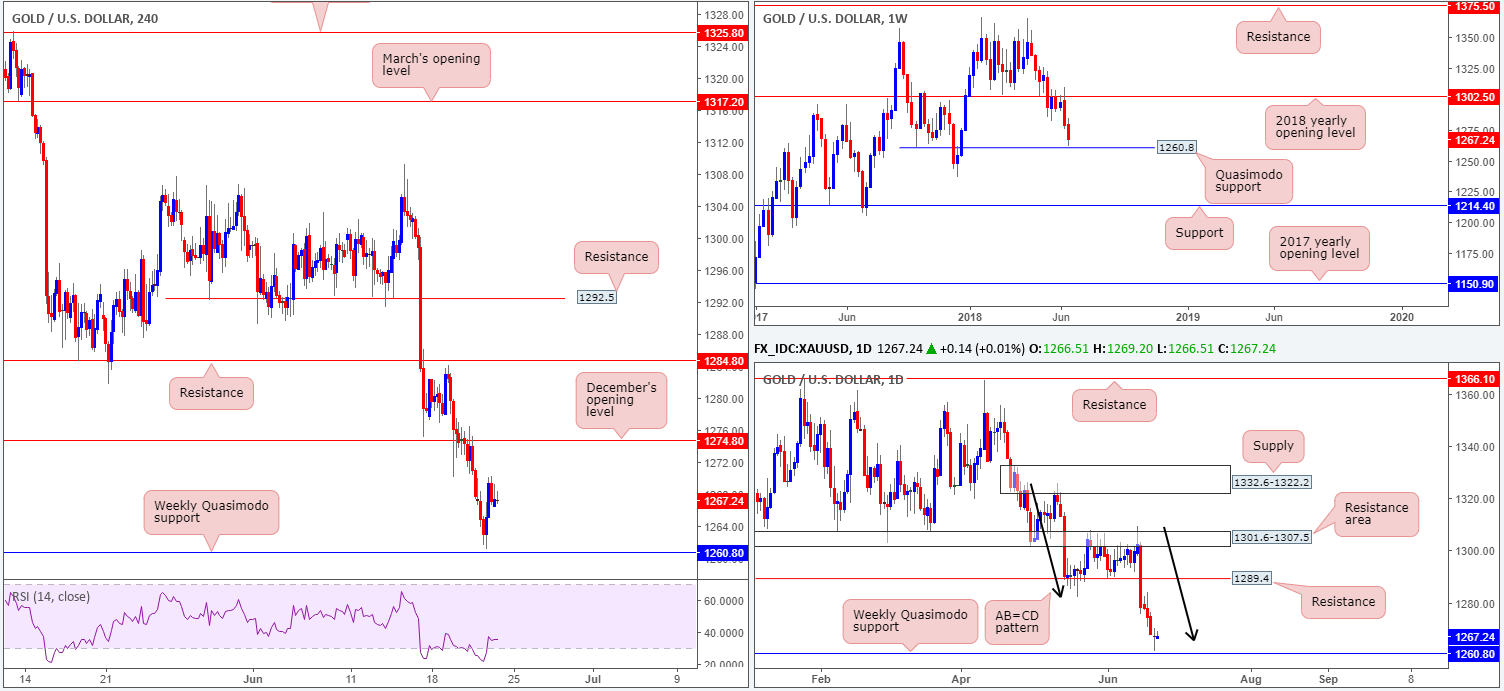
XAUUSD (GOLD):
Coming in from the top this morning, one is able to observe weekly price nearing a weekly Quasimodo support plotted at 1260.8, following two weeks of decisive selling from the 2018 yearly opening level at 1302.5. A closer look at price action on the daily timeframe, nevertheless, shows the daily candles finding support off of a recently completed AB=CD formation at 1265.6.
Across on the H4 timeframe, we do not really have much to shout about in terms of market structure as focus remains on the weekly Quasimodo support at the moment. What we do see, however, is December’s opening level at 1274.8 as a viable upside target, which, as you can see, was respected as resistance on a retest play on Wednesday.
Areas of consideration:
Ultimately, what we’re looking to see happen in this market is a test of the noted weekly Quasimodo support that’s bolstered with H4 price action: a full or near-full-bodied bull candle. This – coupled with the daily AB=CD formation in play – would, in our view, be considered a high-probability trade long, targeting December’s opening level mentioned above at 1274.8 as the initial take-profit zone.
The use of the site is agreement that the site is for informational and educational purposes only and does not constitute advice in any form in the furtherance of any trade or trading decisions.
The accuracy, completeness and timeliness of the information contained on this site cannot be guaranteed. IC Markets does not warranty, guarantee or make any representations, or assume any liability with regard to financial results based on the use of the information in the site.
News, views, opinions, recommendations and other information obtained from sources outside of www.icmarkets.com.au, used in this site are believed to be reliable, but we cannot guarantee their accuracy or completeness. All such information is subject to change at any time without notice. IC Markets assumes no responsibility for the content of any linked site. The fact that such links may exist does not indicate approval or endorsement of any material contained on any linked site.
IC Markets is not liable for any harm caused by the transmission, through accessing the services or information on this site, of a computer virus, or other computer code or programming device that might be used to access, delete, damage, disable, disrupt or otherwise impede in any manner, the operation of the site or of any user’s software, hardware, data or property.


