
A note on lower timeframe confirming price action…
Waiting for lower timeframe confirmation is our main tool to confirm strength within higher timeframe zones, and has really been the key to our trading success. It takes a little time to understand the subtle nuances, however, as each trade is never the same, but once you master the rhythm so to speak, you will be saved from countless unnecessary losing trades. The following is a list of what we look for:
- A break/retest of supply or demand dependent on which way you’re trading.
- A trendline break/retest.
- Buying/selling tails/wicks – essentially we look for a cluster of very obvious spikes off of lower timeframe support and resistance levels within the higher timeframe zone.
- Candlestick patterns. We tend to only stick with pin bars and engulfing bars as these have proven to be the most effective.
We search for lower timeframe confirmation between the M15 the H1 timeframes, since most of our higher-timeframe areas begin with the H4. Stops are usually placed 5-10 pips beyond confirming structures.
EUR/USD:
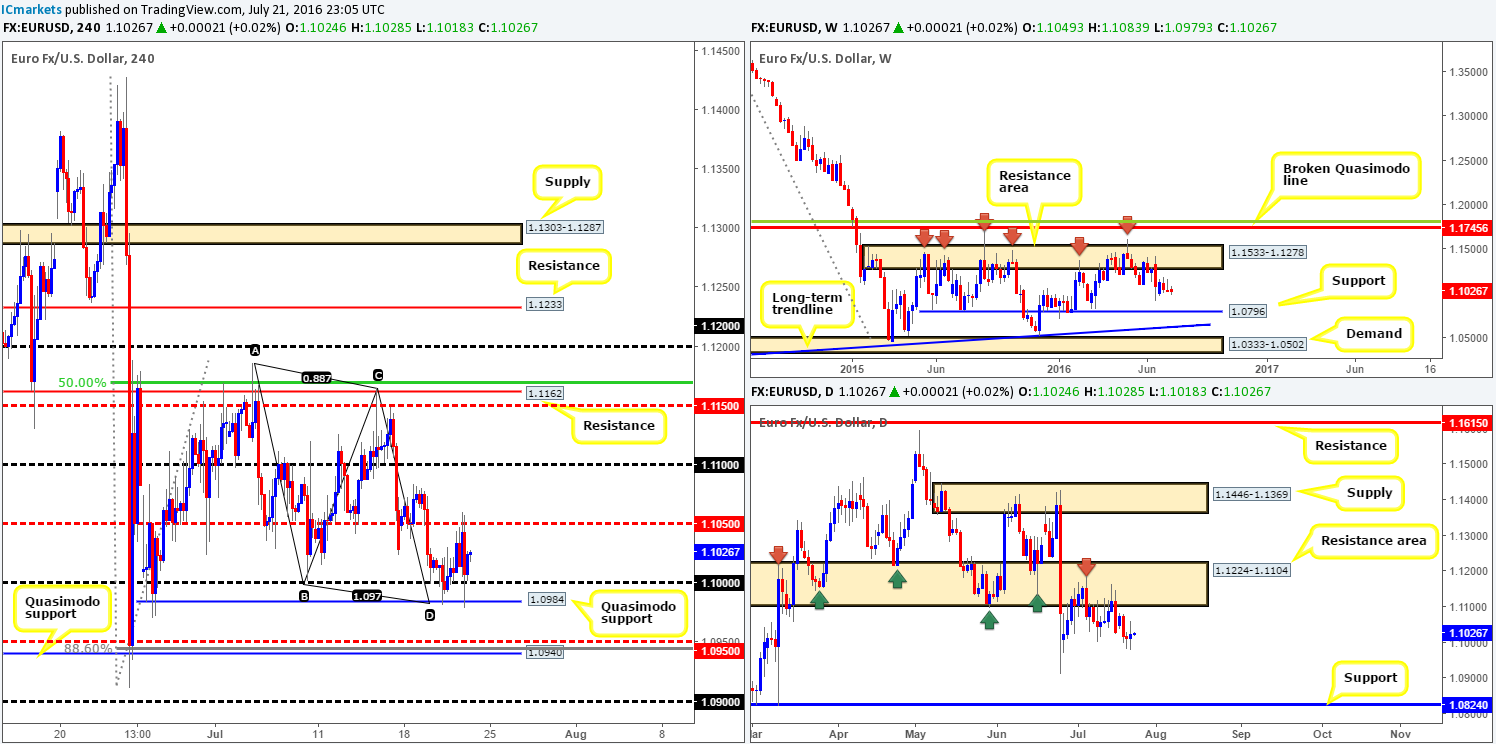
During the course of yesterday’s sessions, we can see that the single currency found a pocket of strong offers around the H4 mid-way point 1.1050 going into the early hours of the US session. This, as you can see, forced price to momentarily surpass the 1.10 figure and tag in bids around the H4 Quasimodo line just below it at 1.0984 for the second time this week. Technically, this line – coupled with its merging H4 AB=CD completion point at 1.0979 is proving be a stronger line of support than we first anticipated!
Despite the EUR currently registering with H4 support again, we still feel that this pair is headed south overall. Our reasoning stems from the higher timeframe structures… The weekly chart shows space to move lower down to support drawn from 1.0796, while down on the daily chart the major is being held lower by a daily resistance area at 1.1224-1.1104. Apart from the referendum low seen at 1.0911, there’s little support stopping price from reaching the daily support chalked in at 1.0824.
However, there is a good chance that should the current H4 Quasimodo line be consumed today, price will bounce from the larger H4 Quasimodo line seen at 1.0940. Not only is this hurdle backed by a deep H4 88.6% Fib retracement line at 1.0945 and a H4 mid-way support at 1.0950, it was also where price rotated during the ‘Brexit’ fallout, indicating a strong perimeter of support.
Our suggestions: Right now, we’d steer clear of longs for the time being unless price strikes the H4 Quasimodo line at 1.0940. And even then we would only enter a trade long from here with clear lower timeframe confirmation (see the top of this report) on the expectation of a small intraday bounce likely back up to the 1.10 region.
Levels to watch/live orders:
- Buys: 1.0940/1.0950 [Tentative – confirmation required] (Stop loss: dependent on where one confirms this area).
- Sells: Flat (Stop loss: N/A).
GBP/USD:
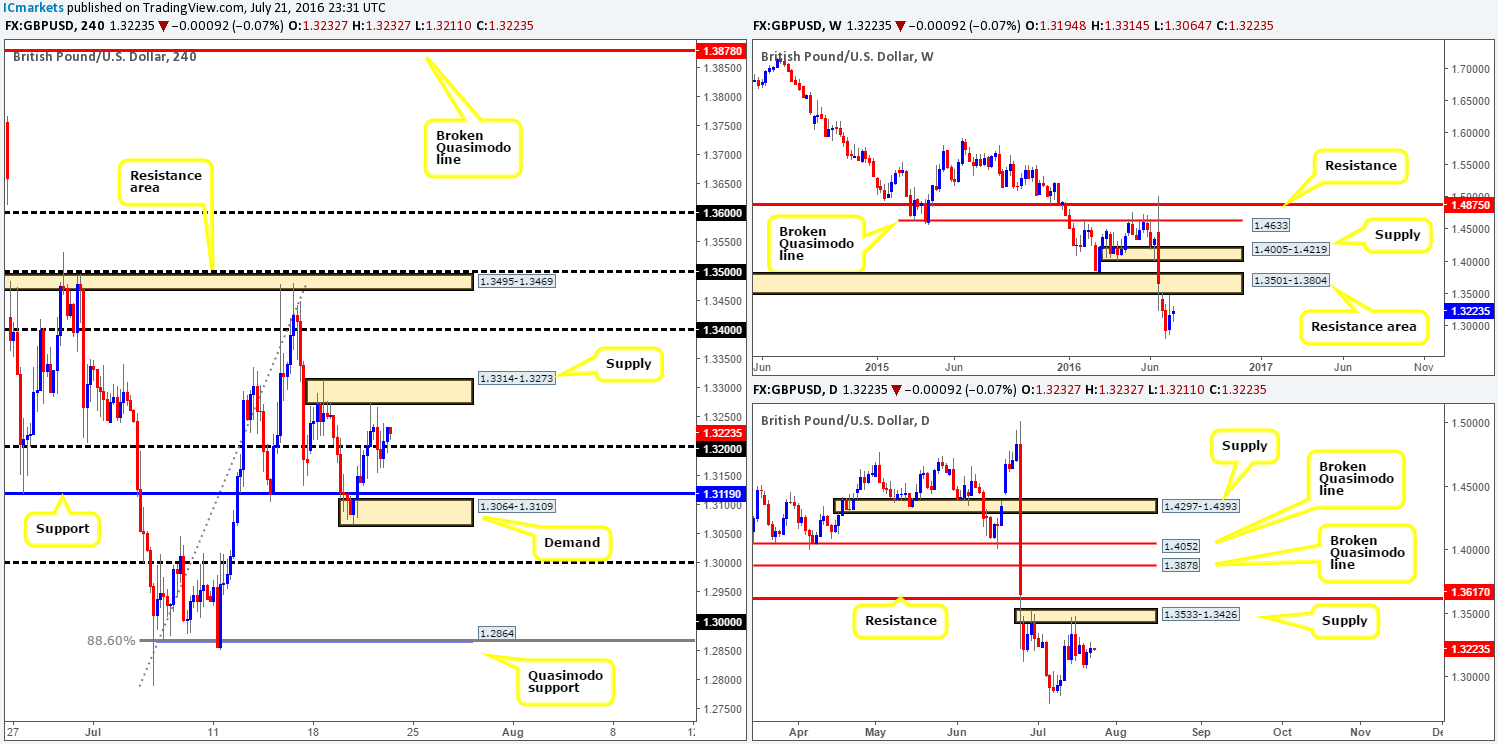
Pressured by poor UK retail sales data, cable slipped below the 1.32 handle going into yesterday’s London session. However, as you can see, price did quickly recover and managed to close the day back above the 1.32 region. Directly above current prices, there’s a H4 supply seen at 1.3314-1.3273 which could potentially halt further buying, while beyond 1.32 we see a H4 demand at 1.3064-1.3109 bolstered by a H4 support at 1.3119.
With the higher timeframes indicating that this pair is clearly trending south, and price is being held lower by a daily supply at 1.3533-1.3426, this market may still be headed lower. With that in mind, our team will look to sell the GBP following a break below and retest of 1.32, targeting the aforementioned H4 support at 1.3119. We would recommend waiting for lower timeframe confirmation to form upon a successful retest of 1.32 (see the top of this report), but that is, of course, down to the individual trader.
Levels to watch/live orders:
- Buys: Flat (Stop loss: N/A).
- Sells: Watch for price to close below the 1.32 handle and look to trade any retest seen thereafter (lower timeframe confirmation preferred).
AUD/USD:
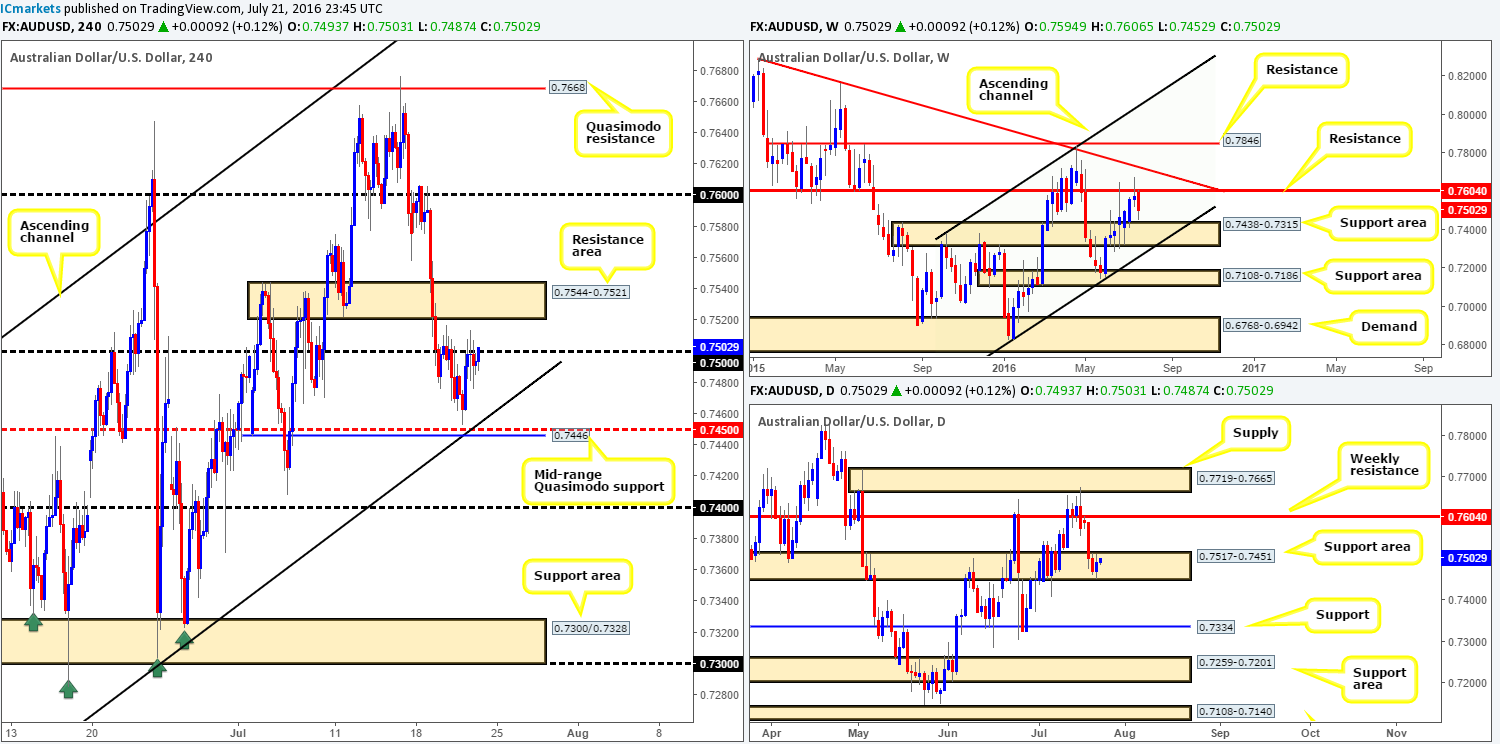
The AUD/USD saw a brief upsurge in buying going into the early hours of yesterday’s trading, consequently landing price around the 0.75 handle. From here, the commodity currency fell into a phase of consolidation, unable to gain much ground above the psychological boundary. While a rotation from 0.75 or even the H4 resistance area above it at 0.7544-0.7521 could be logical places for price to bounce from, we feel the unit has the potential to take out these zones today. Our rationale behind this approach stems from daily action inhabiting a daily support area coming in at 0.7517-0.7451. What’s more, let’s also bear in mind that weekly price recently came within touching distance of connecting with the top-side of a weekly support area at 0.7438-0.7315.
Our suggestions: Quite simply we are looking for price to close above the H4 resistance area at 0.7544-0.7521 today. Should this come to fruition, a retest followed by a lower timeframe buy signal (see the top of this report for lower timeframe entry techniques) would be sufficient enough for our team to buy, targeting the H4 supply area at 0.7606-0.7589. The reason for selecting this area as our target zone simply comes down to it enveloping the weekly resistance line at 0.7604, which is the next upside target on both the weekly and daily timeframes!
Levels to watch/live orders:
- Buys: Watch for price to close above the H4 resistance area at 0.7544-0.7521 and look to trade any retest seen thereafter (lower timeframe confirmation required).
- Sells: Flat (Stop loss: N/A).
USD/JPY:
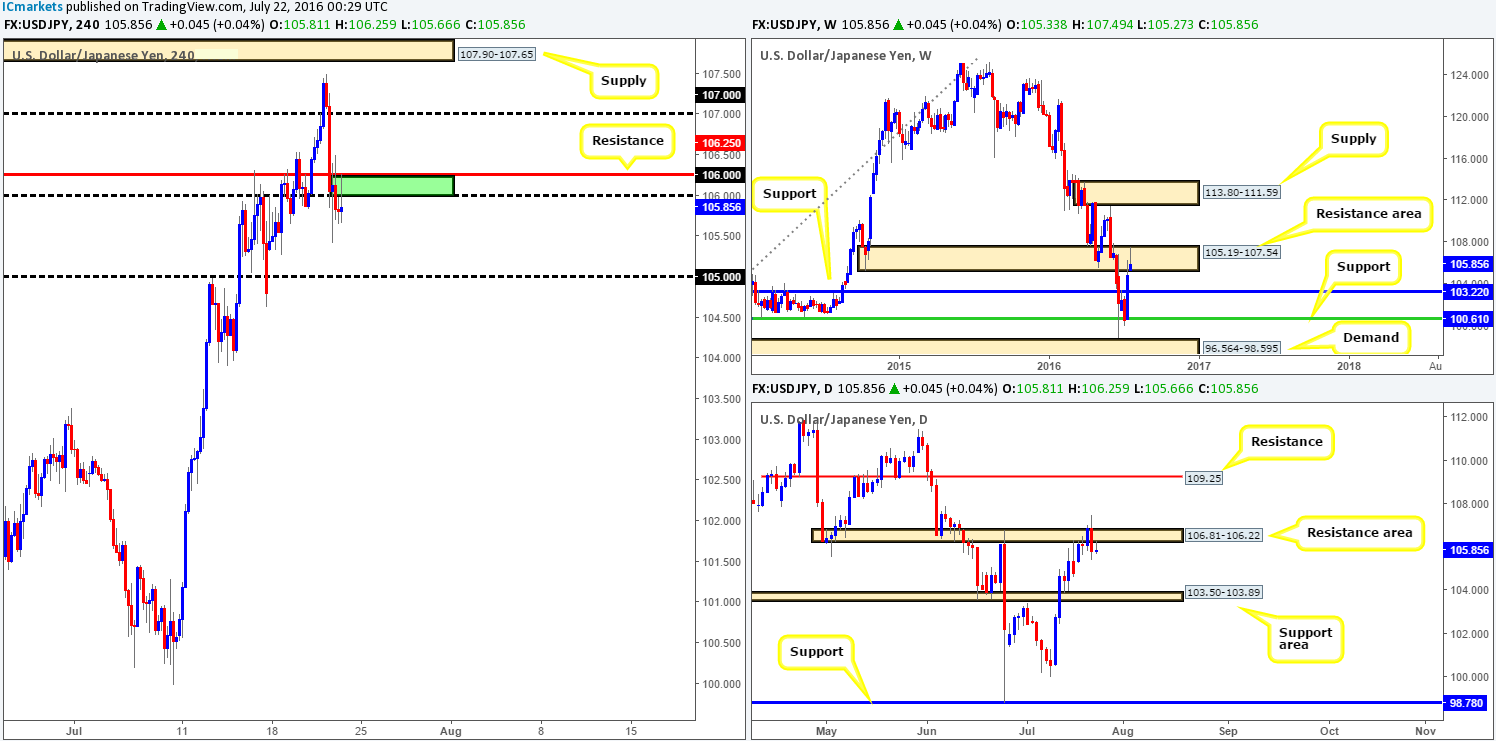
Beginning with a quick look at the weekly chart this morning, one can see that the USD/JPY recently sold off from within the extremes of a weekly resistance area at 105.19-107.54. In the event that this wave of selling continues, the weekly support at 103.22 is likely to be the next line on the hit list. Down on the daily chart, an impressive-looking bearish engulfing candle formed as a result of this recent selling around a daily resistance area drawn from 106.81-106.22. This, as far as we can see, has the potential to push this market down to a daily support area at 103.50-103.89, which sits just above the aforementioned weekly support.
Stepping across to the H4 chart, price took out two handles (107/106) along with a H4 support at 106.25 (now acting resistance) during yesterday’s decline, which has likely opened the trapdoor for prices to challenge the 105 handle today.
Our suggestions: Look to sell from the 106/106.25 region (green box) today with the backing of a lower timeframe sell signal, targeting 105. This could be in the form of an engulf of demand followed by a subsequent retest, a trendline break/retest or simply a collection of well-defined selling wicks. Even if one is able to pin down a lower timeframe signal here, we’d still recommend placing stops above the 106.25 region.
Levels to watch/live orders:
- Buys: Flat (Stop loss: N/A).
- Sells: 106/106.25 region [Tentative – confirmation required] (Stop loss: dependent on where one confirms this area).
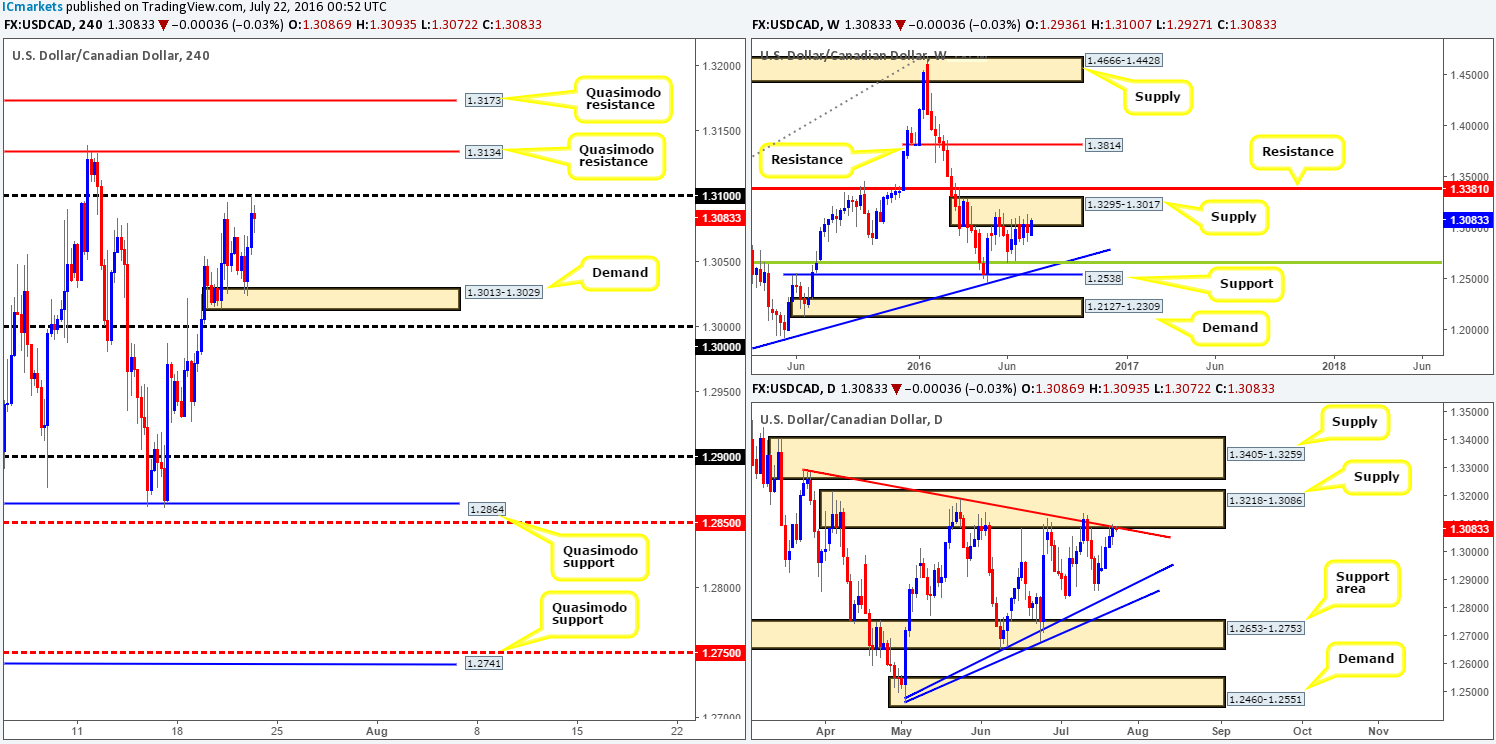
USD/CAD:
Weighed on heavily by the recent sell off in oil, the USD/CAD pair rotated beautifully from a H4 demand barrier coming in at 1.3013-1.3029, consequently dragging prices up to the 1.31 handle by the day’s end. Taking into account that daily action recently struck the daily supply at 1.3218-1.3086 (bolstered by a daily trendline resistance extended from the high 1.3295), and the weekly remains clinging to the underside of a weekly supply base drawn from 1.3295-1.3017, selling seems to be the more favorable as far as structure is concerned.
The 1.31 handle along with the two H4 Quasimodo resistance levels above it at 1.3134/1.3173 are sell zones we currently have on our radar today. Each level is, as can be seen from the charts, positioned nicely within the above said higher timeframe supplies.
Our suggestions: Since it is almost impossible to know which of the above said H4 areas will bounce, if any, we recommend being patient and waiting for lower timeframe price action to from beforehand (see the top of this report). However, should price climb to the most extreme H4 Quasimodo resistance line at 1.3173, we would, depending on the time of day, enter with a market order as we then have the option of placing our stop above the current daily supply zone!
Levels to watch/live orders:
- Buys: Flat (Stop loss: N/A).
- Sells: 1.31 region [Tentative – confirmation required] (Stop loss: dependent on where one confirms this area). 1.3134 region [Tentative – confirmation required] (Stop loss: dependent on where one confirms this area). 1.3173 [Entering at market here is viable but is still dependent on the time of day] (Stop loss: 1.3220).
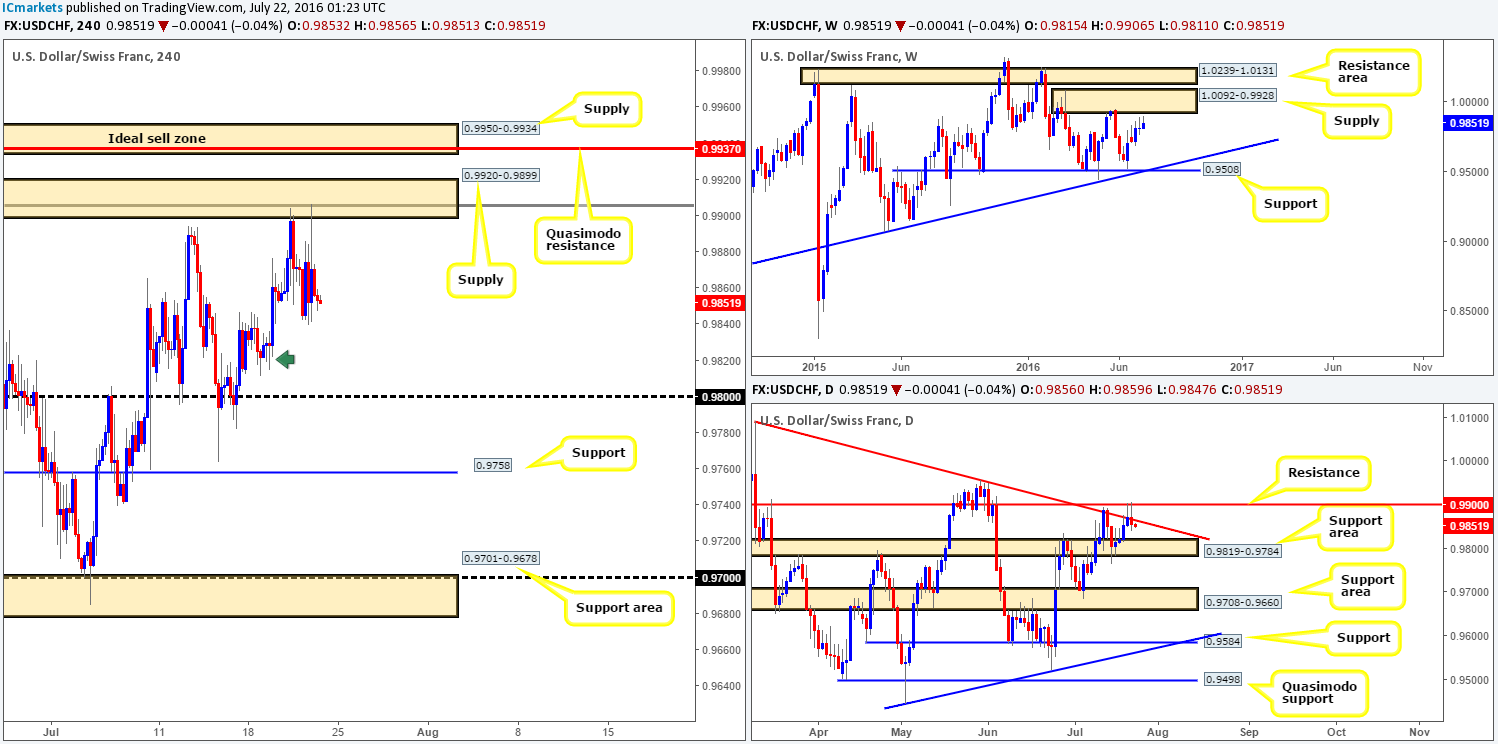
USD/CHF:
Other than a spike north up to the H4 supply at 0.9920-0.9899 during yesterday’s US open, the Swissy spent the day consolidating within a relatively tight range fixed between 0.9875/0.9844. Now, given that this H4 supply is bolstered by a deep H4 88.6% Fib resistance at 0.9906, as well as the 0.99 handle which represents a daily resistance line (fuses with a daily trendline resistance taken from the high 1.0092), shorting this market is attractive. However, from current prices, the next H4 downside target is located around the 0.9811-0.9828 region – a H4 demand marked by a green arrow (located on top of a daily support area at 0.9819-0.9784 – the next downside target on the daily timeframe), which, as you can see, does not leave a lot of room to play with!
In addition to the above notes, let’s not forget that with weekly action loitering just ahead of a weekly supply zone coming in at 1.0092-0.9928, a push north could still take place. And given that the H4 supply zone seen at 0.9950-0.9934 is glued to the underside of the above said weekly supply zone, a short from here is high probability!
Our suggestions: Personally, the only area that really sparks our interest at the moment is the H4 supply we mentioned above at 0.9950-0.9934. Not only is it positioned around a weekly supply zone, but it also boasts a H4 Quasimodo resistance level painted at 0.9937.
Levels to watch/live orders:
- Buys: Flat (Stop loss: N/A).
- Sells: 0.9933 [Possible entry at market here depending on the time of day] (Stop loss: 0.9955).
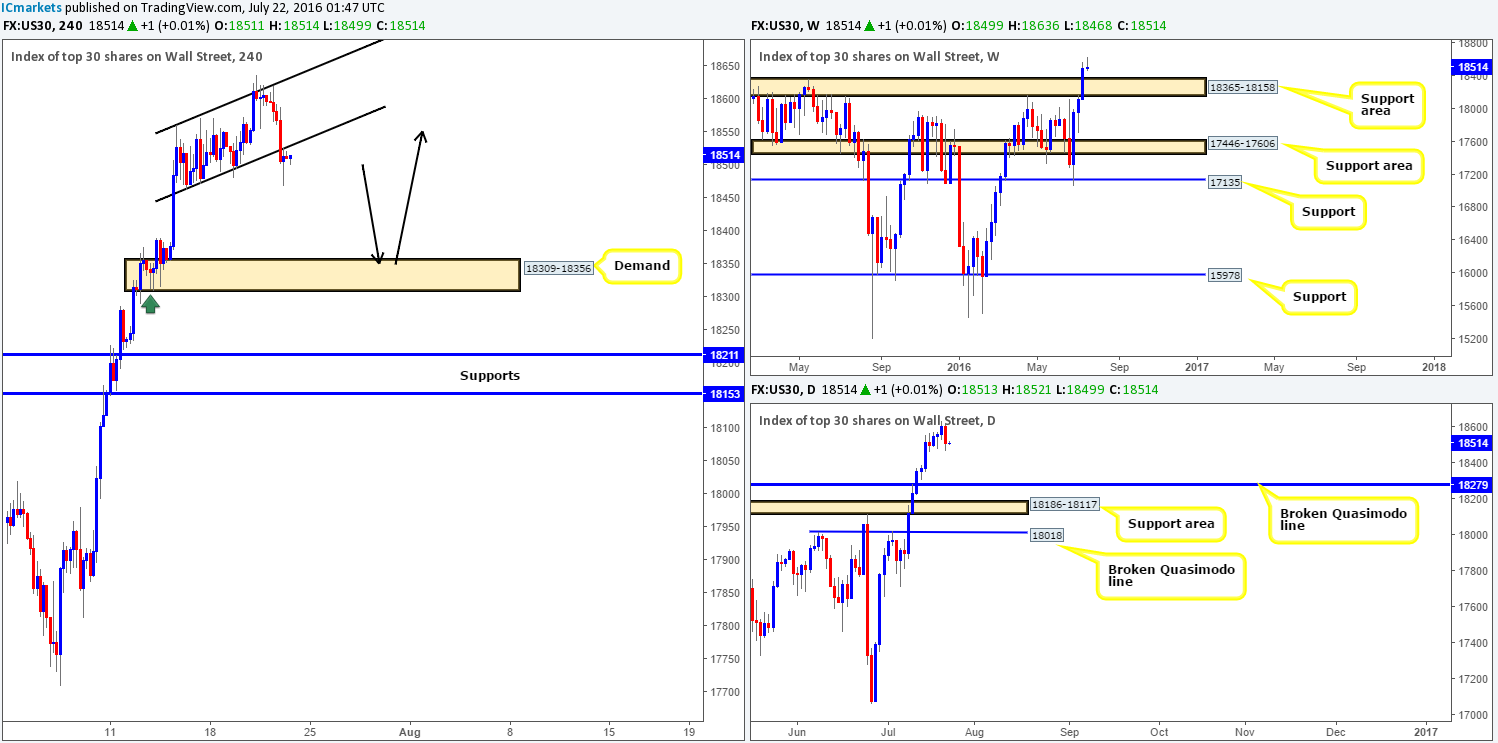
DOW 30:
US stocks plummeted yesterday, consequently wiping out both Wednesday and Thursday’s gains! This move also forced price to close below the H4 channel support line extended from the low 18462, which shortly after was retested as resistance. From a technical standpoint the DOW looks set to decline further today, potentially down to the H4 demand area at 18309-18356. This begs the question, is this move tradable? Well, given the remarkable strength the bulls have shown over the past three weeks, we would not feel comfortable selling here! Nevertheless, should a downward move come into view and price touches base with the aforementioned H4 demand area, a rotation is highly likely from this area. We say this because not only is this area housed within the recently broken weekly resistance area at 18365-18158 (now an acting support area), but it also sits just above a broken daily Quasimodo level at 18279. In addition to this, the tails seen marked on the H4 chart with a green arrow represent buying interest around this level, thus there is a strong possibility (given the higher timeframe picture as well) that there are unfilled orders still residing here.
Our suggestions: Despite this confluence, our team would still require a lower timeframe buy entry to form prior to risking capital on a long from the current H4 demand, due to the possibility that price may fake beyond the aforementioned H4 demand into the broken daily Quasimodo line.
Levels to watch/live orders:
- Buys: 18309-18356 [Tentative – confirmation required] (Stop loss: dependent on where one confirms this area).
- Sells: Flat (Stop loss: N/A).
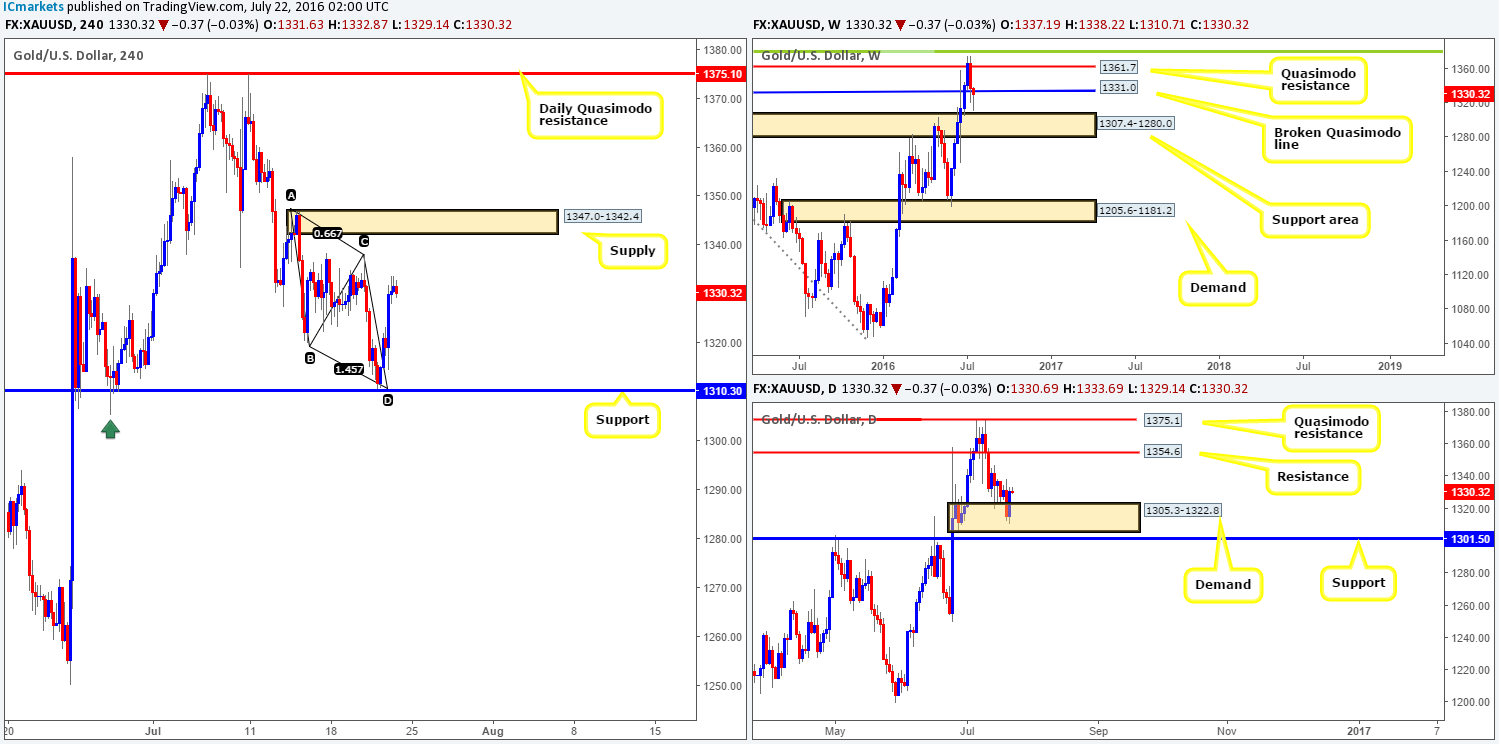
GOLD:
For those who read our yesterday’s report on gold, you may recall us mentioning that we took a long position at market from 1313.7, targeting the 1320.0 region, followed by the 1330.0 mark. As is shown on the chart, both take-profit targets were easily achieved, so well done to any of our readers who dived in this trade alongside us!
We were being relatively conservative with our take profits since we feel there is still room for this market to trade higher. The next upside target on the daily timeframe can be seen at 1354.6 – a daily resistance level, and should the weekly candle close above the broken weekly Quasimodo line at 1331.0, the next upside target here stretches up to 1361.7 – a weekly Quasimodo resistance.
Our suggestions: Other than our last trade call, we see very little opportunity to trade this pair today, as there are no clear definable barriers to trade from at the moment. With that in mind, our team will remain flat going into the weekend.
Levels to watch/live orders:
- Buys: Flat (Stop loss: N/A).
- Sells: Flat (Stop loss: N/A).


