
Key risk events today:
UK Retail Sales m/m; Eurozone, UK and US Flash Manufacturing and Flash Services PMIs; Canada Retail Sales m/m.
(Previous analysis as well as outside sources – italics).
EUR/USD:
Areas of consideration:
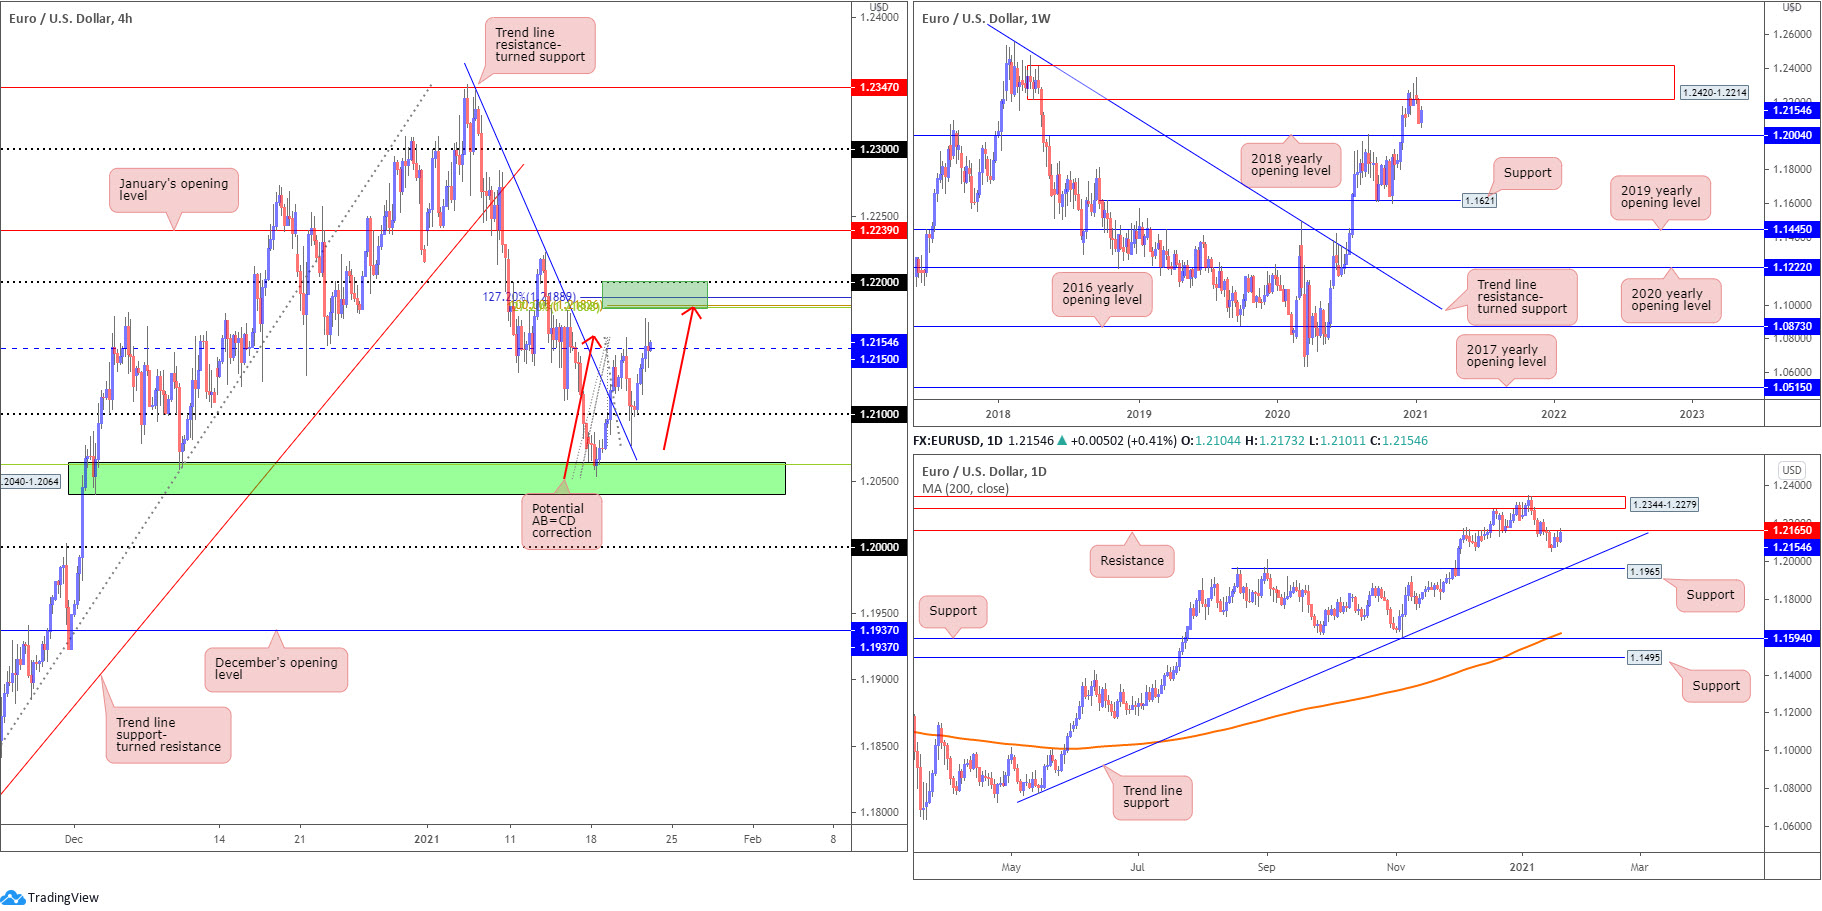
- The round number 1.21 and trend line support combination (taken from the high 1.2344) persuaded a short-term bullish scenario on Thursday, elevating EUR/USD to 1.2150 resistance. As can be seen from the H4 chart, buyers attempted to overthrow 1.2150, yet have failed to find acceptance above the level due to daily resistance priced in at 1.2165.
- Apart from daily resistance, H4 also shows an area of Fibonacci confluence set just south of 1.22 around 1.2184, together with an AB=CD bearish formation (red arrows). As such, between 1.22 and 1.2184 could be a resistance area sellers welcome today. In addition to this, the 1.22 figure is supported by the lower edge of weekly supply pictured at 1.2420-1.2214.
GBP/USD:
Areas of consideration:
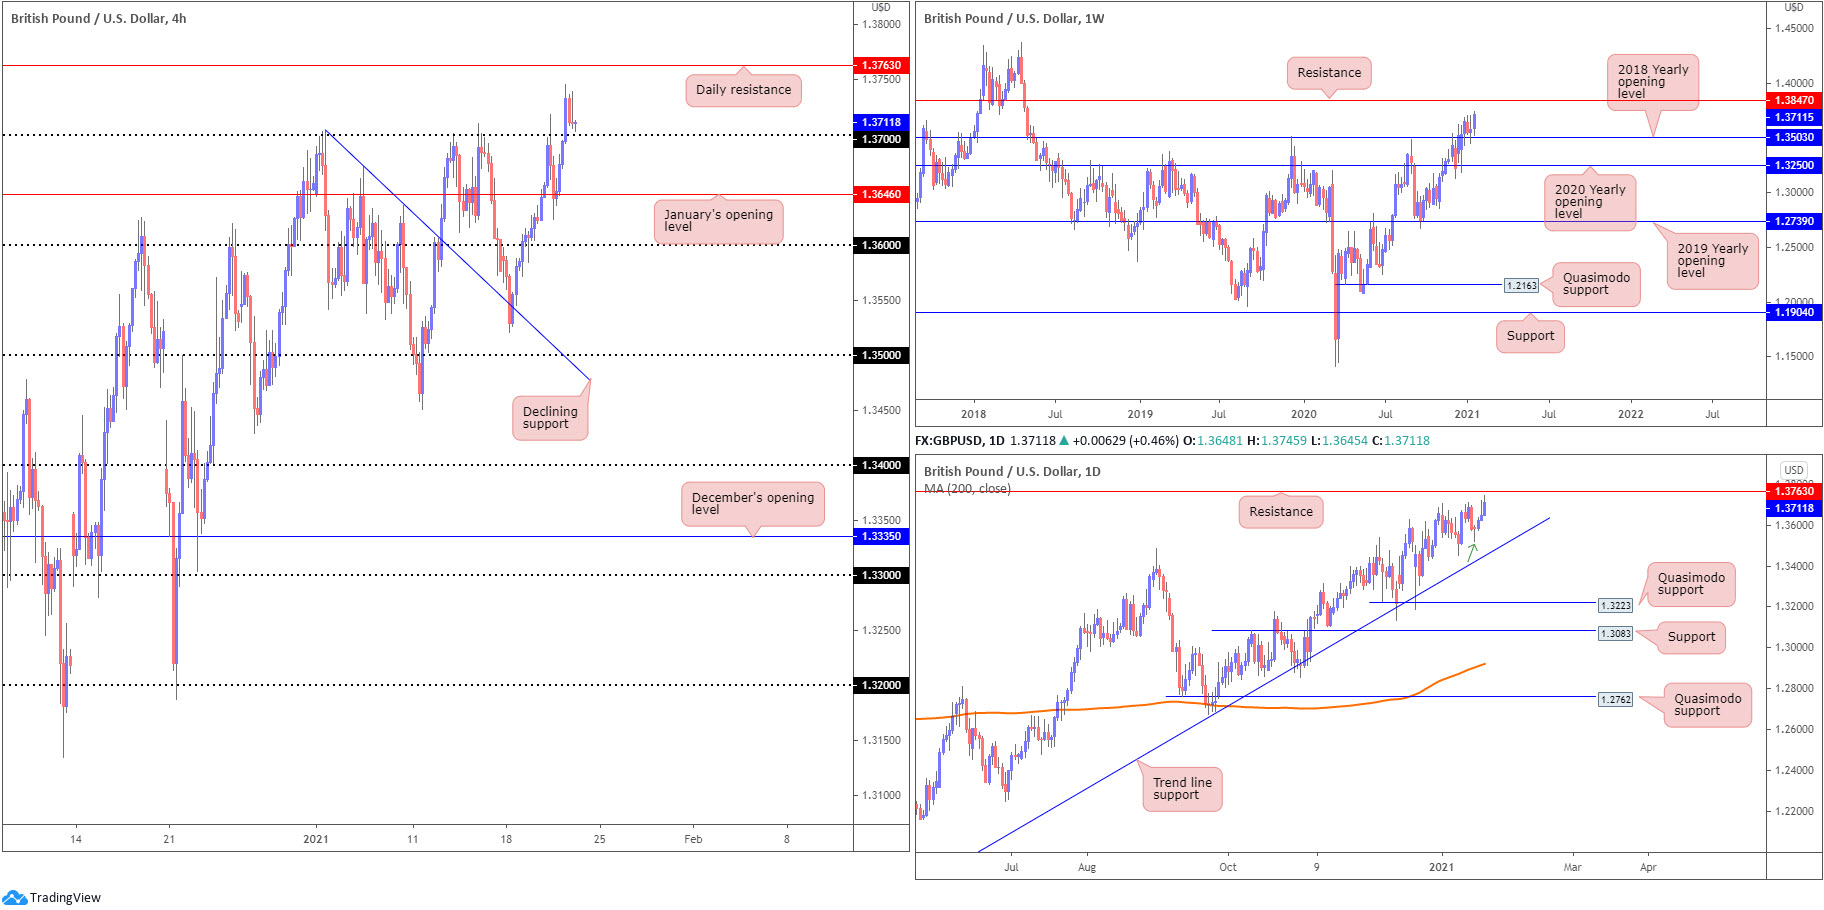
- Long-term flow—Weekly support at 1.3503 holding (2018 yearly opening value) and price recently registering fresh 2021 peaks, in a market trending higher since early 2020, places long-term buyers in a favourable position. In terms of resistance on the weekly timeframe, 1.3847 is likely on the radar.
- Price action on the daily timeframe, following the bullish pivot reversal formation (green arrow) earlier in the week, has seen price reach for higher levels on Thursday. Consequently, resistance at 1.3763 is in sight.
- 1.37 proved itself effective resistance since early January, though abandoned its position on Thursday. With H4 poised to retest 1.37 as support and daily price exhibiting scope to invade 1.3763, along with weekly targeting as far north as 1.3847, buyers may attempt to defend 1.37 today.
AUD/USD:
Areas of consideration:
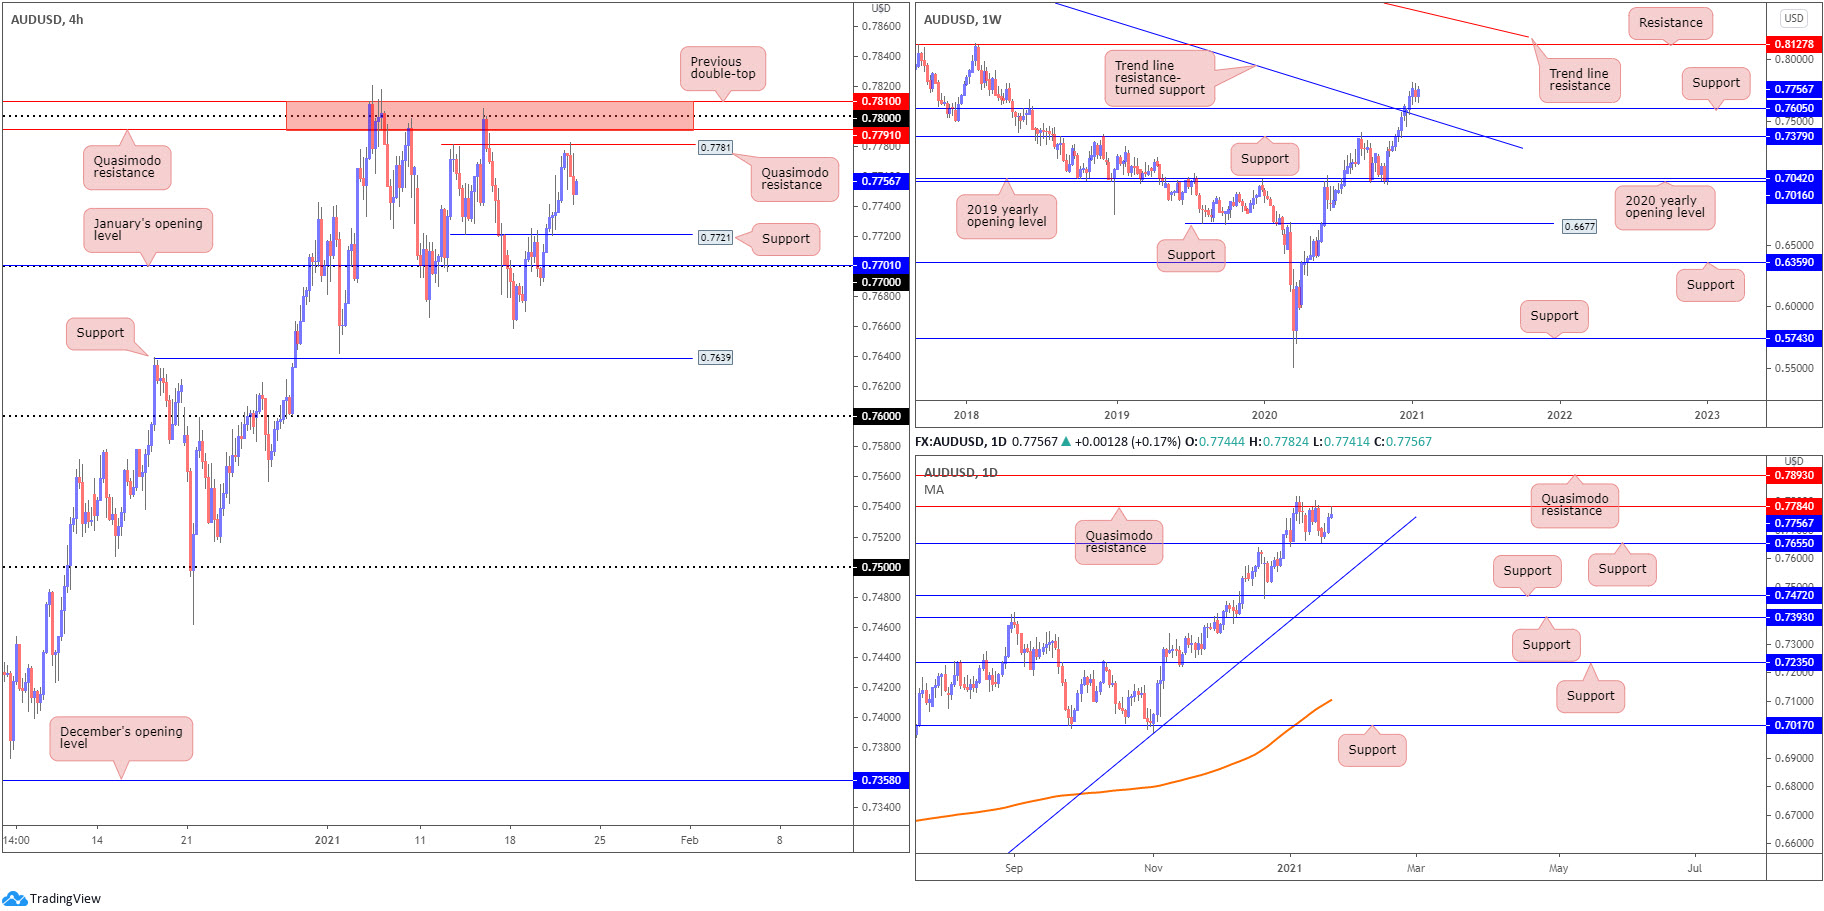
- H4 Quasimodo resistance at 0.7781, plotted just south of H4 resistance between 0.7810 and 0.7791, remains a noteworthy base. Interestingly, between the said resistance zone and H4 Quasimodo, we can also see a daily Quasimodo resistance at 0.7784. Therefore, 0.7810-0.7781 could be an area sellers keep on the watchlists.
- The trend has remained firmly higher since early 2020. In addition to this, the weekly timeframe shows price has room to reach as far north as resistance at 0.8127 (and the daily timeframe, beyond Quasimodo resistance, to around 0.7893 [another Quasimodo resistance]).
- Though before pushing higher on the weekly timeframe, a retest at weekly support drawn from 0.7605 (previous weekly Quasimodo resistance) could take shape. Consequently, 0.76 on the H4 scale is potentially interesting support. Also interesting, however, is the close connection between daily support at 0.7655 and H4 support at 0.7639.
USD/JPY:
Areas of consideration:
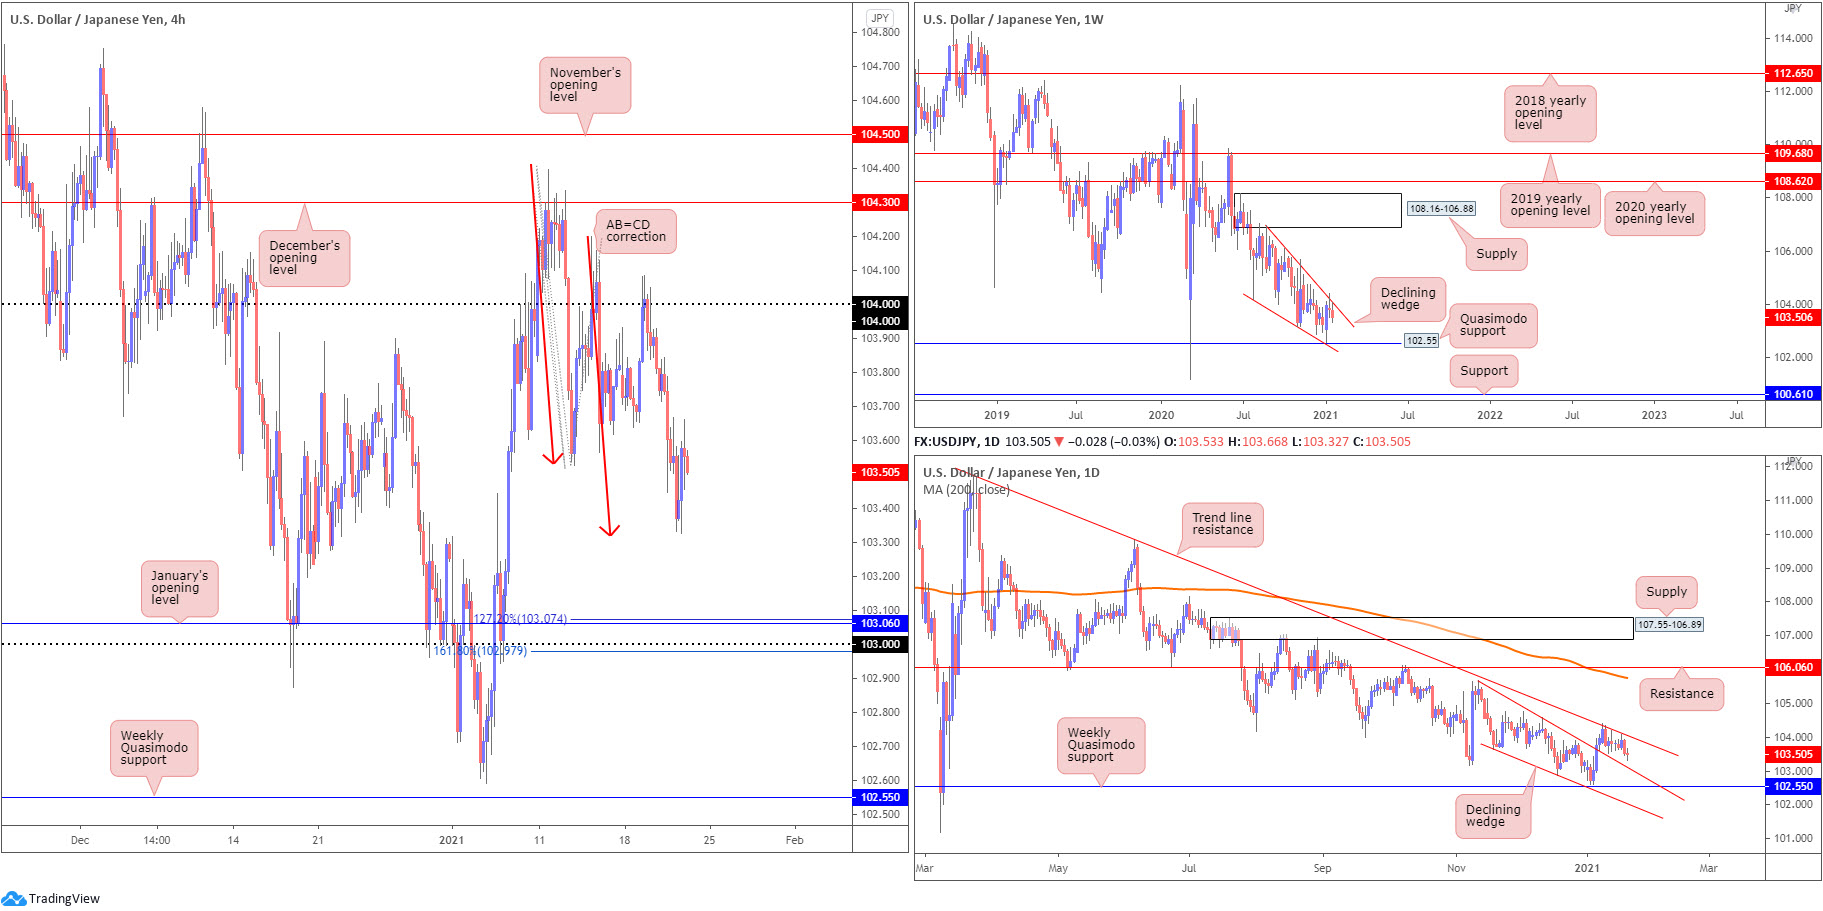
- Since connecting with the underside of weekly supply at 108.16-106.88 in August (2020), price has gradually shifted lower and developed a weekly declining wedge (106.94/104.18). Notably, price recently connected with the upper edge of this pattern, which also fuses with daily trend line resistance, extended from the high 111.71.
- Technically, the higher timeframe picture elevated the appeal of 104 as a resistance on the H4, causing the pair to seek lower levels on Wednesday. Thursday, nonetheless, echoed a somewhat indecisive tone and fashioned an indecision doji candle on the daily timeframe.
- Although breaching 103.52 (January 13 low) could have price target the upper boundary of the penetrated declining wedge (currently around 103.10) on the daily timeframe (taken from the high 105.67), H4 traders must contend with the AB=CD pattern (red arrows) at 103.32.
- Despite the H4 AB=CD, sellers are likely watching lower levels: the upper boundary of the penetrated declining wedge on the daily timeframe, followed by January’s opening value at 103.06 and the 103 figure (H4). Traders will also acknowledge the 127.2% Fibonacci extension point at 103.07 and a 161.8% Fibonacci projection point at 102.97.
USD/CAD:
Areas of consideration:
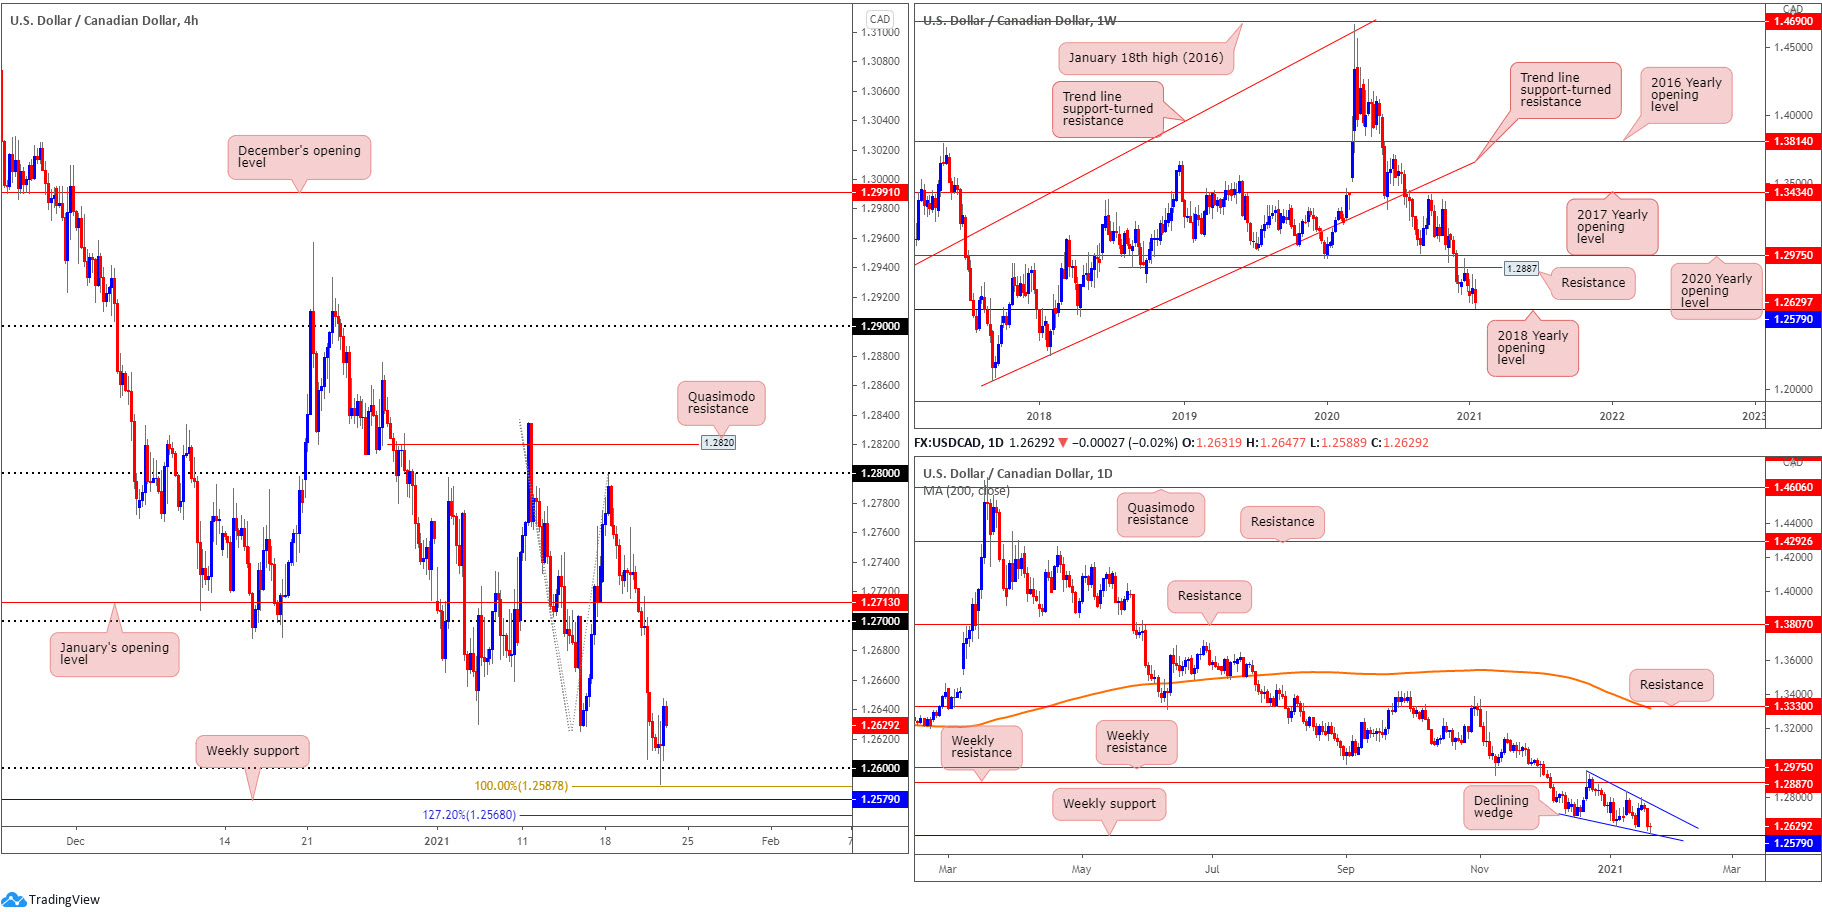
- In a market trending lower since March 2020, weekly price came within touching distance of the 2018 yearly opening value at 1.2579 on Thursday. This follows the retest of weekly resistance at 1.2887 in late December, a previous Quasimodo support level.
- On the daily timeframe, the declining wedge (1.2957/1.2688) is a pattern worth monitoring, forming in between the weekly support and resistance levels mentioned above.
- After USD/CAD chewed through 1.27 during mid-week trade, H4, as you can see, refreshed multi-month lows on Thursday and shook hands with the 1.26 figure, set just north of 1.2579 on the weekly scale (2018 yearly opening value) and H4 Fibonacci studies.
- The combination of stops under 1.26 on the H4, and a H4 127.2% Fibonacci projection point at 1.2568 and the 100% Fibonacci extension at 1.2587, along with weekly support at 1.2579, submits an area of support countertrend buyers may work with. Removing weekly support, on the other hand, potentially calls for lower levels.
USD/CHF:
Areas of consideration:
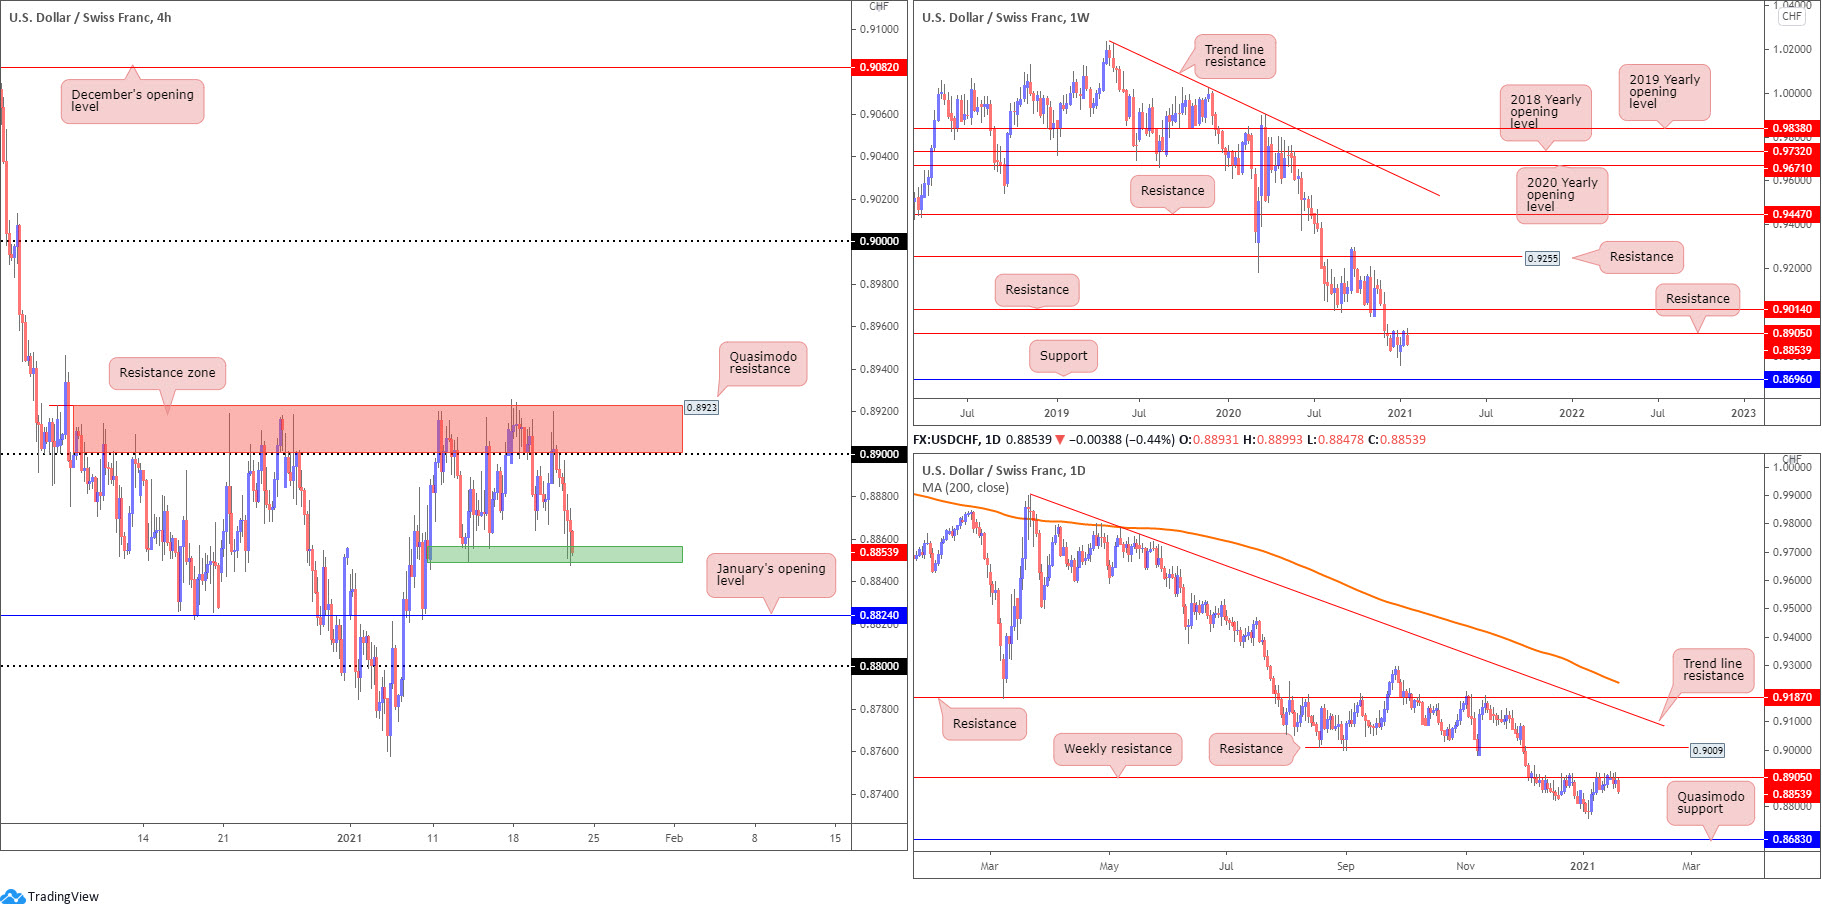
- H4 resistance at 0.8923-0.89, made up of a Quasimodo resistance and the 0.89 figure, has, as you can see, once again capped upside. Notably, this area is also connected with weekly resistance at 0.8905. This—coupled with a clear downtrend since April 2019—emphasises a technically bearish vibe. Downside targets on the H4 are seen at the 0.8850ish range (green), which is currently in play, closely followed by January’s opening value at 0.8824 and the 0.88 figure.
- Bearish scenarios may form should H4 close south of 0.8850. Although short-term downside targets rest between 0.8824 and 0.88, longer-term targets to be aware of are the multi-month troughs around 0.8757 (formed early January), with further selling to possibly take aim at weekly support drawn from 0.8696 and daily Quasimodo support at 0.8683.
Dow Jones Industrial Average:
The Dow Jones Industrial Average fell 12.37 points, or 0.04%; the S&P 500 rallied 1.22 points, or 0.03% and the Nasdaq advanced 73.67 points, or 0.55%.
Areas of consideration:
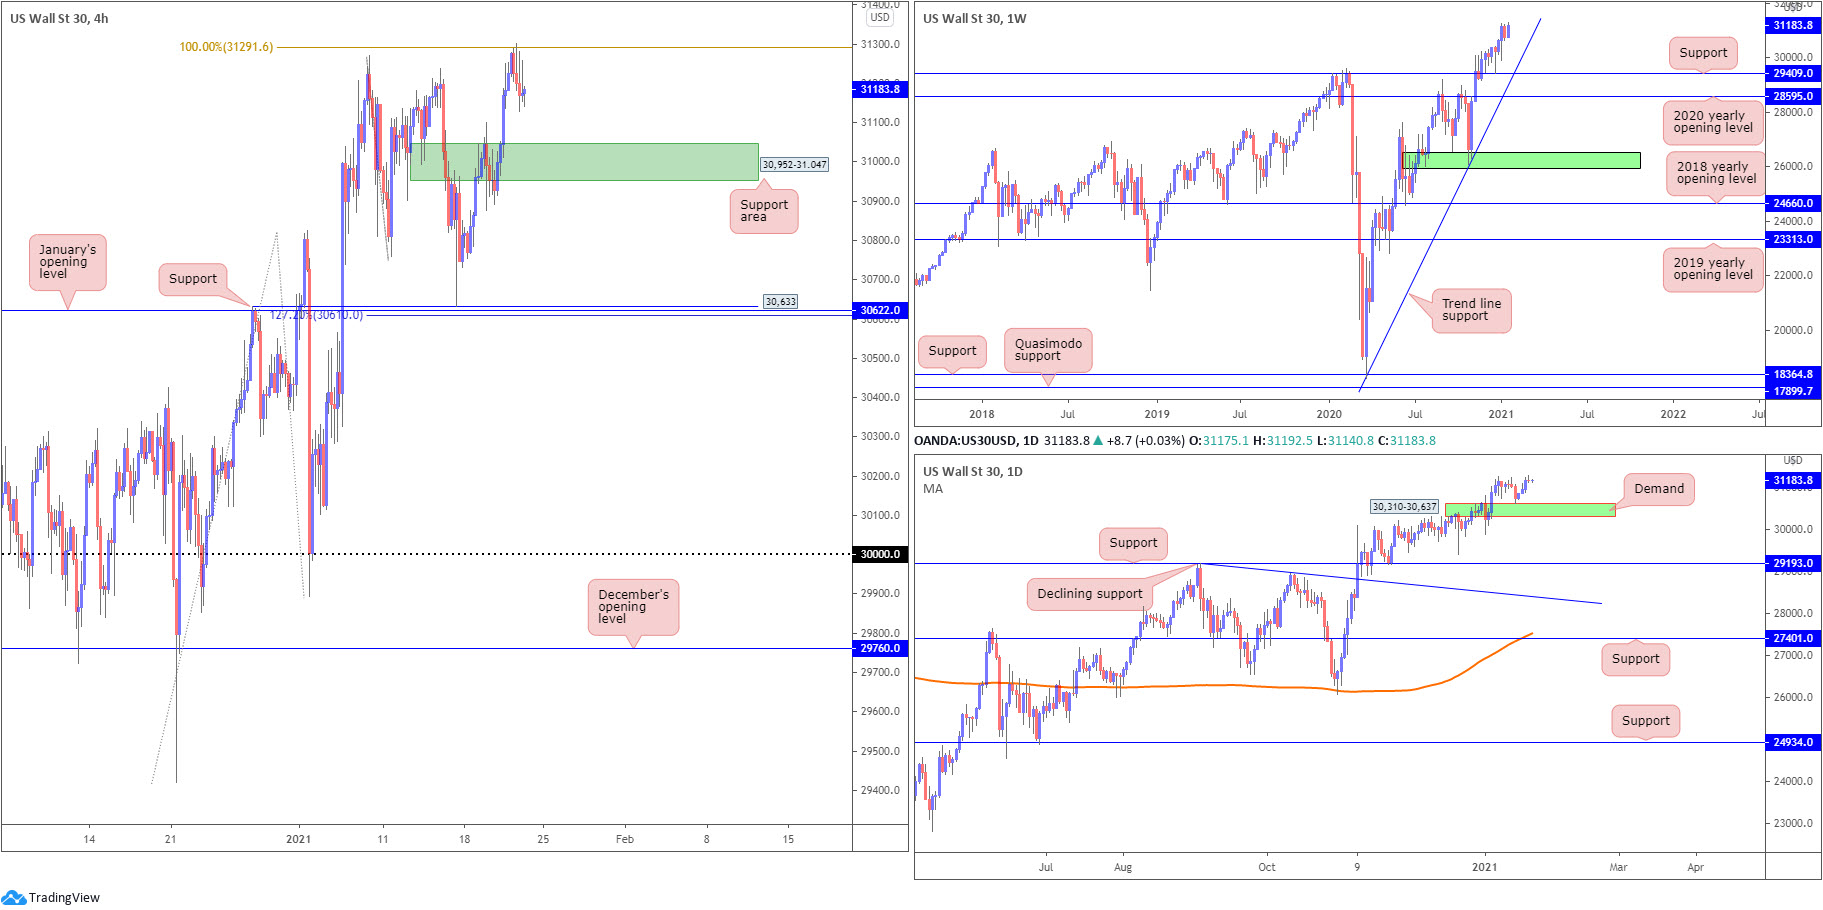
- Price action forged fresh all-time peaks at 31,301 on Thursday.
- As noted in previous analysis, the research team sees limited support in sight on the weekly timeframe until trend line support, extended from the low 18,213. Another nearby support to be aware of is 29,409, a previous Quasimodo resistance.
- Daily demand at 30,310-30,637 remains in the frame as a supportive base should a correction occur on the daily scale.
- From the H4 timeframe, technicians will acknowledge Thursday’s rejection off the 100% Fibonacci extension at 31,291, a move that highlights a support area at 30,952-31.047. This, given the DJIA forming fresh all-time peaks, is likely an area dip-buyers could target today.
- A H4 breakout above 31,291 may fuel a bullish breakout theme to refresh all-time peaks.
XAU/USD (GOLD):
Areas of consideration:
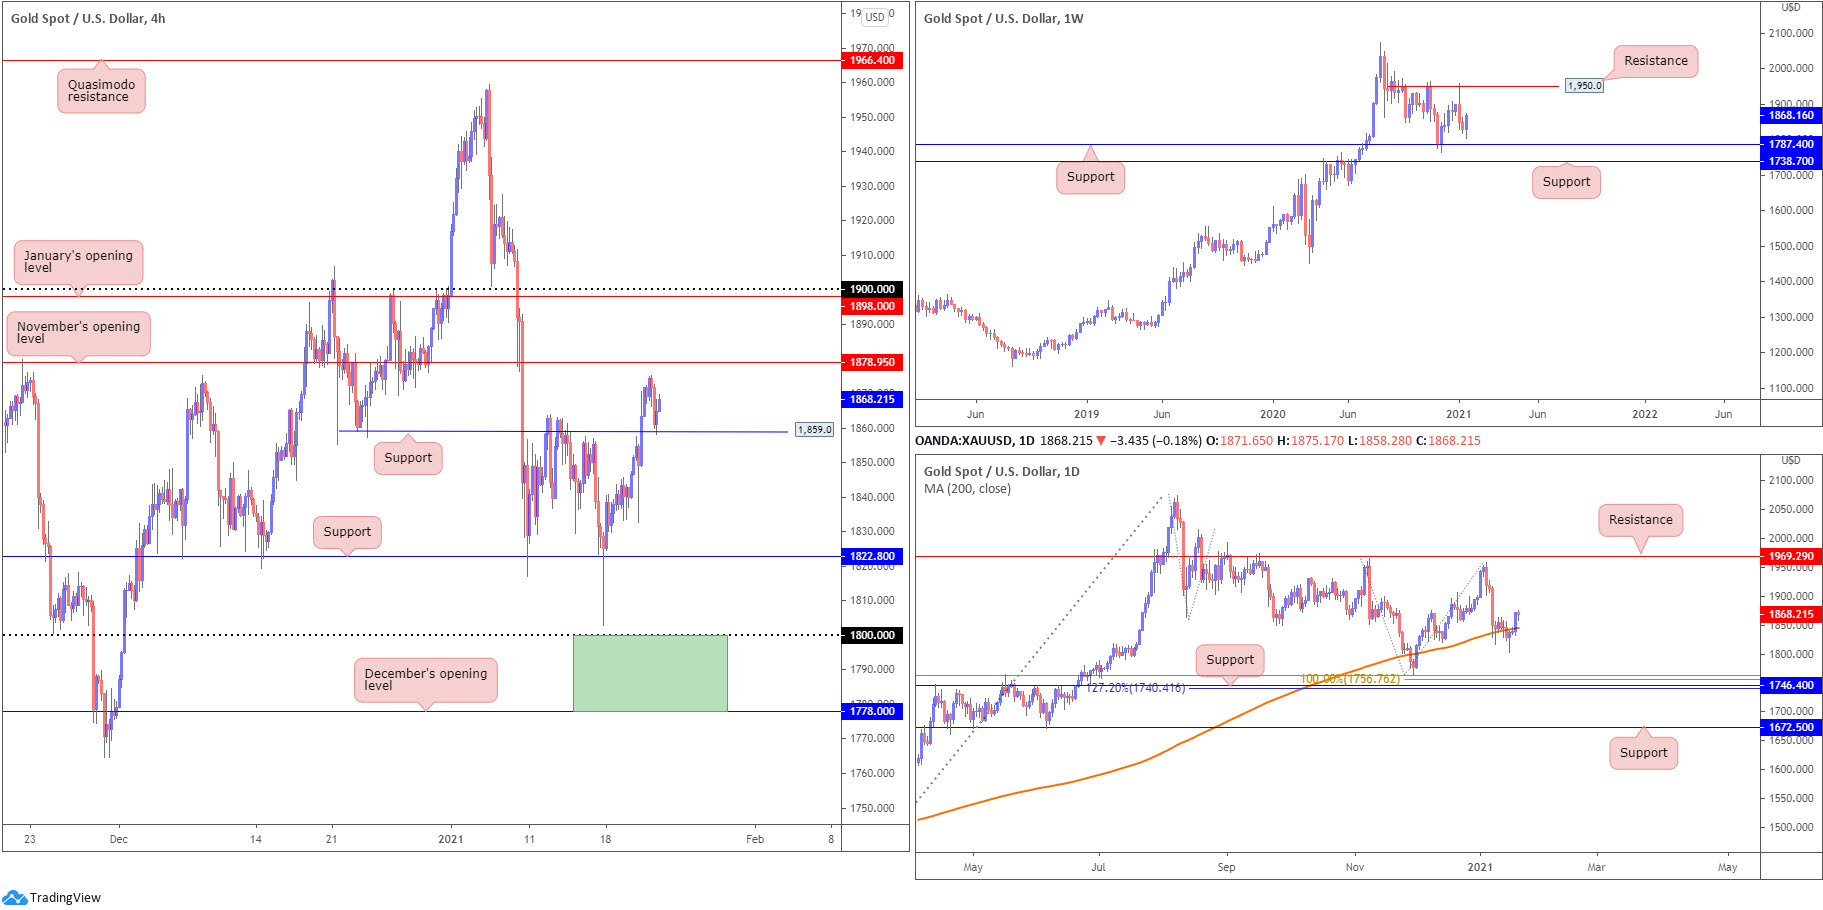
- The weekly timeframe, should buyers maintain an upside presence, is poised to finish the week snapping a two-week bearish phase in the form of a bullish outside reversal candle ahead of support at $1,787 (set just north of another support at $1,738). The next upside target on the weekly scale is fixed at $1,950 resistance.
- With the daily timeframe recently crossing above the 200-day SMA (orange – $1,845)—considered a bullish signal—and H4 retesting $1,859 as support, November’s opening value at $1,878 calls for attention on the H4 scale today, with a break exposing January’s opening value at $1,898 and the $1,900 figure.
- The above signals buyers could be ready for higher levels in gold, particularly in the short term, with $1,900 in the mix as an upside target. However, should longer-term buyers make a push, XAU/USD bulls could march for weekly resistance at $1,950 and possibly daily resistance at $1,969.
BTC/USD:
Areas of consideration:
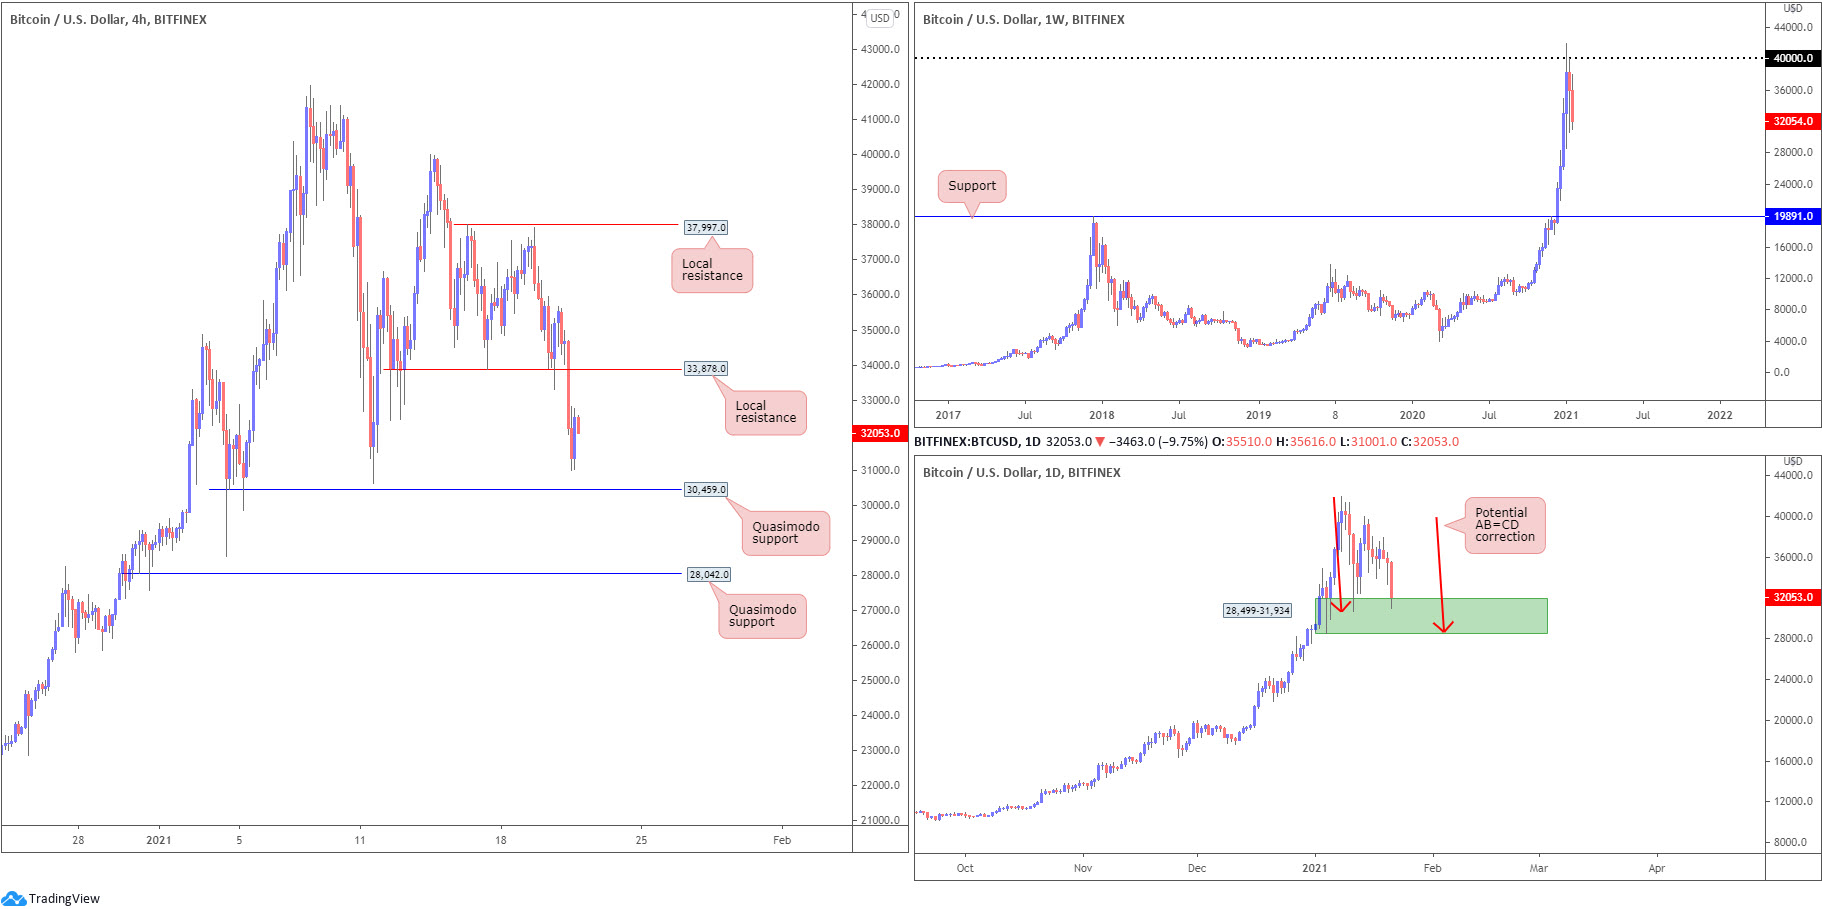
- The weekly timeframe shows sellers are making an appearance south of all-time peaks at $41,969, clearly capped by the $40,000 level. Given the aggressive climb throughout December, support, technically speaking, is limited until $19,891—the 2017 swing high.
- Despite weekly action finding $40,000 troublesome and threatening a possible correction to as far south as the $20,000 area, the trend in this market is firmly to the upside and daily candles are testing demand at $28,499-$31,934. Another technical observation is the daily AB=CD pattern in the process of forming that terminates around the lower edge of the aforementioned demand (red arrows).
- H4 removing support at $33,878 (now a serving resistance) shines the technical spotlight on two Quasimodo support levels at $30,459 and $28,042. The former is located within the aforementioned daily demand, while the latter is seen a touch outside the zone, closer to the daily AB=CD formation. Therefore, given the uptrend and daily demand, the two noted H4 Quasimodo levels are likely areas buyers are watching closely today.
The accuracy, completeness and timeliness of the information contained on this site cannot be guaranteed. IC Markets does not warranty, guarantee or make any representations, or assume any liability regarding financial results based on the use of the information in the site.
News, views, opinions, recommendations and other information obtained from sources outside of www.icmarkets.com.au, used in this site are believed to be reliable, but we cannot guarantee their accuracy or completeness. All such information is subject to change at any time without notice. IC Markets assumes no responsibility for the content of any linked site.
The fact that such links may exist does not indicate approval or endorsement of any material contained on any linked site. IC Markets is not liable for any harm caused by the transmission, through accessing the services or information on this site, of a computer virus, or other computer code or programming device that might be used to access, delete, damage, disable, disrupt or otherwise impede in any manner, the operation of the site or of any user’s software, hardware, data or property.


