
EUR/USD:
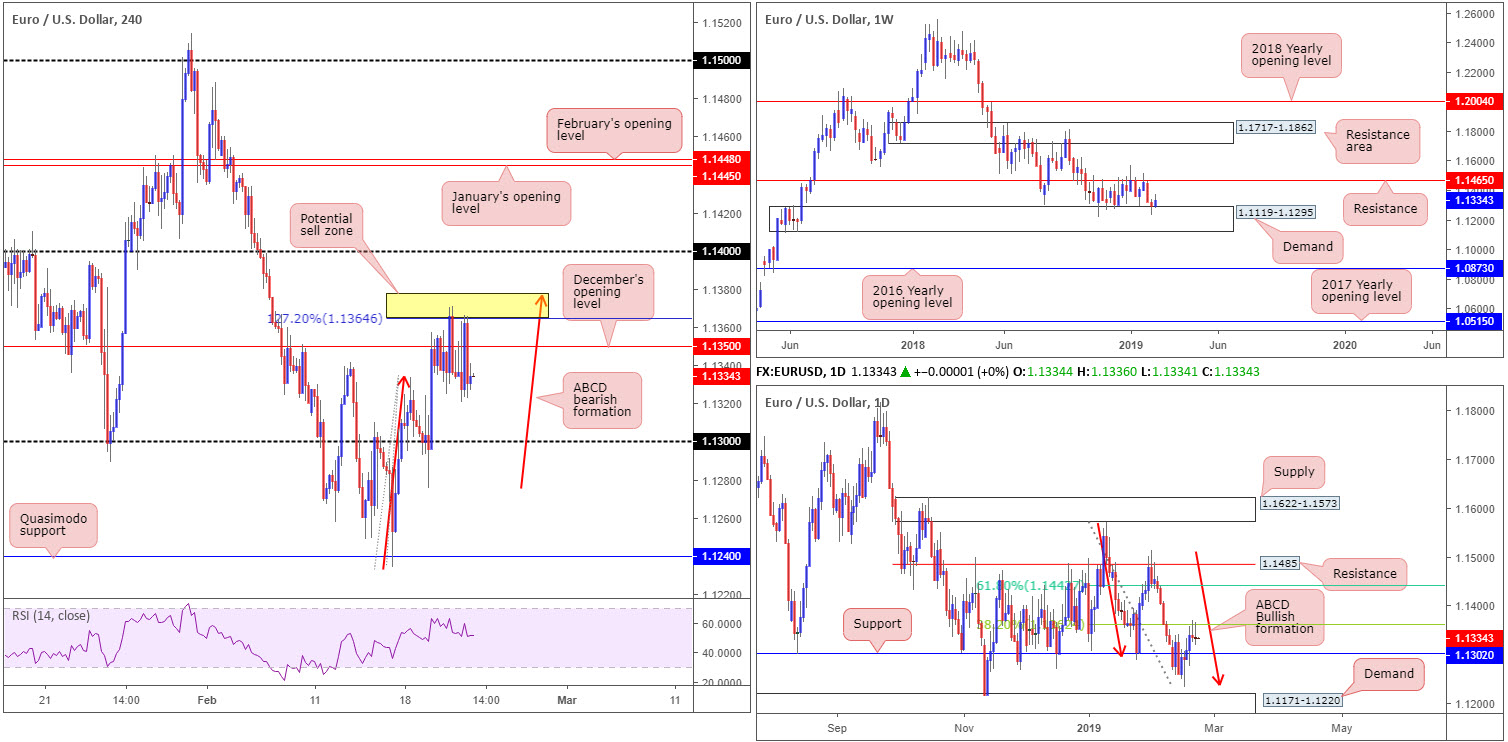
The euro concluded the day unchanged vs. the buck Thursday, though not before some choppy moves taking shape between the 1.1366 highs and 1.1320 lows, and weathering mixed Eurozone flash PMIs and disappointing US durable goods orders.
The H4 candles, as is evident from the chart, remain capped by the yellow zone marked at 1.1377/1.1364: a H4 127.2% ABCD (red arrows) pattern. Well done to any of our readers who managed to remain short this area throughout yesterday’s volatility, as this was a noted zone to watch in Wednesday’s piece for potential shorting opportunities.
Also highlighted in Wednesday’s briefing was the aforementioned H4 zone’s connection to the daily timeframe. Daily price, after Friday’s movement shook hands with an ABCD bullish completion point (red arrows) around 1.1240 and engulfed resistance at 1.1302 (now acting support) Monday, challenged a 38.2% Fibonacci resistance value at 1.1362 in recent trade. 1.1362 is actually the first take-profit target for many traders long the daily ABCD formation, which happens to merge with the H4 127.2% ABCD around 1.1377/1.1364.
Despite weekly price responding to the top edge of demand coming in at 1.1119-1.1295 (the lower edge of the current weekly range since late October 2018), the H4 candles remain establishing ground beneath December’s opening level at 1.1350, consequently exposing 1.13 as a viable support to watch in today’s sessions (fuses with daily support at 1.1302).
Areas of consideration:
As highlighted in Wednesday’s briefing, a move out of 1.1377/1.1364 on the H4 timeframe is likely to at least retest 1.13. For folks who missed the initial shorting opportunity, a retest play at the underside of December’s opening level drawn from 1.1350 (preferably in the shape of a H4 bearish pin-bar formation – entry/stops can then be defined based on this structure) could be a possibility today.
Today’s data points: German Ifo Business Climate; ECB President Draghi Speaks; FOMC Members Clarida, Bullard, Quarles and Williams Speaks.
GBP/USD:
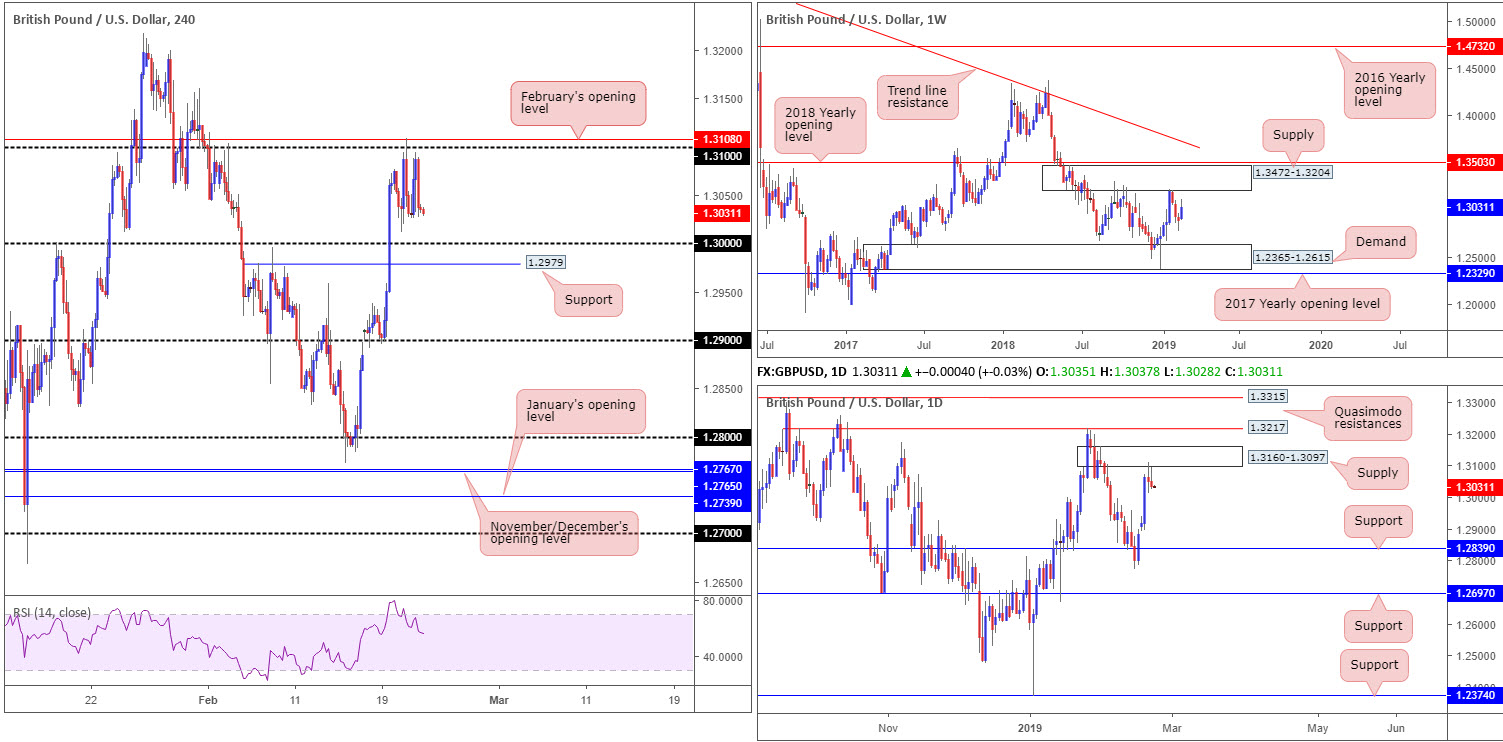
In similar fashion to the EUR/USD, Thursday’s action on the GBP/USD was just as volatile amid reports out of the UK and EU regarding further progress towards some kind of compromise on the Irish backstop, though unlikely to be delivered this week.
The pair chalked up highs a few pips south of its 1.31 handle into the early hours of US trade, though ended the day around familiar lows at 1.3025ish. The next downside target on the H4 scale falls in around key figure 1.30 and neighbouring support pencilled in at 1.2979. Another important point worth noting is daily supply coming in at 1.3160-1.3097, which elbowed its way into the mix Wednesday. Assuming sellers remain in the driving seat, support at 1.2839 is the next area of interest on this timeframe.
Areas of consideration:
With daily sellers recently entering the fold out of supply, a long play out of 1.30/H4 support at 1.2979 today remains somewhat fragile. However, given the 1.30 is a watched barrier in this market that might be sufficient to lure buyers in and bounce higher. Waiting for a H4 bullish candlestick pattern to develop is recommended, nevertheless, (entry/stop parameters can be defined according to this structure), not only because of where we’re coming from on the daily timeframe but also because round numbers are prone to stop runs (fakeouts).
Today’s data points: FOMC Members Clarida, Bullard, Quarles and Williams Speaks.
AUD/USD:
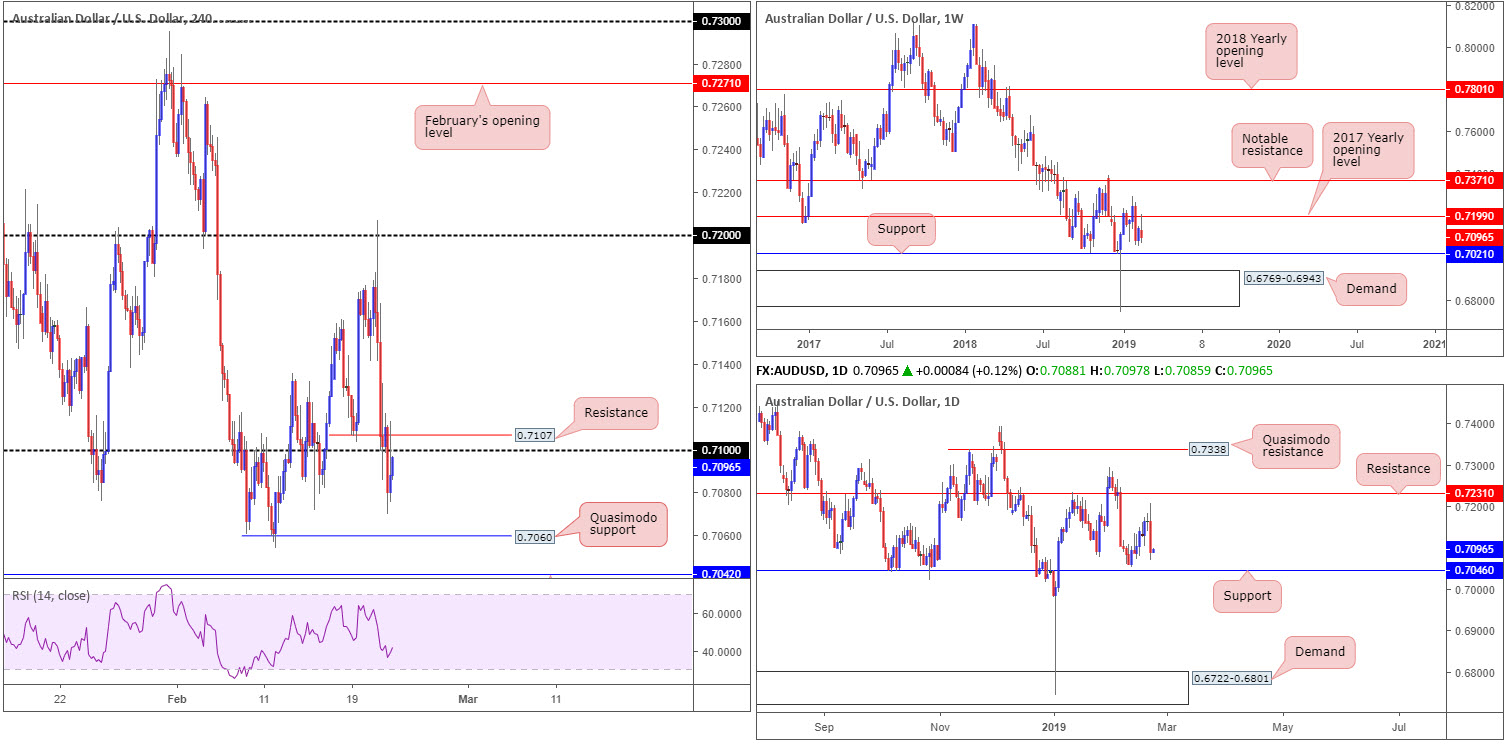
Despite a move north in early hours – propelled by upbeat Australian employment change – which ran through stop-loss orders above 0.72, the pair was caught off guard following China’s announcement to ban coal imports from Aus. This, coupled with a rising US dollar climbing above its 96.50 threshold and weekly price on the AUD/USD shaking hands with its 2017 yearly opening level residing around the 0.7199 region, pulled the market as far south as lows at 0.7069 Thursday.
Moving forward, the H4 candles are poised to challenge the underside of 0.71 this morning after failing to bring in buyers from Quasimodo support located at 0.7060. It might also be of interest to some traders to note daily support is positioned just south of the H4 Quasimodo at 0.7046.
Areas of consideration:
Seeing weekly price exhibiting scope to approach support at 0.7021, and daily price towards support drawn from 0.7046, a retest of the H4 resistance at 0.7107/0.71 handle is eyed today as a potential sell.
Targeting the H4 Quasimodo support at 0.7060 as an initial take-profit target, traders could attempt a short at 0.71 with a tight stop of around 15 pips. For those looking to add some confirmation to the mix, however, a sell from 0.71 on the back of a H4 bearish candlestick configuration could be an idea (entry/stop levels can be defined according to this pattern).
Today’s data points: FOMC Members Clarida, Bullard, Quarles and Williams Speaks.
USD/JPY:
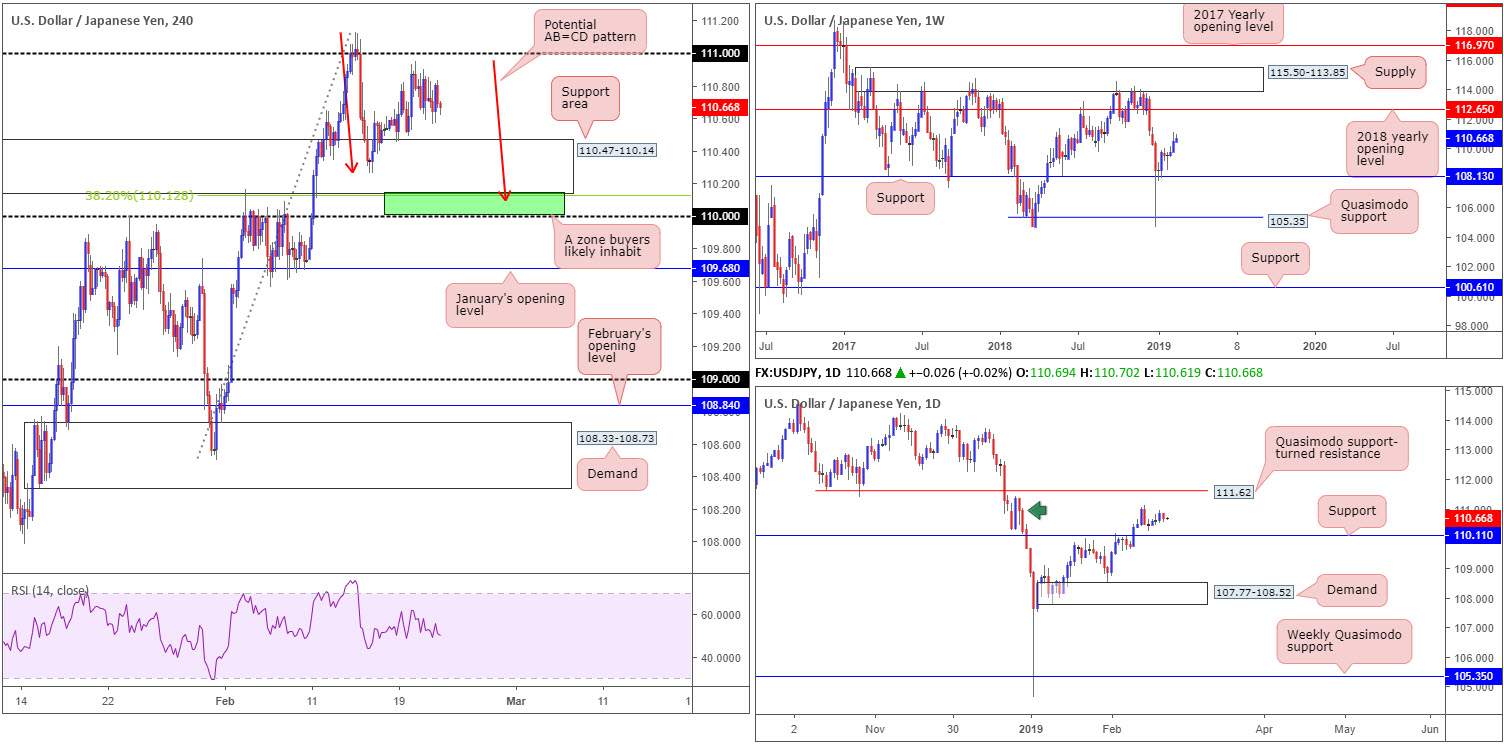
As demonstrated by way of H4 movement, the USD/JPY, despite disappointing US durable goods orders and a rising US dollar across the board, continued to reflect an indecisive stance around the top edge of a rather large H4 support area coming in at 110.47-110.14 Thursday.
Looking at the weekly timeframe, we can see USD/JPY bulls went on the offensive last week, achieving highs at 111.12. As long as the unit remains above support drawn from 108.13, upside on this timeframe is relatively free until connecting with its 2018 yearly opening level at 112.65.
Following last Thursday’s strong bearish rotation candle on the daily timeframe, the market has generated little follow-through movement. Surrounding structure consists of a supply area at 111.40-110.27 (green arrow), a support level coming in at 110.10 and a Quasimodo support-turned resistance at 111.62.
Beneath the current H4 support zone highlighted above, traders may also want to pencil in daily support mentioned at 110.11, shadowed closely by the 110 handle. Both levels boast relatively strong history, with the daily barrier positioned close by a 38.2% H4 Fibonacci support value at 110.12. In addition to this, a possible H4 AB=CD bullish pattern (red arrows) completion may take shape around 110.08.
Areas of consideration:
Having observed weekly action maintain somewhat of a bullish pose, as well as daily support plotted nearby at 110.11, the green zone marked on the H4 timeframe between 110/110.12 (the round number 110, the daily support at 110.11, the 38.2% H4 Fibonacci support at 110.12 and the H4 AB=CD bullish completion at 110.08) remains worthy of the watchlist today. The only caveat here, nevertheless, is the possibility of a stop run materialising through 110 (common viewing around psychological numbers) before an advance is seen. To help avoid being stung, waiting for additional H4 candlestick confirmation to form out of the zone is an idea (entry/stop levels can be defined according to the candlestick’s rules of engagement).
Today’s data points: FOMC Members Clarida, Bullard, Quarles and Williams Speaks.
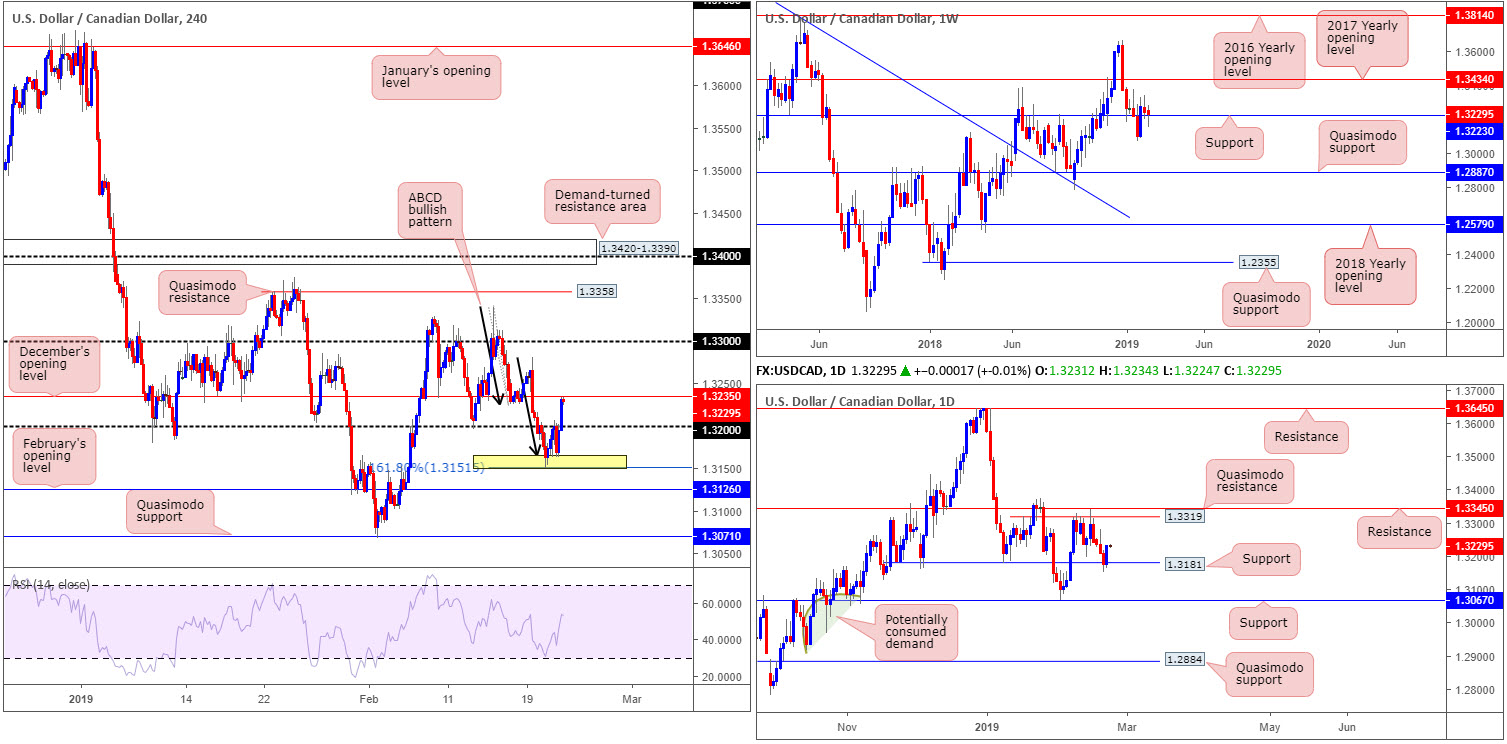
USD/CAD:
A combination of a strong buck along with WTI spinning lower (oil markets tend to correlate positively with the Canadian dollar) offered fresh impetus to the USD/CAD market Thursday.
Respecting the recently completed H4 ABCD (black arrows) bullish pattern (yellow) at 1.3151/1.3165, H4 action overthrew 1.32 amid US afternoon trade and, in recent hours, came within a pip of testing December’s opening level found at 1.3235. What’s also noteworthy from a technical perspective is the daily support level at 1.3181 recently entering the fold, and weekly price concluding yesterday’s session back above its support level coming in at 1.3223.
On account of the above, this may be enough to pull the unit higher today. Above December’s opening level mentioned at 1.3235, the 1.3281 Feb 19 high is visibly on the hit list as a possible upside objective, followed closely by the 1.33 handle. Note a few pips above this round number, daily Quasimodo resistance is also seen nearby at 1.3319, tailed by another layer of resistance at 1.3345.
Areas of consideration:
With the higher timeframes suggesting additional buying could be in store, entering long above 1.3235 on the H4 timeframe is an option. While a number of possibilities are available in terms of entry techniques, two well-known methods are either entering on the close of the breakout candle or waiting and seeing if a retest play occurs. The latter, particularly when accompanied with a H4 bullish candlestick pattern (entry/stop levels can be drawn from this structure), is considered the higher probability setup of the two.
Today’s data points: FOMC Members Clarida, Bullard, Quarles and Williams Speaks; Canadian Core Retail Sales m/m; Canadian Retail Sales m/m.
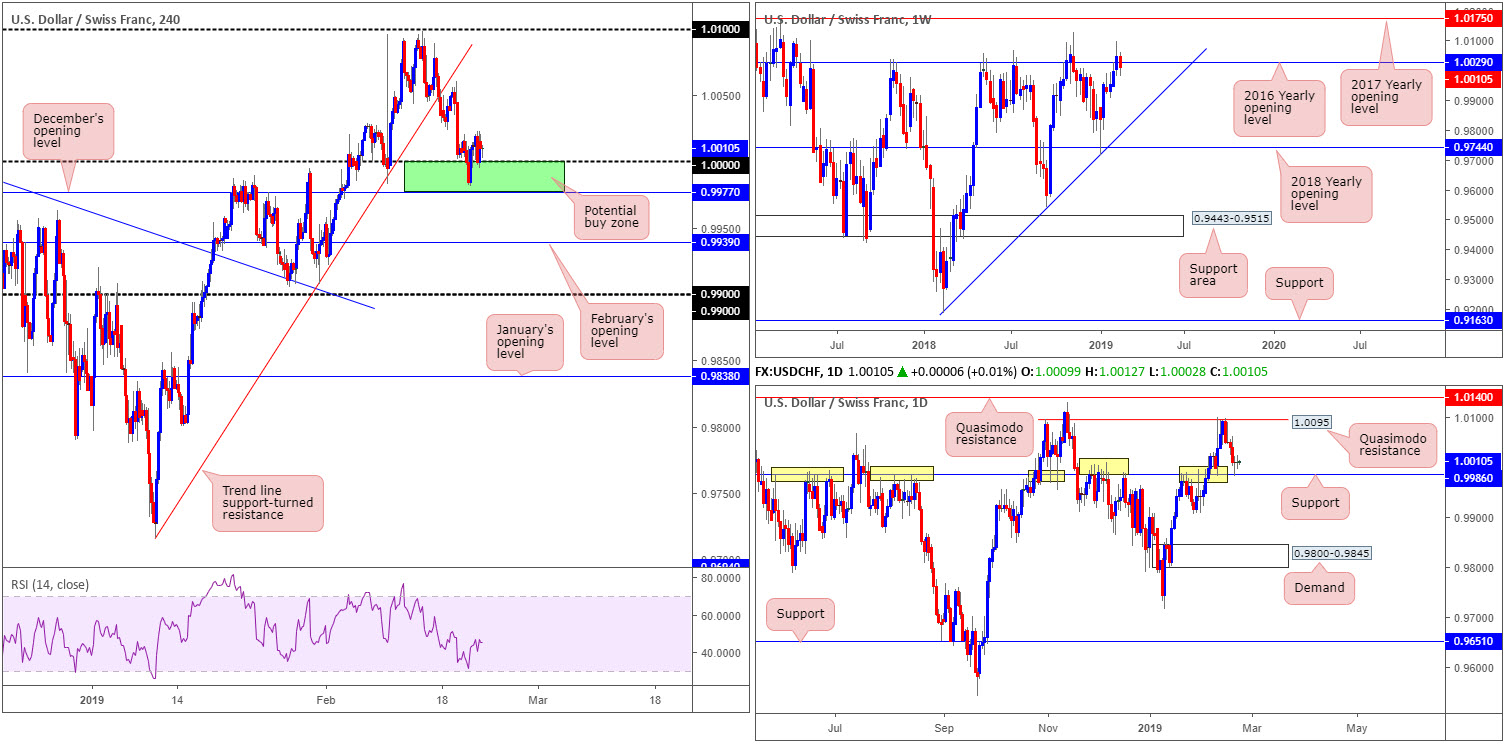
USD/CHF:
In spite of a sub-standard US durable goods orders reading Thursday, USD/CHF action remained somewhat sedated nearby 1.0000 (parity), visually presented by way of another daily indecision candle. As a consequence to this, the research team’s outlook put forward in Thursday’s briefing is unchanged going forward.
Alongside 1.0000 on the H4 timeframe, December’s opening level at 0.9977 as well as daily support coming in at 0.9986, collectively forms an appealing range of support (green). As highlighted in previous reports, while 0.9977/1.0000 may be a tempting location to consider buying this market from in view of its construction, traders are urged to take into account weekly price trading beneath its 2016 yearly opening level at 1.0029. The barrier’s history as a resistance is not to be overlooked.
Areas of consideration:
The combination of daily support mentioned above at 0.9986, December’s opening level at 0.9977 and 1.0000, together with H4 action chalking up a bullish engulfing formation on the back of Wednesday’s FOMC minutes, has likely enticed buyers into the market, despite the threat of weekly sellers residing above.
With stop-loss orders possibly tucked underneath December’s opening level, the initial upside target around 1.0050 appears a reasonably logical starting point, followed by the daily Quasimodo resistance at 1.0095.
Today’s data points: FOMC Members Clarida, Bullard, Quarles and Williams Speaks.
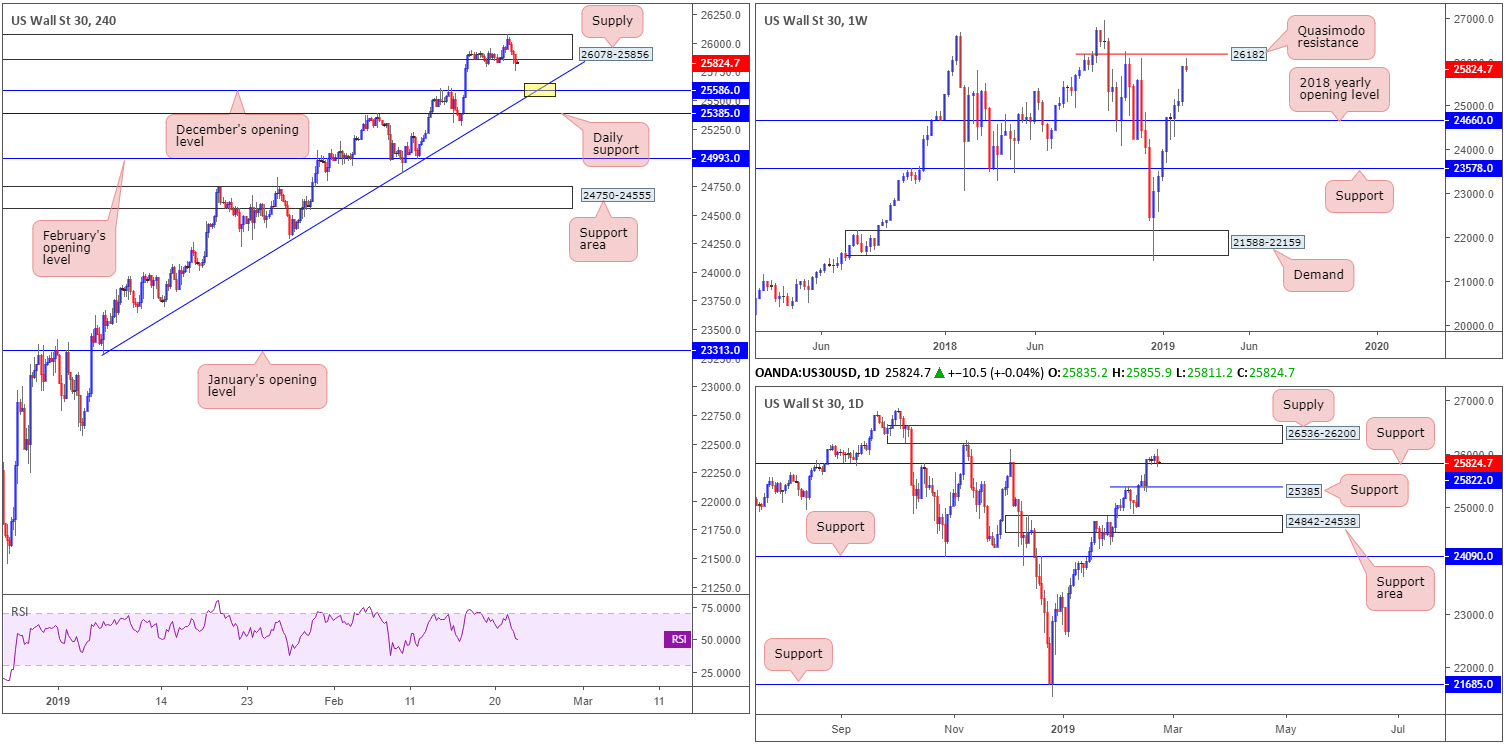
Dow Jones Industrial Average:
Regardless of the US and China reportedly making progress regarding trade, US equities rotated south Thursday. From a technical standpoint, weekly activity turned south just ahead of Quasimodo resistance parked at 26182. Should the weekly candle close as is: a bearish pin-bar formation, this may entice further selling next week. On the other side of the spectrum, daily price chalked up a clear-cut bearish engulfing candle yesterday, though failed to overthrow nearby support priced in at 25822. Should we probe beneath this number, however, nearby support rests at 25385.
A closer reading of price action on the H4 timeframe reveals the index marginally breached the top edge of supply coming in at 26078-25856, prior to reversing lower. The break of supply was unlikely enough to trip stops, according to our research team. Downside targets on this scale fall in around December’s opening level at 25586, shadowed closely by daily support mentioned above at 25385.
Areas of consideration:
With daily support at 25822 remaining in the fight, and weekly structure still displaying scope to the upside towards 26182, H4 sellers out of the current supply are likely to have a hard time pushing lower we feel. With that being the case, entering short this market is precarious.
As far as longs are concerned, though, a rotation from December’s opening level mentioned above at 25586 is a possibility worth exploring, particularly at the point the level merges with a H4 trend line support (taken from the low 23277 – yellow area). However, do bear in mind that by testing this level, daily price would break its current support, potentially attracting sellers into the market against your buy. For that reason, it is worth waiting and seeing how H4 action responds from 25586 prior to pulling the trigger. A H4 pin-bar formation printed from here, for example, shows buyer intent and also offers traders a structured pattern to base entry and stops from.
Today’s data points: FOMC Members Clarida, Bullard, Quarles and Williams Speaks.
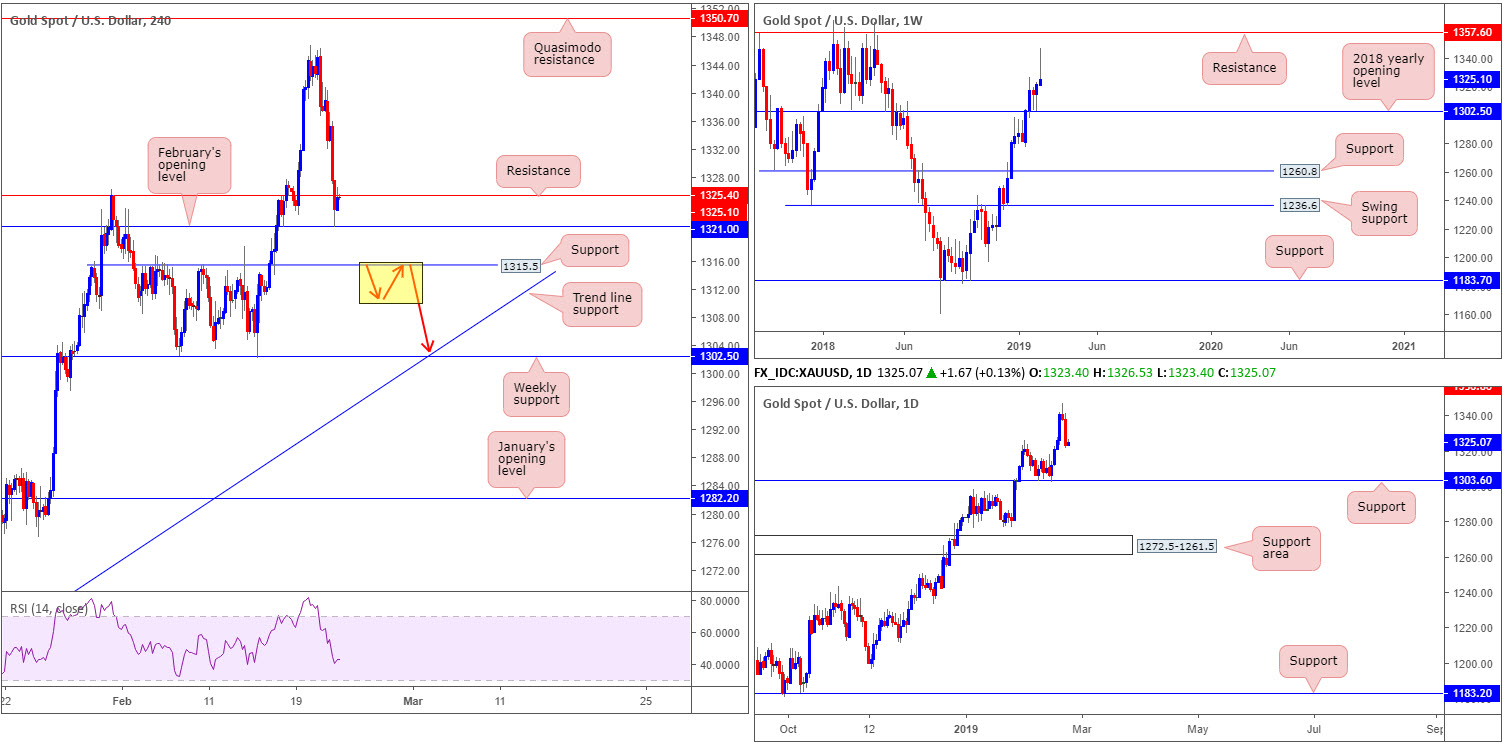
XAU/USD (GOLD):
Potentially influenced by tailwinds from the recent AUD/USD selloff, along with a sharp upsurge witnessed in US Treasury yields, bullion explored lower ground Thursday.
Extending lower for a second consecutive day, both weekly and daily price demonstrate room for further selling. Weekly action, currently trading in the shape of a bearish pin-bar pattern, has the 2018 yearly opening level at 1302.5 to target. Similarly, daily movement has eyes on support coming in at 1303.6.
Across the runway on the H4 timeframe, the recent bout of selling dethroned support at 1325.4 (now acting resistance) and tested February’s opening level to the pip at 1321.0, which, as you can see, held into the close. 1325.4, as a resistance, may hold given where medium-term direction on the bigger picture is pointing to at the moment, targeting support carved from 1315.5.
Areas of consideration:
With the higher-timeframe picture in mind, a sell from the current H4 resistance level at 1325.4 is an option, though not one boasting the highest probability. Waiting for H4 price to CLOSE beneath H4 support mentioned above at 1315.5 would, according to our technical studies, be the stronger setup given the lack of support present on the H4 until reaching the aforementioned weekly and daily supports.
While aggressive traders may enter short on the breakout candle and position stops above its wick, conservative traders may opt to wait and see if the unit retests 1315.3 as resistance before pulling the trigger (stop-loss orders can be sited above the rejecting candle’s wick).
The accuracy, completeness and timeliness of the information contained on this site cannot be guaranteed. IC Markets does not warranty, guarantee or make any representations, or assume any liability with regard to financial results based on the use of the information in the site.
News, views, opinions, recommendations and other information obtained from sources outside of www.icmarkets.com.au, used in this site are believed to be reliable, but we cannot guarantee their accuracy or completeness. All such information is subject to change at any time without notice. IC Markets assumes no responsibility for the content of any linked site. The fact that such links may exist does not indicate approval or endorsement of any material contained on any linked site.
IC Markets is not liable for any harm caused by the transmission, through accessing the services or information on this site, of a computer virus, or other computer code or programming device that might be used to access, delete, damage, disable, disrupt or otherwise impede in any manner, the operation of the site or of any user’s software, hardware, data or property.


