
Key risk events today:
Eurozone, UK and US Flash Services and Flash Manufacturing PMIs; Canada Core Retail Sales m/m and Retail Sales m/m.
(Previous analysis as well as outside sources – italics).
EUR/USD:
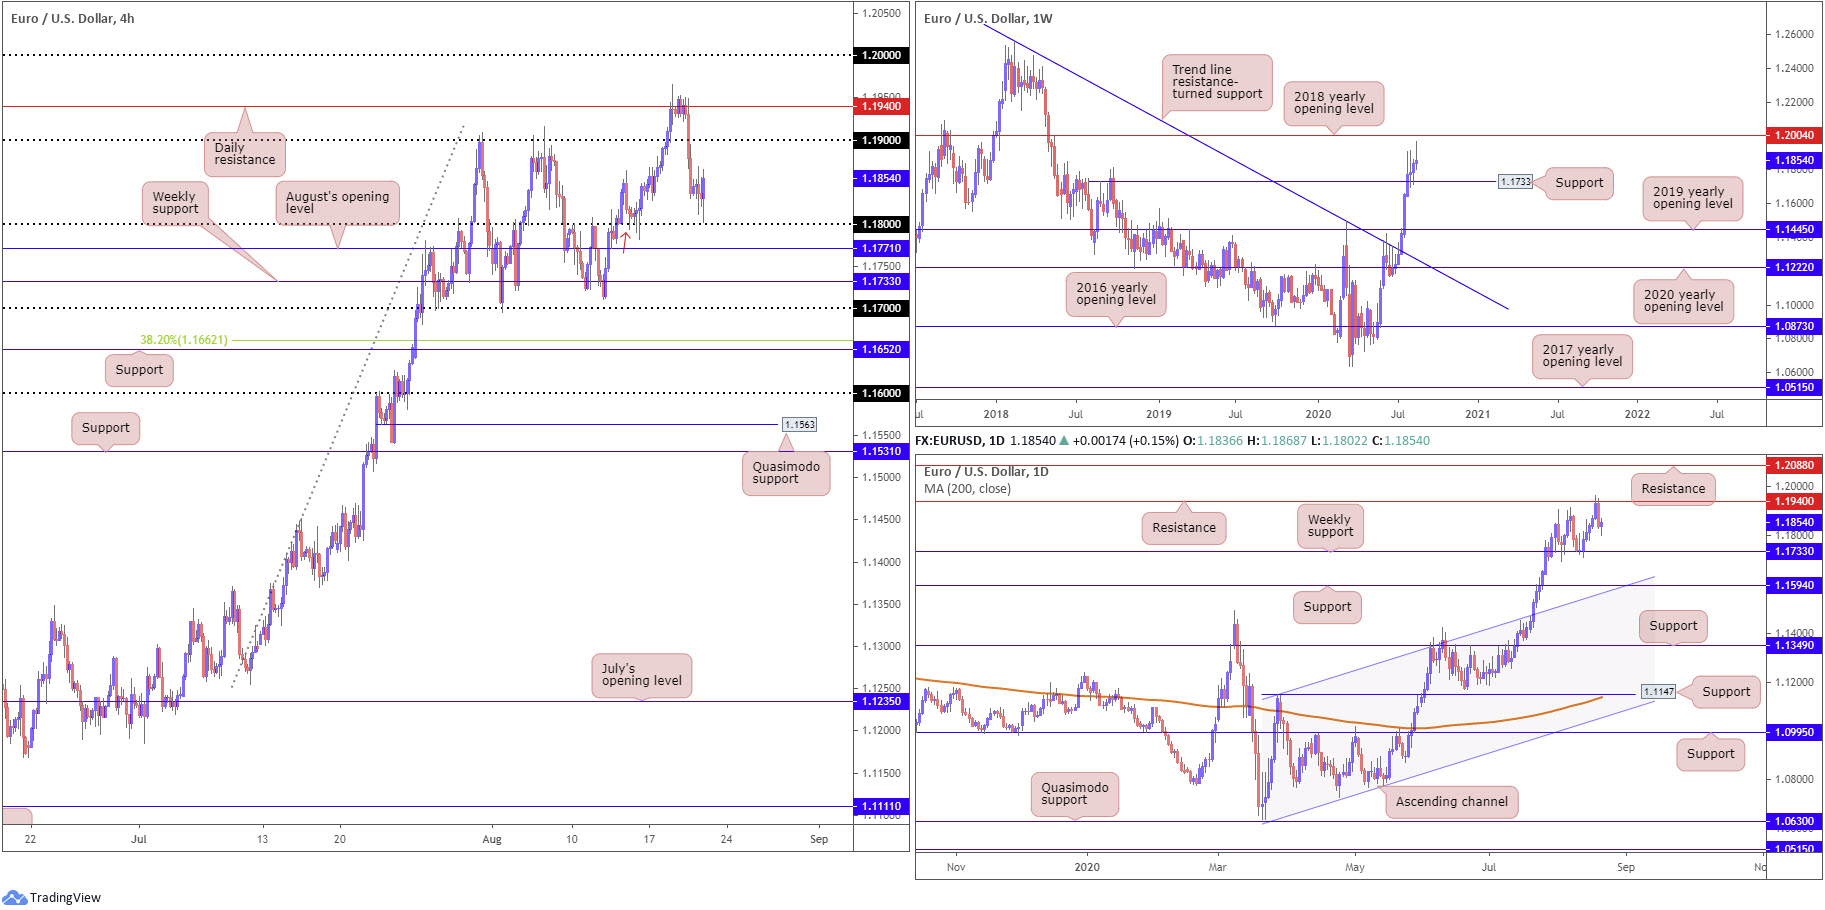
Europe’s shared currency clawed back earlier losses against the US dollar Thursday to trade marginally positive into US hours – the US dollar index dived back under 93.00, fading session highs at 93.24.
The 1.18 handle, based on the H4 timeframe, along with Quasimodo support coming in from 1.1793 (red arrow), came within a few pips of making an appearance, before buyers made a stand. Technically speaking, price is likely to continue to strengthen its grip today, potentially reconnecting with the 1.19 region.
Further afield, weekly price trades off best levels, on track to produce a shooting star pattern (bearish). Resistance is seen by way of the 2018 yearly opening level at 1.2004, while support can be found at 1.1733, a prior Quasimodo resistance level.
Daily resistance at 1.1940 was brought to attention Wednesday, snapping a six-day bullish phase, though Thursday failed to offer much follow-through movement. In terms of support on the daily timeframe, we can see the 1.1733 weekly level offers a logical platform to work with, followed by another layer of daily support at 1.1594 (coupled with channel resistance-turned support, taken from the high 1.1147).
Areas of consideration:
With limited support currently serving the higher timeframes, and Thursday’s action unwilling to commit to lower prices, the near-rebound off H4 Quasimodo support at 1.1793 and 1.18 base, in line with the current trend, could stir further buying back to 1.19 today.
However, should a retest at the 1.18 neighbourhood occur, a fakeout to August’s opening level at 1.1771 could be in store before buyers re-enter the fight.
GBP/USD:
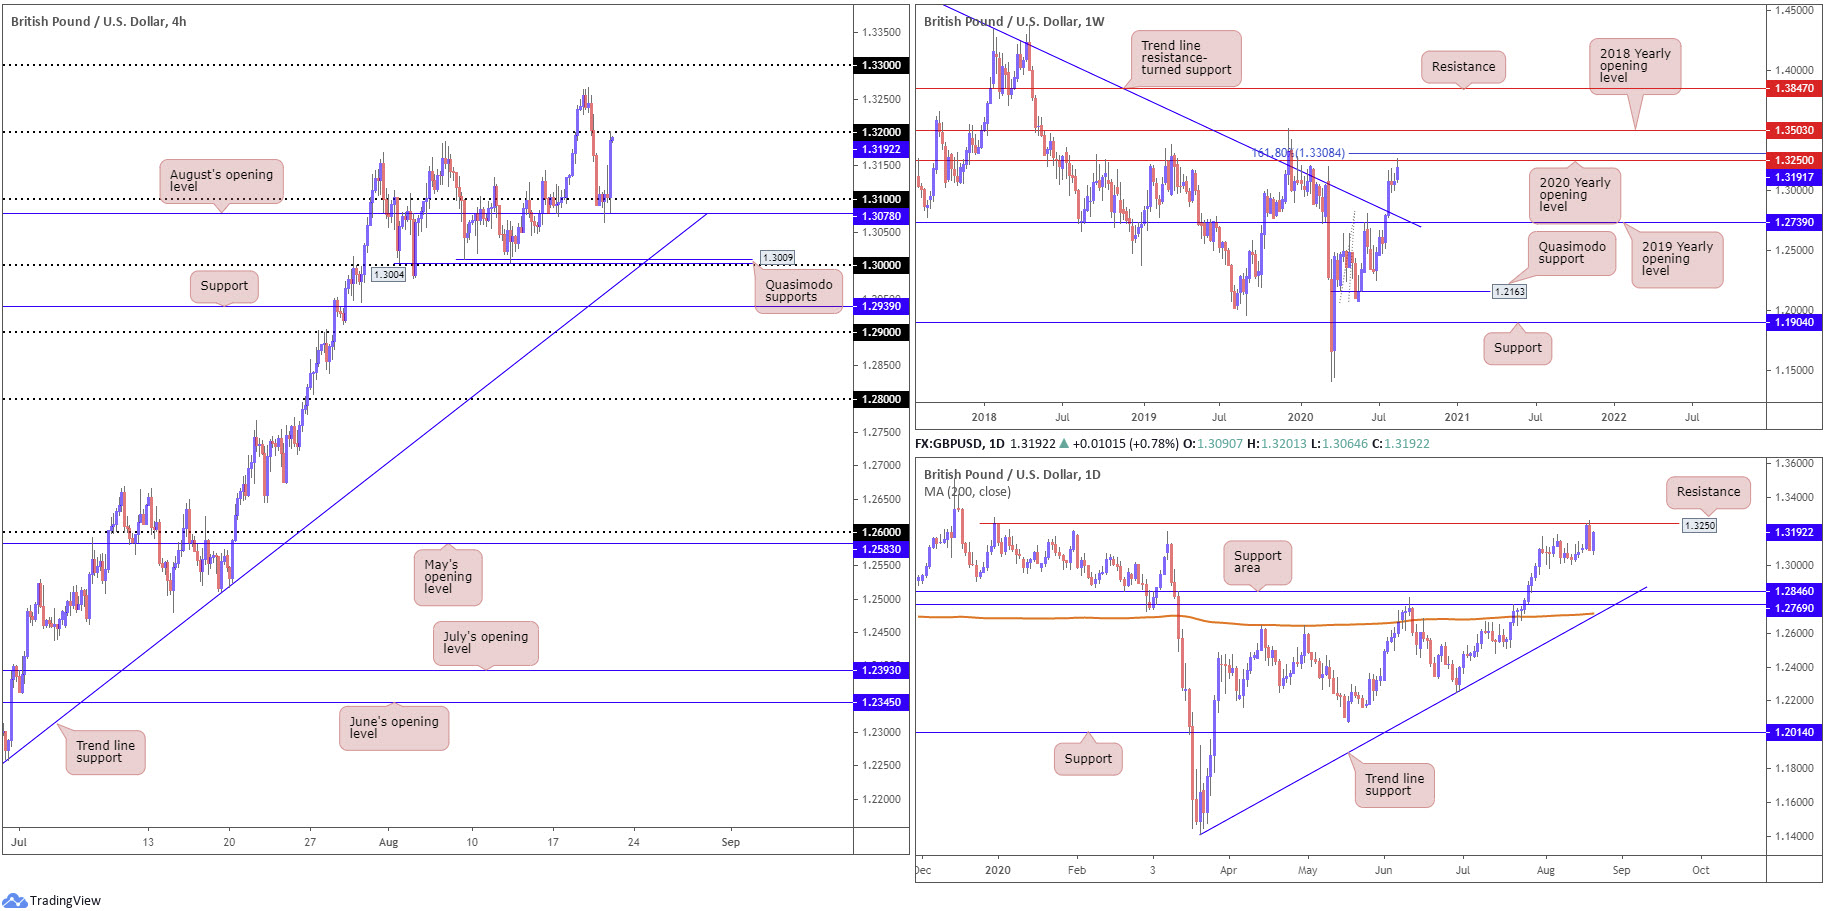
Sterling nursed earlier losses and some more on Thursday after whipsawing through 1.31 sell-stop liquidity and embracing August’s opening level at 1.3078 on the H4 timeframe. European trading closed testing the underside of the 1.32 handle, with a break here potentially liberating buyers back to weekly resistance at 1.3250, the 2020 yearly opening level. As a reminder, 1.3250 hampered breakout buying north of 1.32 earlier this week.
From the weekly timeframe, the July 27 trend line resistance (1.5930) break has likely stirred long-term bullish themes. Resistance, as mentioned above, is seen by way of the 2020 yearly opening level at 1.3250, closely stalked by a 161.8% Fibonacci extension point at 1.3308.
Daily resistance at 1.3250 was also thrown into the mix mid-week, a barrier sharing the same space with resistance on the weekly timeframe, the 2020 yearly opening level. Should sellers defend the current area, the spotlight shines on a support area between 1.2769/1.2846, via the daily timeframe.
Areas of consideration:
In conjunction with the current trend, higher since March, along with the recent trend line breach on the weekly timeframe, buyers may try their hand at breakout strategies should 1.32 on the H4 give way as resistance today. Upside targets fall in at 1.3250 on the weekly timeframe as an initial base, followed by the 161.8% Fibonacci extension point at 1.3308.
AUD/USD:
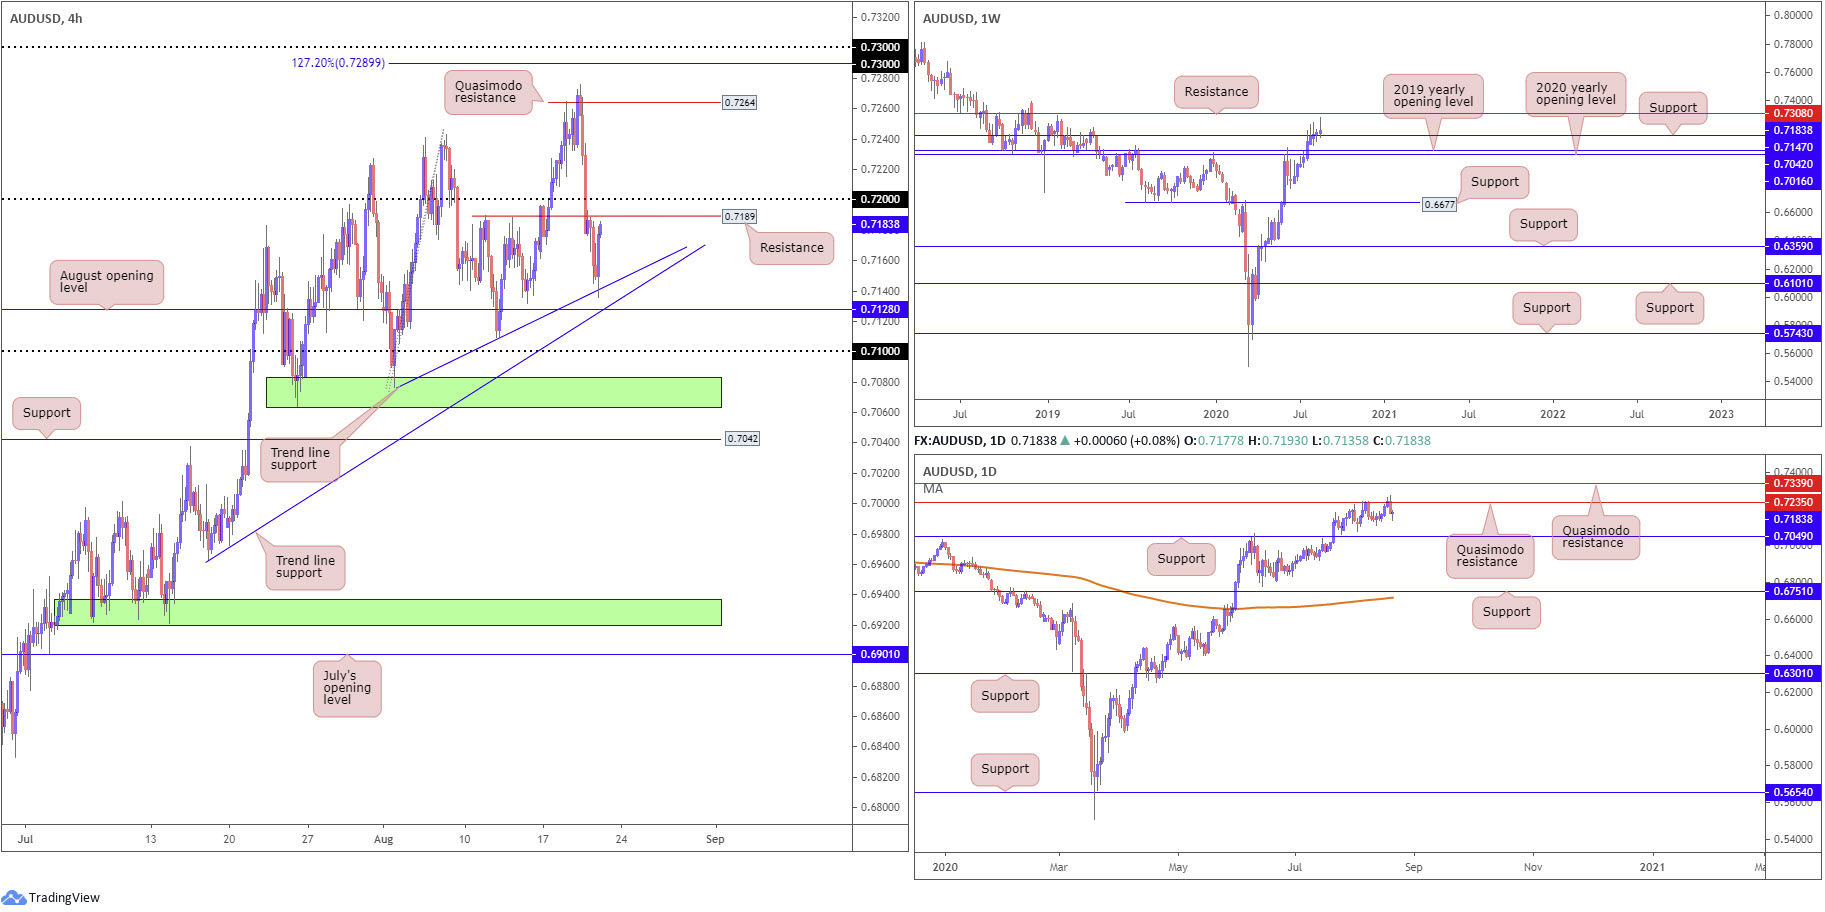
The Australian dollar wrapped up Thursday considerably off worst levels, reinforced on the back of upbeat risk sentiment and the US dollar index reclaiming 93.00 to the downside.
Yesterday’s upside move was also bolstered by weekly support at 0.7147, and converging local H4 trend line support, coming in from the low 0.7076. Technically, this is likely the reason behind H4 activity failing to reach the August’s opening level at 0.7128 and trend line support combination, drawn from the low 0.6963. Price, as you can see, is now closing in on H4 resistance at 0.7189, a level closely shadowed by the 0.72 handle. Multi-timeframe traders will also acknowledge resistance lurks at 0.7235 on the daily timeframe, in the shape of a Quasimodo formation.
Areas of consideration:
Lower timeframe traders could be watching for signs of bearish activity around the 0.72 region today, yet having noted daily Quasimodo resistance plotted at 0.7235, a short squeeze through 0.72 might be in store. This may have sellers enter the market, fuelled from buy-stops taken from above 0.72.
At the same time, a break of 0.72 will also likely appeal to breakout buyers, particularly to those noting weekly price rebounding from support at 0.7147. Should price overthrow 0.7235, H4 Quasimodo resistance at 0.7264 will likely be next in the firing range.
USD/JPY:
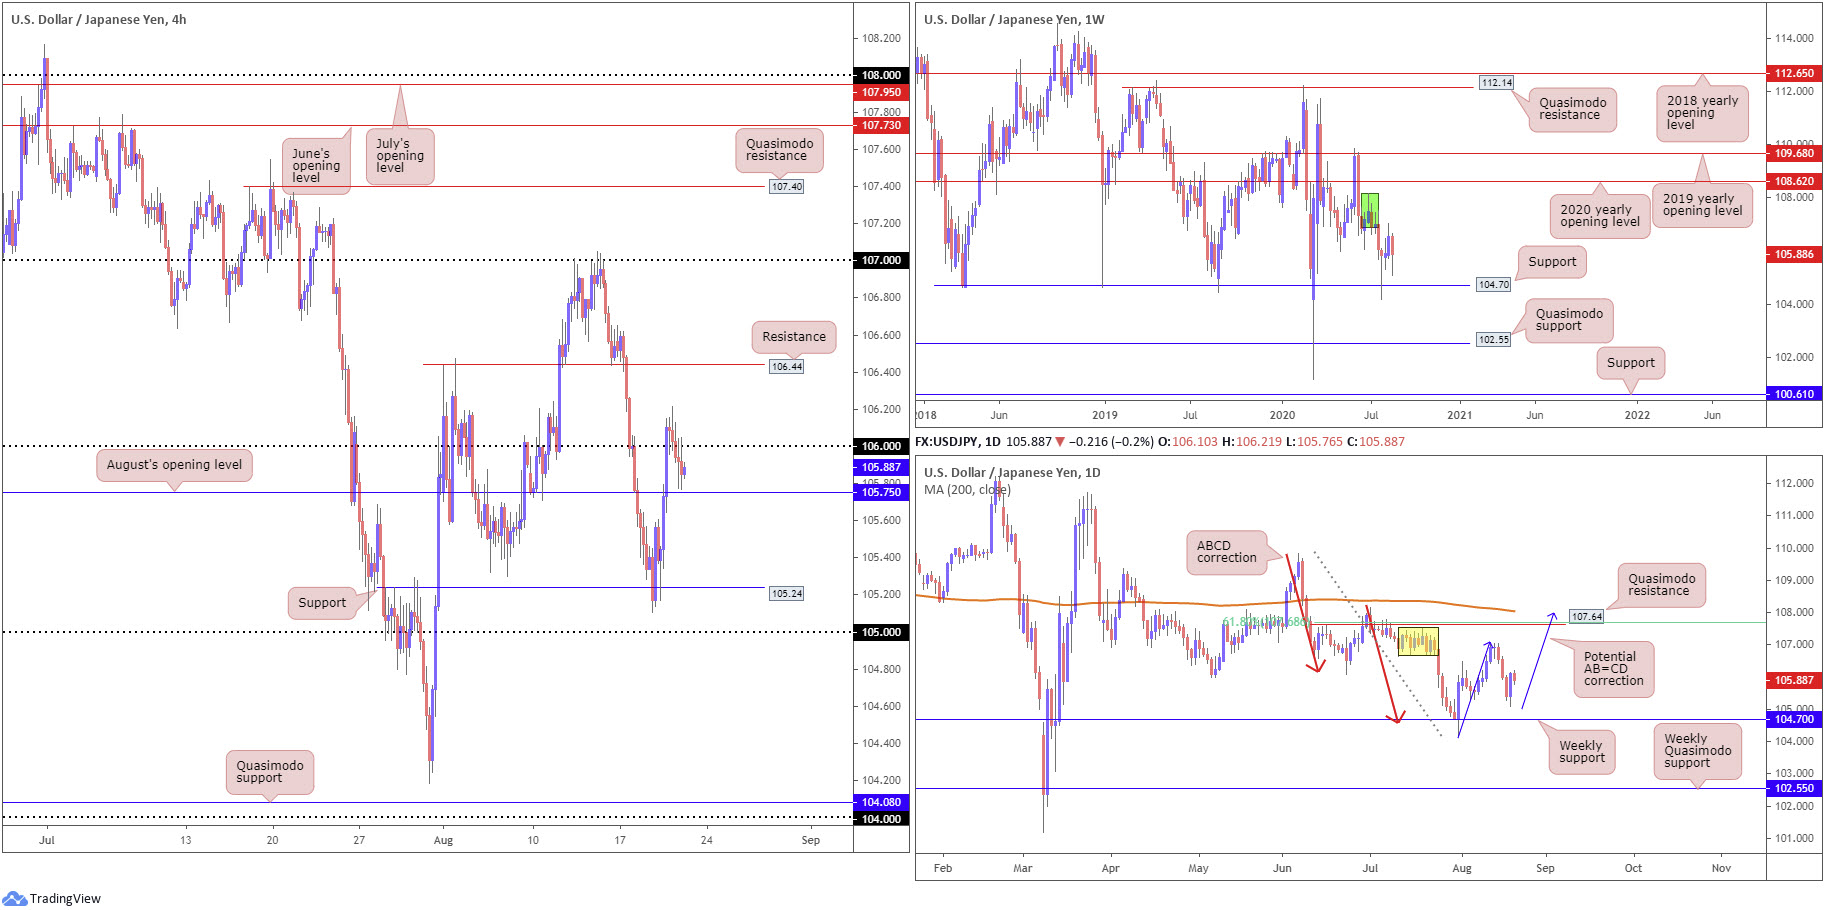
USD/JPY grinded lower on Thursday, a day after the pair staged a 0.7% recovery and snapped a three-day bearish phase.
Yesterday’s movement, as you can see, brushed back under 106 and, as of current writing, has bottomed ahead of August’s opening level at 105.75 on the H4 scale. Beyond 105.75, traders’ crosshairs will be fixed on support priced in at 105.24 (a prior Quasimodo resistance base), while recovering above 106 brings light to resistance coming in at 106.44.
Further out, supply at 106.88-108.16 (green) has so far proven a tough nut to crack on the weekly timeframe. Neighbouring structures to keep a tab on fall in at support drawn from 104.70 and the 2020 yearly opening level at 108.62.
Wednesday’s rebound, as underscored in Thursday’s technical briefing, could be the beginnings of a D-leg to a possible AB=CD bearish correction (blue arrows) at 108.00. Serving nearby the AB=CD structure, traders will find Quasimodo resistance positioned nearby at 107.64, along with the 61.8% Fibonacci retracement ratio at 107.68 and the 200-day SMA (orange – 108.04).
Areas of consideration:
Sellers appear hesitant to approach August’s opening level at 105.75, the next support target layered under 106 on the H4. This may call for another attempt at regaining position above 106 and, by extension, could be enough to ignite possible bullish scenarios to H4 resistance at 106.44.
USD/CAD:
In recent hours, the US dollar collapsed against the Canadian dollar, as WTI recouped earlier losses and the US dollar index sunk through 93.00.
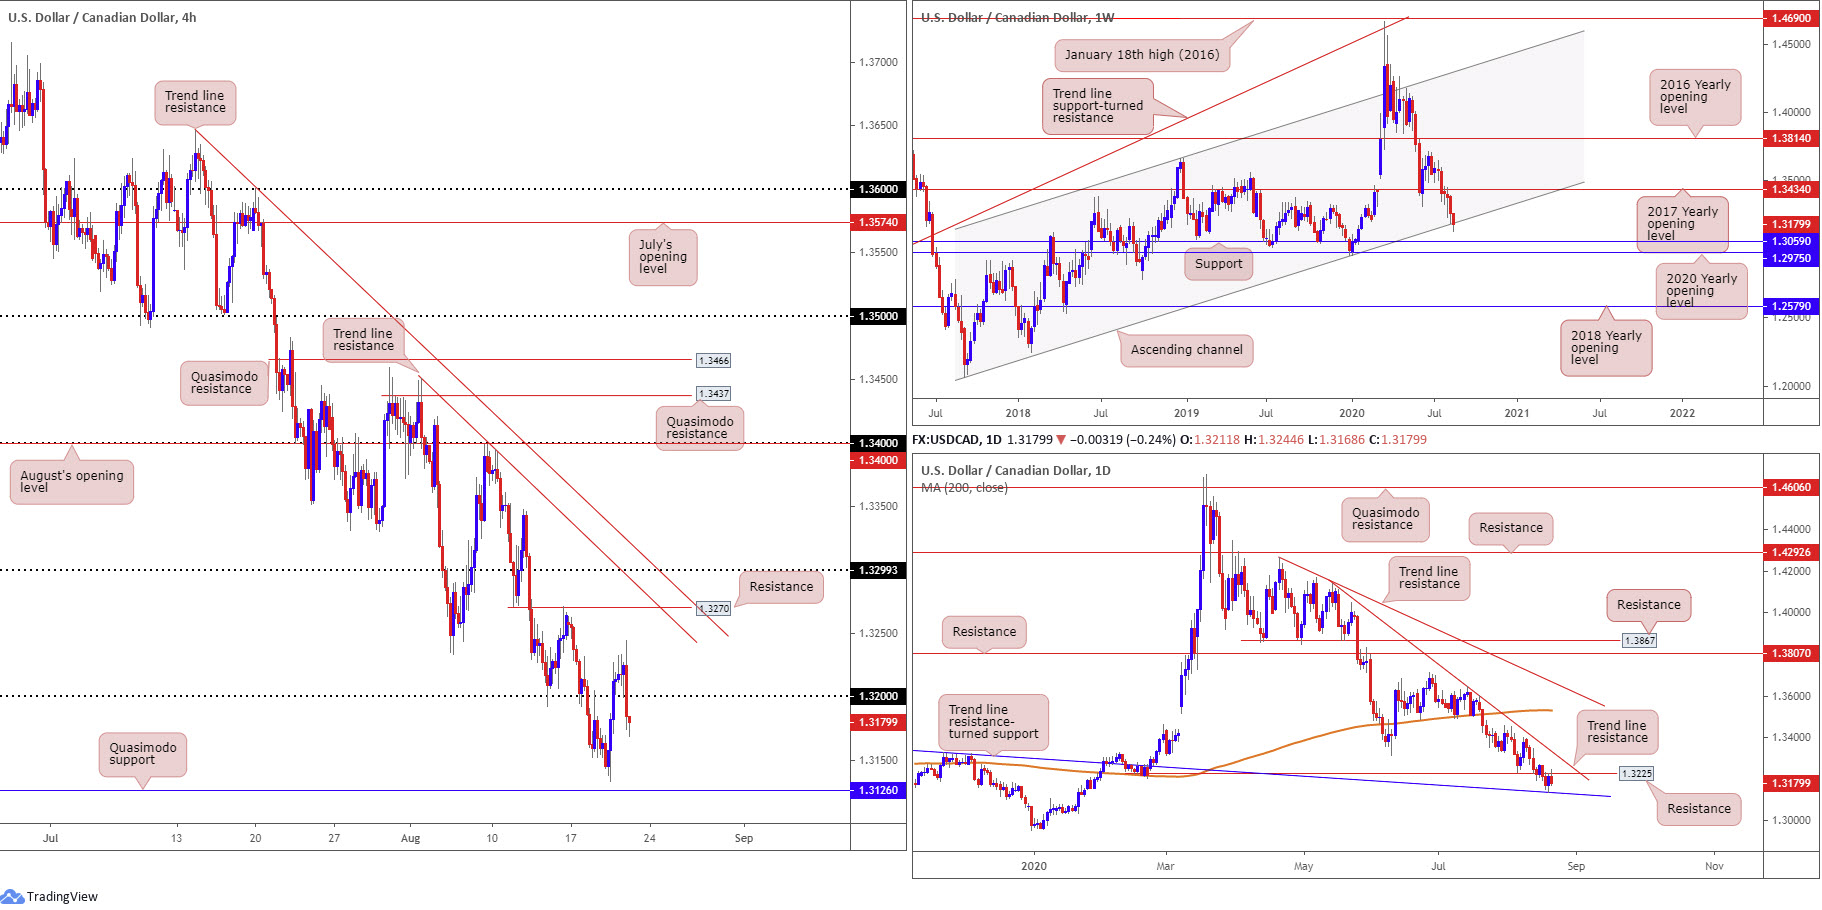
USD/CAD elbowed through orders at 1.32 on the H4 scale, encouraged on the back of daily selling from resistance at 1.3225, a prior Quasimodo support level. This potentially re-opened the risk of a return to Quasimodo support at 1.3126 on the H4 timeframe, sited ahead of Wednesday’s multi-month low at 1.3133.
Across the page, weekly price is shaking hands with channel support, taken from the low 1.2061. A recovery could spark a 1.3434 retest, the 2017 yearly opening level, while dips may bring on support at 1.3059. In terms of daily action, price recently faded resistance at 1.3225, as noted above, with trend line resistance-turned support, extended from the high 1.3382, set as the next downside target.
Areas of consideration:
Supporting bearish scenarios, the current trend points south, travelling lower since March 18, daily resistance is also located at 1.3225 and H4 recently reclaimed 1.32 to the downside. While some traders are already likely short this market on the break of 1.32, a retest at the latter may also persuade sellers into the market today, targeting H4 Quasimodo support at 1.3126.
USD/CHF:
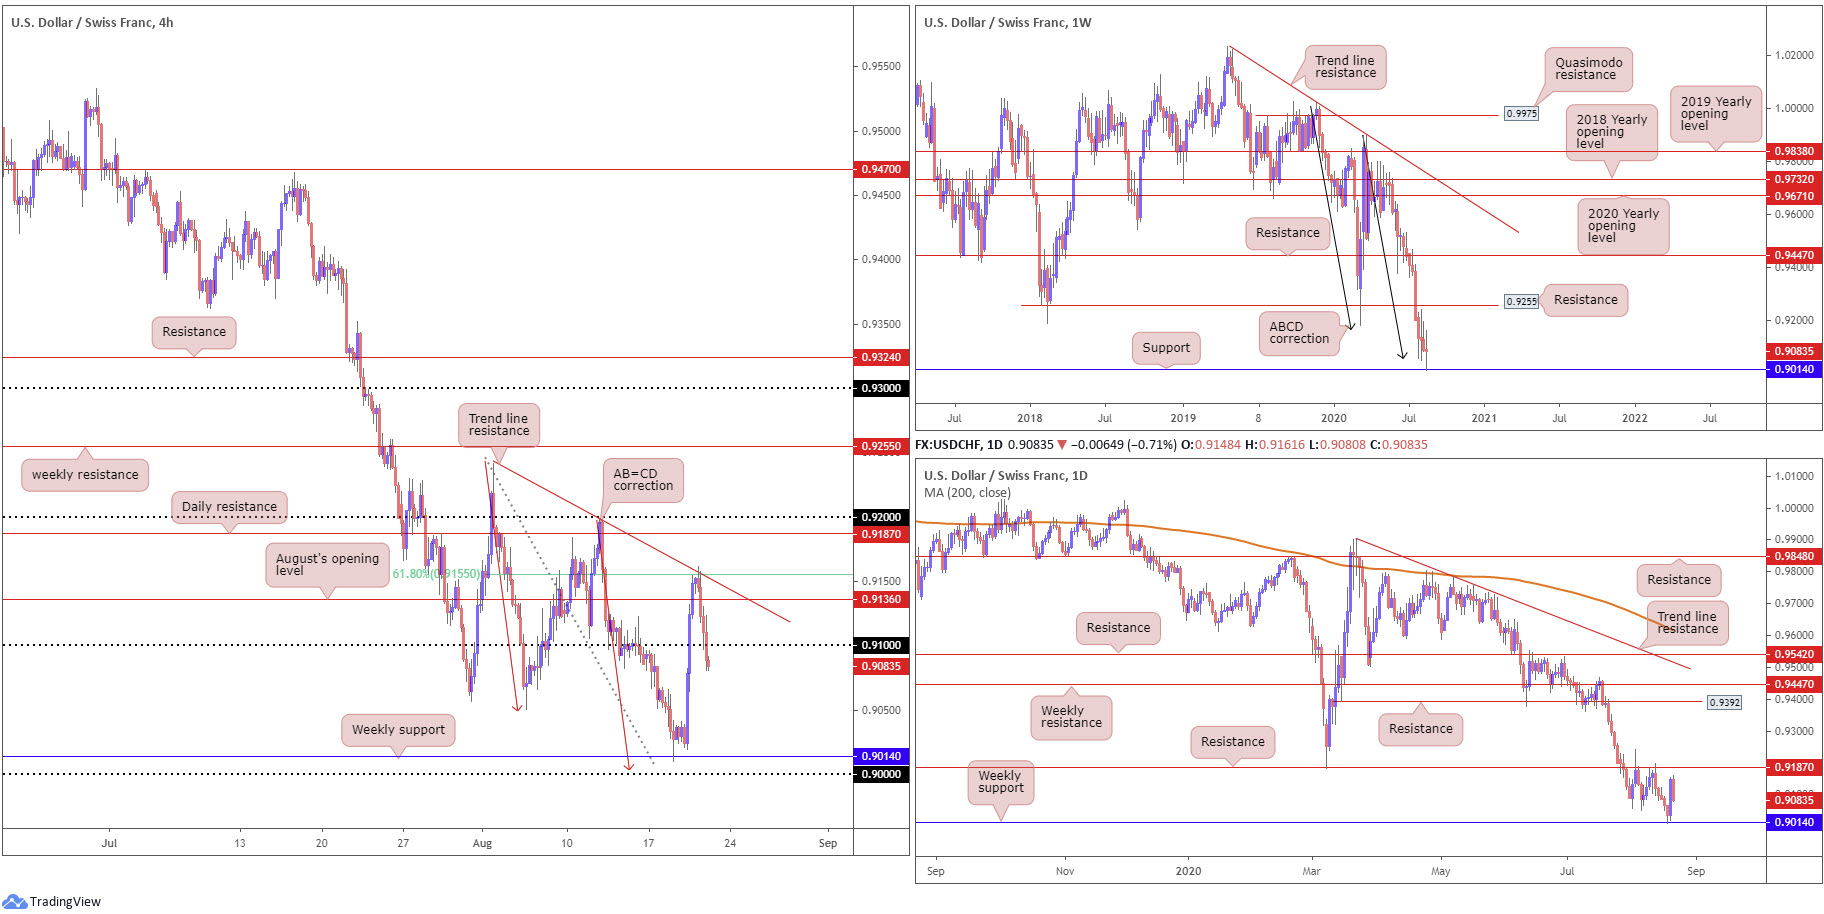
Wednesday’s sharp rebound from weekly support at 0.9014 (joined with weekly ABCD support at 0.9051 [black arrows], and nearby H4 AB=CD support at 0.9003 [red arrows] as well as the 0.90 handle on the H4) engulfed 0.91 and August’s opening level at 0.9136 on the H4 timeframe to cross swords with a 61.8% Fibonacci retracement ratio at 0.9155 and trend line resistance, taken from the high 0.9241. Note the aforementioned 61.8% line is recognised as a second take-profit target out of the recently formed H4 AB=CD pattern.
Yesterday’s stronger-than-expected bearish response from 0.9155 reclaimed territory under August’s opening level and the 0.91 handle, perhaps turning light back to a move to weekly support mentioned above at 0.9014 and the key figure 0.90 (H4).
Areas of consideration:
Weekly price echoes an indecisive tone right now, shaped by way of a long-legged doji candlestick formation. Nevertheless, this could actually be considered a reversal signal, knowing we’re stationed off support at 0.9014.
On the other side of the coin, however, reclaiming 0.91 to the downside on the H4 and lacking strength to reach daily resistance at 0.9187, as well as the trend facing south since May 2019, is likely a concern for buyers and could have further selling take hold.
Dow Jones Industrial Average:
Major US equity benchmarks ended Thursday in positive territory, bolstered by a rally in technology stocks. The Dow Jones Industrial Average rallied 46.85 points, or 0.17%; the S&P 500 advanced 10.66 points, or 0.32% and the tech-heavy Nasdaq 100 traded higher by 158.41 points, or 1.40%.
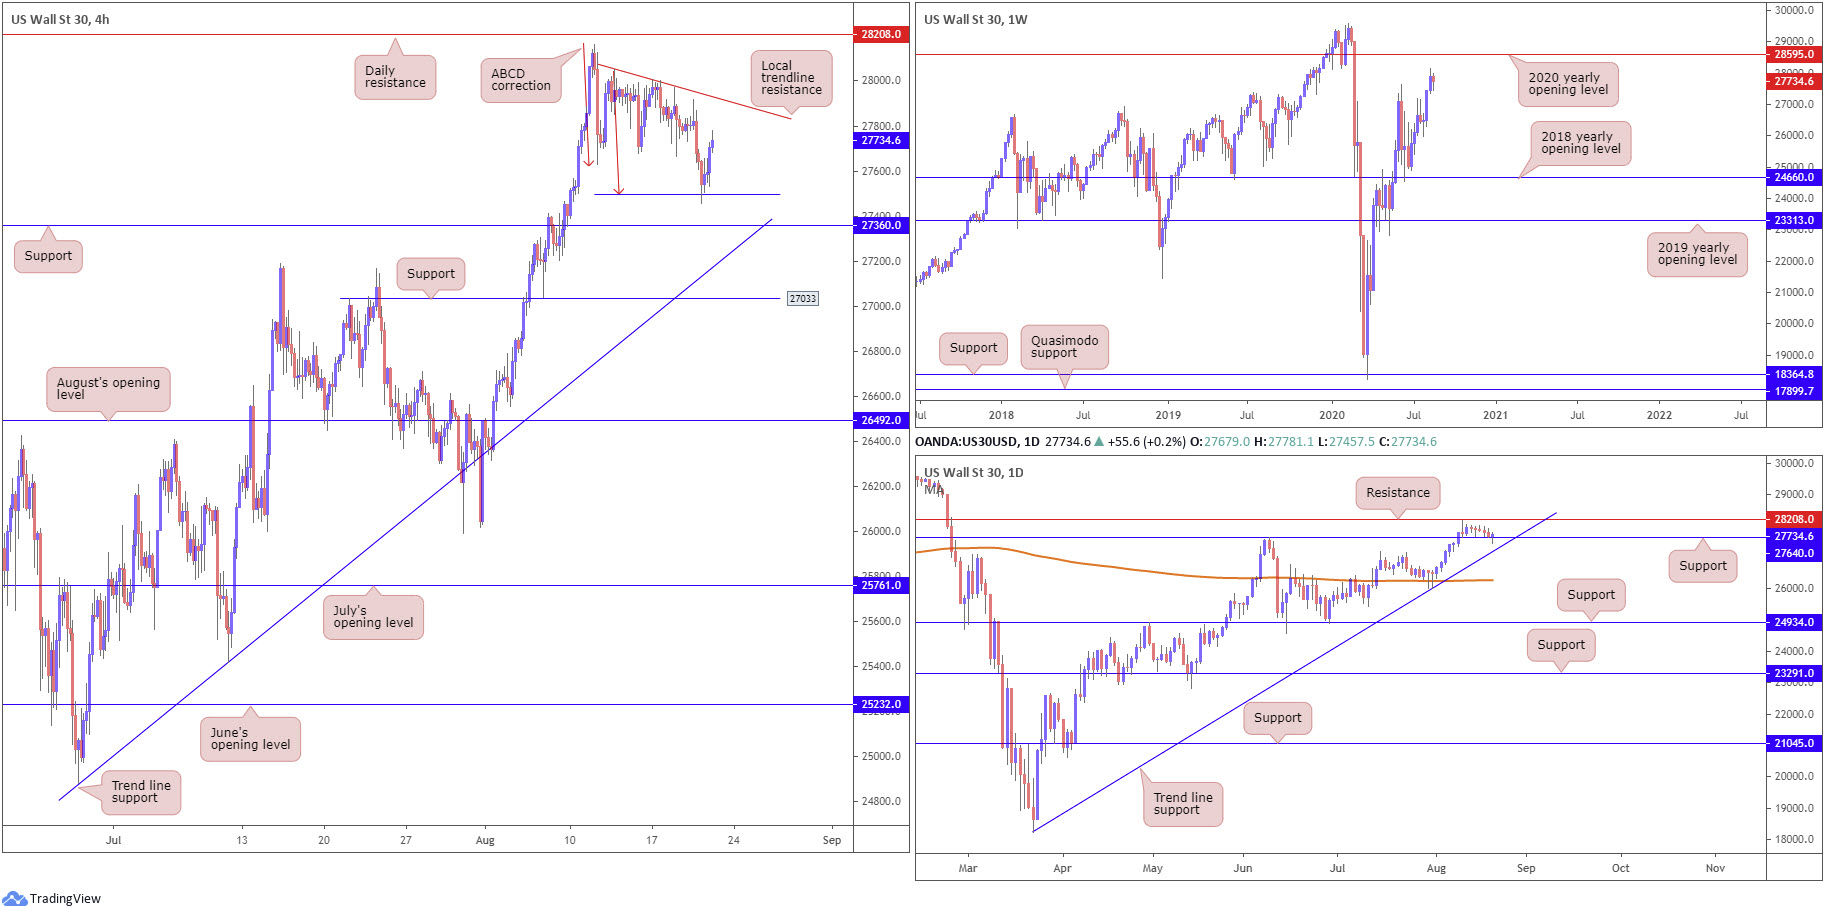
On the technical front, the week’s action currently trades lower by 0.5% and remains within the prior week’s range between 28161/27354. Price traded strong last week, extending the prior week’s 3.5% advance and overthrowing the 27638 high. The unit, despite the lacklustre performance seen this week, is now poised to make a run for the 2020 yearly opening level at 28595.
A closer reading of price action on the daily timeframe shows support at 27640 entered play yesterday and produced a hammer candlestick pattern (bullish). This may prompt an advance to resistance coming in at 28208.
Across the page on the H4 timeframe, technicians witnessed a H4 ABCD bullish correction at 27495 (red arrows) contain price ahead of support at 27360. H4 trend line resistance, extended from the high 28051, lies in wait should further buying occur today, with a break exposing daily resistance mentioned above at 28208.
Areas of consideration:
With daily support at 27640 now in the frame, along with a H4 ABCD correction recently forming and weekly price exhibiting scope to approach the 2020 yearly opening level at 28595, a rally to, and violation of, current H4 trend line resistance could be seen.
A test of H4 trend line resistance will likely have current buyers reduce risk to breakeven, and targeting daily resistance at 28208. A break of the aforementioned trend line will also likely attract fresh buying, in favour of a potential pop higher.
XAU/USD (GOLD):
A day after declining more than 3.5%, spot gold staged a modest recovery Thursday as the US dollar index tunnelled back under the 93.00 handle.
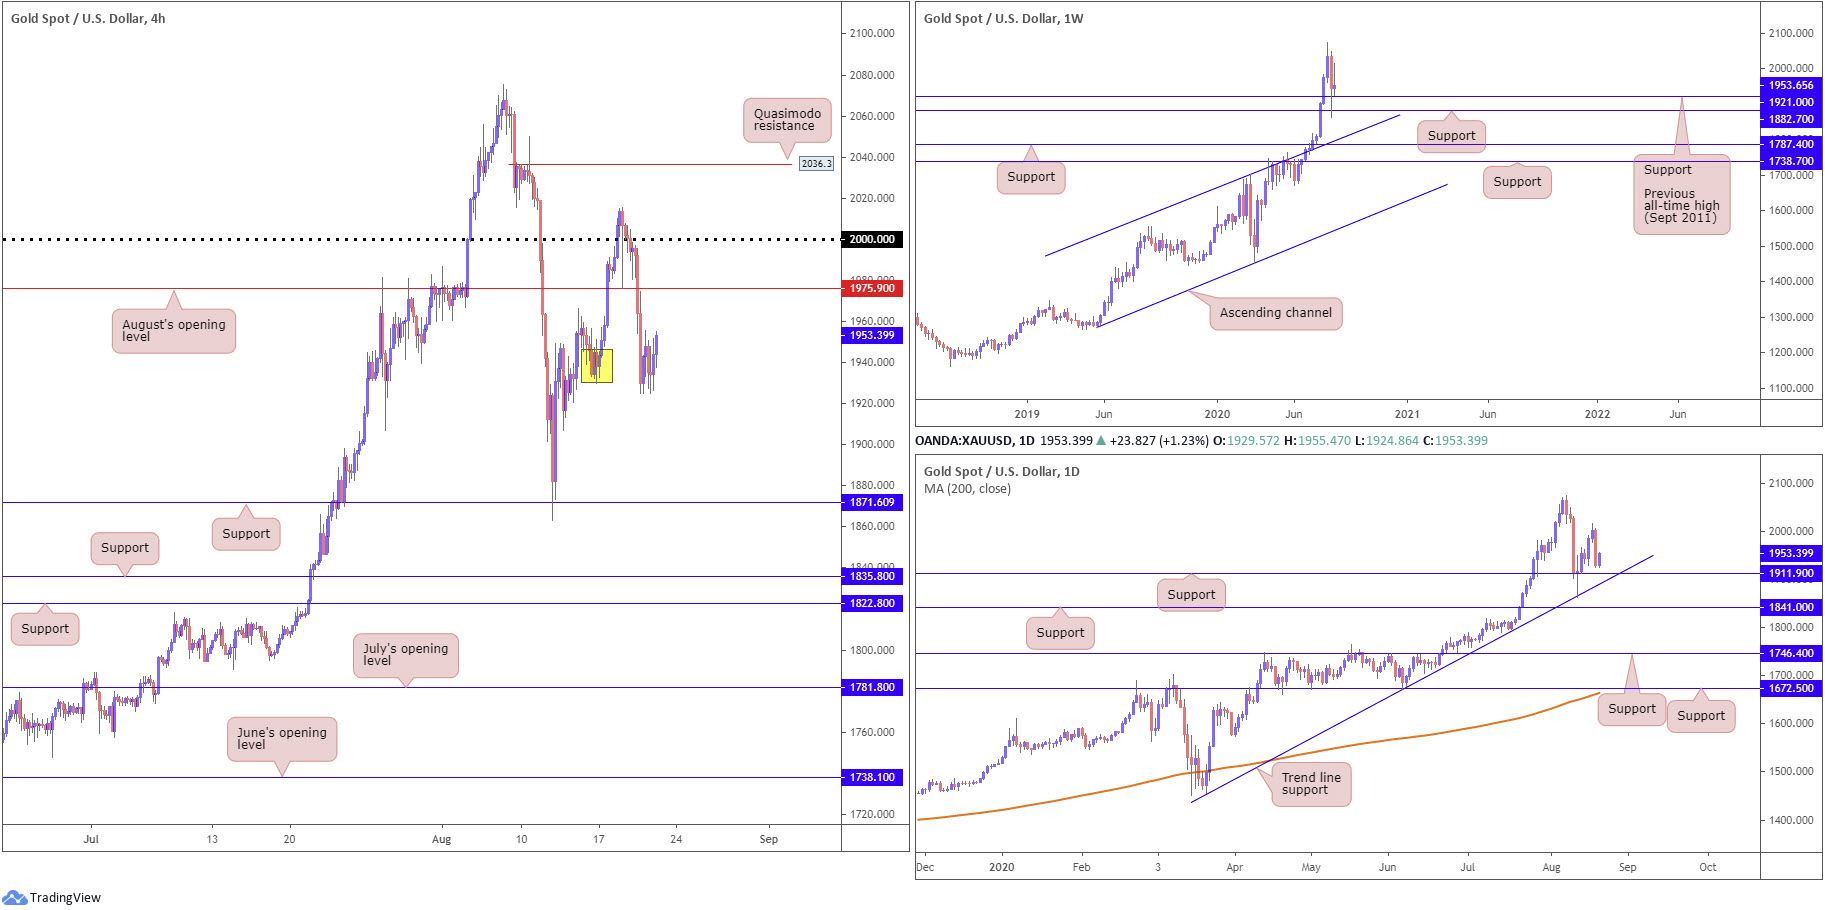
Aside from H4 demand (yellow) at $1,930.34-$1,946.28 marginally giving up its lower edge, there’s not much technical change to report this morning. Therefore, much of the following will echo thoughts put forward in yesterday’s report.
Breaking H4 demand confirms further weakness could be in store for the yellow metal to H4 support at $1,871.60.
In spite of the recent dip and the break of H4 demand suggesting sellers may push for lower levels, the underlying trend has remained strong since 2016. Additionally, the following support structures hover nearby:
- $1,921.00, the previous all-time high (September 2011).
- Weekly support at $1,882.70.
- Daily trend line support, extended from the low $1,455.32.
- Daily support from $1,911.90.
Areas of consideration:
Outlook unchanged.
Between $1,911.90 (daily support) and $1,921.00 (weekly level) is an area crosshairs will likely be fixed on, given H4 candles engulfed current demand. A notable H4 bullish candlestick forming within the aforementioned higher timeframe area may see a recovery take over and perhaps a revisit at August’s opening level from $1,975.90.
The accuracy, completeness and timeliness of the information contained on this site cannot be guaranteed. IC Markets does not warranty, guarantee or make any representations, or assume any liability regarding financial results based on the use of the information in the site.
News, views, opinions, recommendations and other information obtained from sources outside of www.icmarkets.com.au, used in this site are believed to be reliable, but we cannot guarantee their accuracy or completeness. All such information is subject to change at any time without notice. IC Markets assumes no responsibility for the content of any linked site.
The fact that such links may exist does not indicate approval or endorsement of any material contained on any linked site. IC Markets is not liable for any harm caused by the transmission, through accessing the services or information on this site, of a computer virus, or other computer code or programming device that might be used to access, delete, damage, disable, disrupt or otherwise impede in any manner, the operation of the site or of any user’s software, hardware, data or property.


