
Key risk events today:
Canada Core Retail Sales m/m and Retail Sales m/m.
EUR/USD:
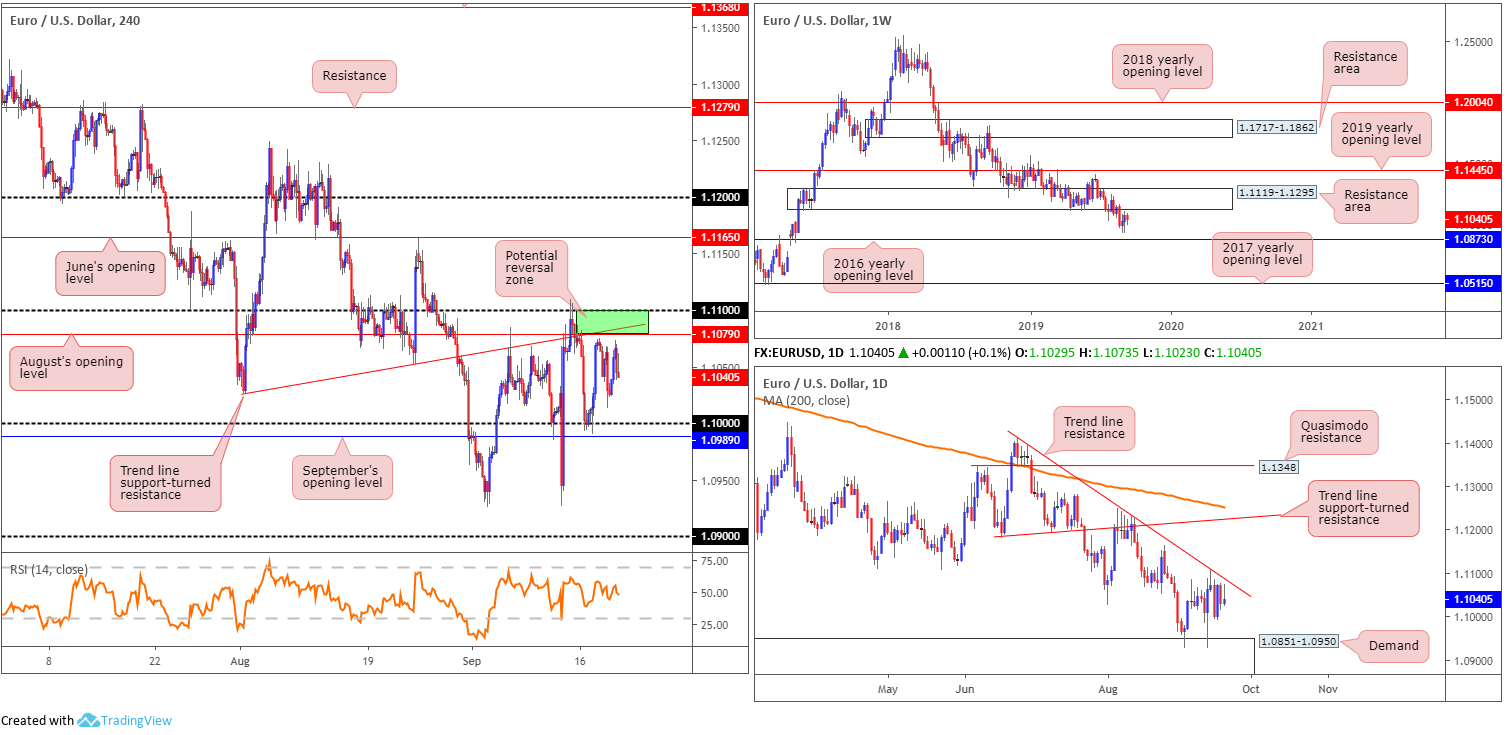
EUR/USD prices head into Asia Pac hours relatively unchanged this morning, confined within Wednesday’s range at 1.1075/1.1013. In light of Thursday’s lacklustre performance, much of the following points aired in Thursday’s technical briefing will be employed today.
The next port of call in terms of support remains set at the key figure 1.10 on the H4 timeframe, closely trailed by September’s opening level priced in at 1.0989. To the upside, August’s opening level resides at 1.1079 (resistance), which happens to intersect closely with a familiar trend line support-turned resistance (extended from the low 1.1032). Resistance beyond here falls in at the 1.11 handle, followed by June’s opening level at 1.1165. RSI momentum, for indicator-based traders, remains beneath its 50.0 value at 48.0.
Higher-timeframe structure has weekly price languishing south of a demand-turned resistance area at 1.1119-1.1295, with the 2016 yearly opening level at 1.0873 set as the next support target. Concerning overall trend direction, since topping in early 2018 at 1.2555, the long-term trend remains pointing in a southerly bearing. According to daily structure, the unit turned south ahead of trend line resistance taken from the high 1.1412, poised to possibly revisit demand coming in at 1.0851-1.0950 (area holds the 2016 yearly opening level within its lower boundary).
Areas of consideration:
Outlook unchanged.
The green zone on the H4 timeframe between the 1.11 handle, trend line support-turned resistance and August’s opening level at 1.1079 remains a likely area of interest for possible shorting opportunities. In addition to this, the current daily trend line resistance highlighted above merges closely with the said H4 zone. For those looking to press this bearish theme, the research team recommends waiting for additional H4 candlestick structure to form before pulling the trigger for two reasons (entry/risk can be determined according to this pattern). Firstly, the top edge of the H4 zone, the round number 1.11, is prone to stop runs and could unnecessarily liquidate a position. Secondly, the underside of the weekly resistance area mentioned above at 1.1119-1.1295 is set just 20 points above 1.11, which could act as a magnet for price, therefore igniting a fakeout higher to run orders at 1.11.
Adding to the current outlook, 1.10 is likely a support on the radar for some traders today. This remains a chancy long, though, given both weekly and daily price suggest a move beyond here to at least daily demand carved from 1.0851-1.0950.
GBP/USD:
Sterling took its cues from upbeat Brexit updates Thursday as EC President Juncker stated he thinks a deal is possible, consequently lifting GBP/USD to highs of 1.2560. The Bank of England (BoE) did little to influence price action as all remains dependent upon the Brexit outcome. UK retail sales also failed to move the currency despite a miss on expectations, as the negative headline was offset by decent revisions.
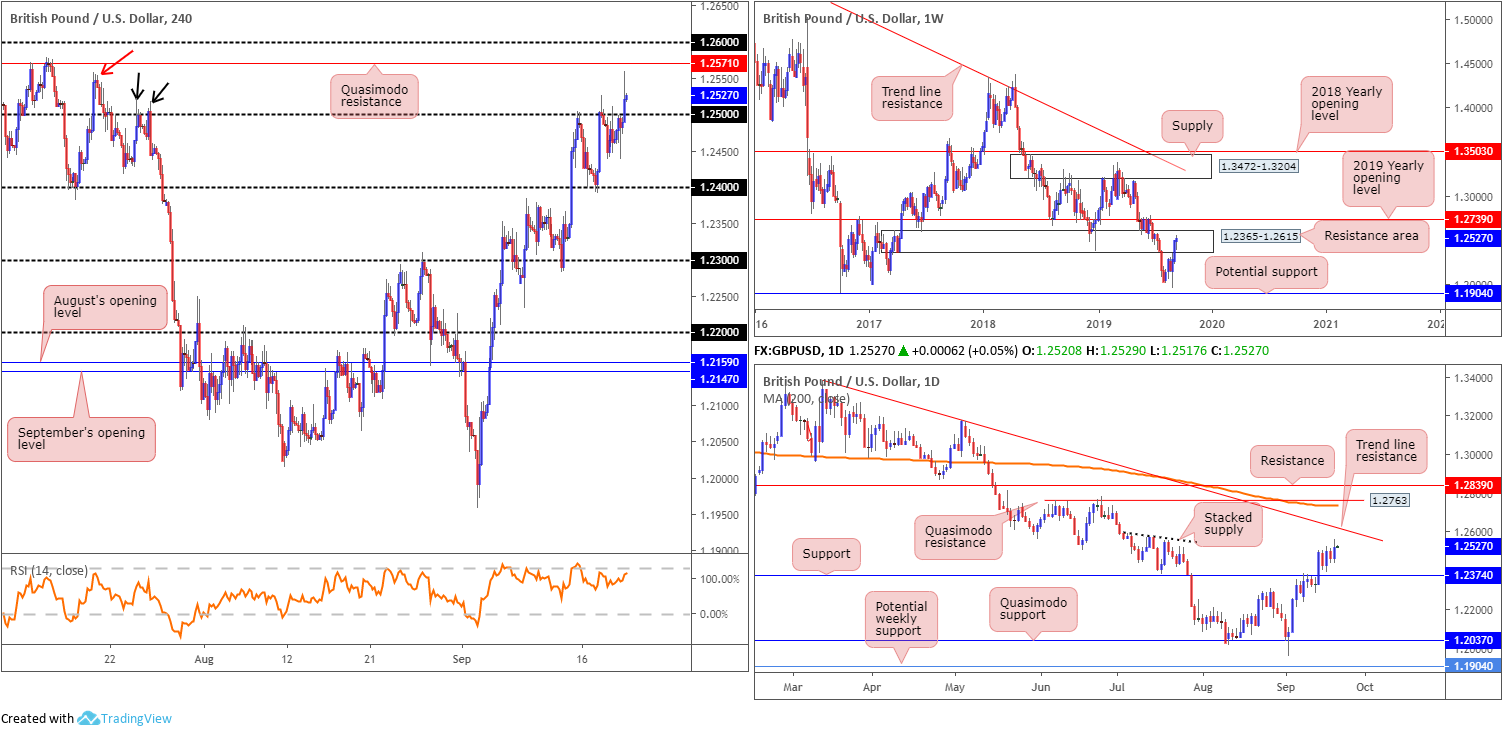
Technically, we concluded the session north of the 1.25 handle on the H4 timeframe, exposing Quasimodo resistance at 1.2571, closely followed by 1.26. As aired in Thursday’s briefing, the high 1.2558 (red arrow), and the highs set beneath it (black arrows) at 1.2522ish, likely have buy stops plotted above. This may help provide liquidity to sell the said Quasimodo resistance.
Higher-timeframe movement on the weekly timeframe continues to toy with a long-term resistance area coming in at 1.2365-1.2615, shuffling its way higher into the zone. Daily flow, on the other hand, produced a bullish outside day formation Thursday and appears set to challenge trend line resistance extended from the high 1.3380. Also note, the candles remain within an area of stacked supply positioned between 1.2591/1.2475.
Areas of consideration:
Overthrowing 1.25 yesterday highlights a possible buying opportunity, at least until reaching H4 Quasimodo resistance at 1.2571. For those who want to press this bullish scenario, waiting for a retest at 1.25 as support to develop is suggested (entry and risk can be found on the back of the rejecting candle’s structure).
Not only is the H4 Quasimodo a fixed upside target, it is also considered a sell zone given it being located within the walls of the said weekly resistance area and has H4 liquidity pockets (set above highs on approach) below it in the form of buy stops to sell into. Traders are urged to wait for a H4 bearish candlestick pattern (entry/risk can be set according to this structure) to form before pulling the trigger, as not only is daily price eyeing levels around 1.2617 (the daily trend line resistance), the 1.26 handle is likely to act as a magnet to price.
AUD/USD:
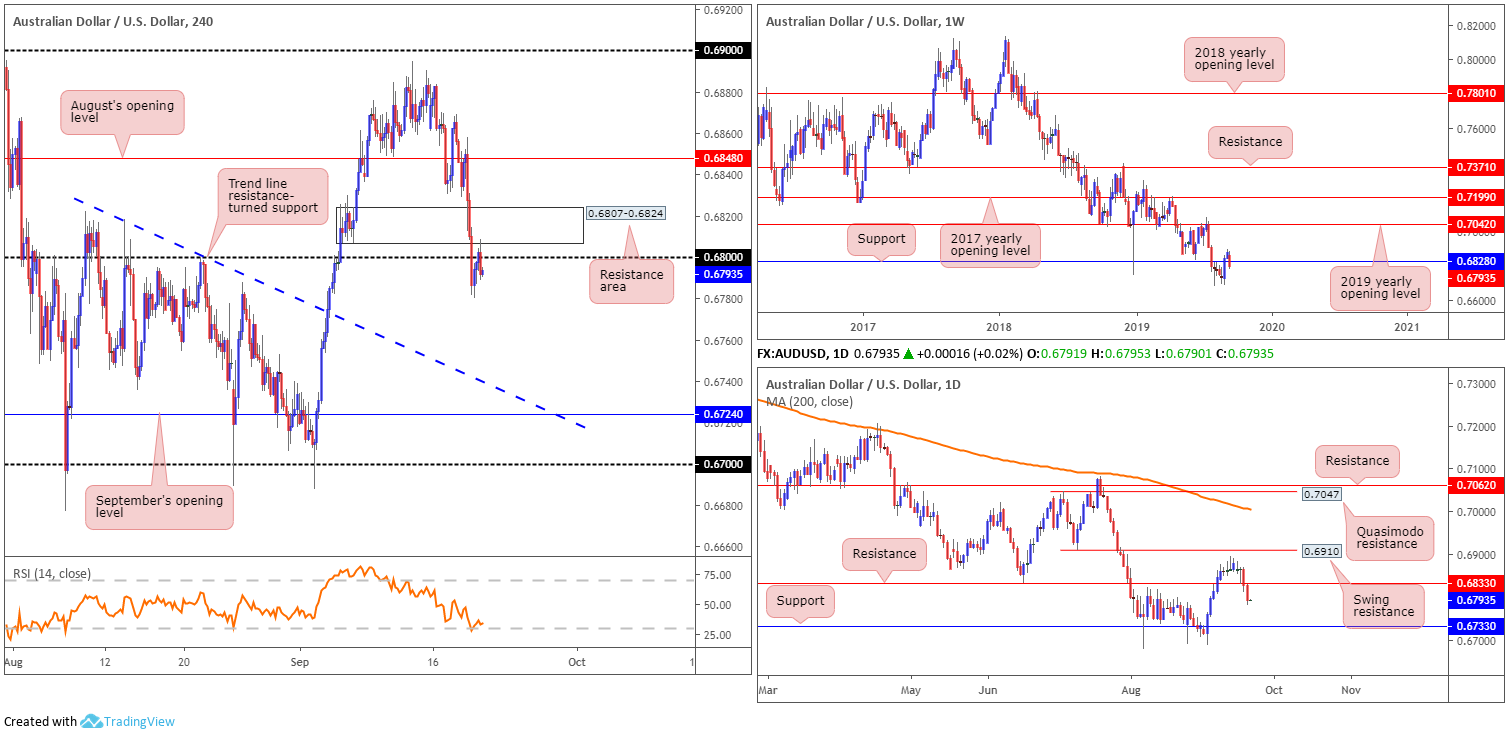
Thursday witnessed accelerated downside emerge in the early hours of trade following the release of Australian job’s data. The unemployment rate ticked higher to 5.3% in August compared to the previous month’s reading of 5.2%. The AUD/USD maintained an offered tone into London’s open, with price turning higher and whipsawing through 0.68 to the underside of 0.6807-0.6824, a demand-turned resistance area plotted on the H4 timeframe. Interestingly, the retest of the said area formed by way of a bearish outside setting, which is perhaps sufficient enough to prompt further selling today towards trend line resistance-turned support (extended from the high 0.6818).
Against the backdrop of H4 flow, weekly price, thanks to recent selling, is now stationed a touch beneath support at 0.6828, with continued downside possibly eyeing 0.6677, the YTD low. In terms of daily action, we crossed through support at 0.6833 in reasonably strong fashion yesterday, exposing space for a run to support at 0.6733.
Areas of consideration:
Keeping things simple this morning, all three timeframes analysed portend a move lower, with shorts based off the H4 bearish outside pattern formed from the underside of a demand-turned resistance area at 0.6807-0.6824. As for downside targets, either the H4 trend line resistance-turned support or daily support at 0.6733 offers a logical starting point, whichever hits first.
USD/JPY:
In recent movement, the US dollar shifted lower against the Japanese yen, consequently erasing Wednesday’s gains in the shape of a daily bearish engulfing formation.
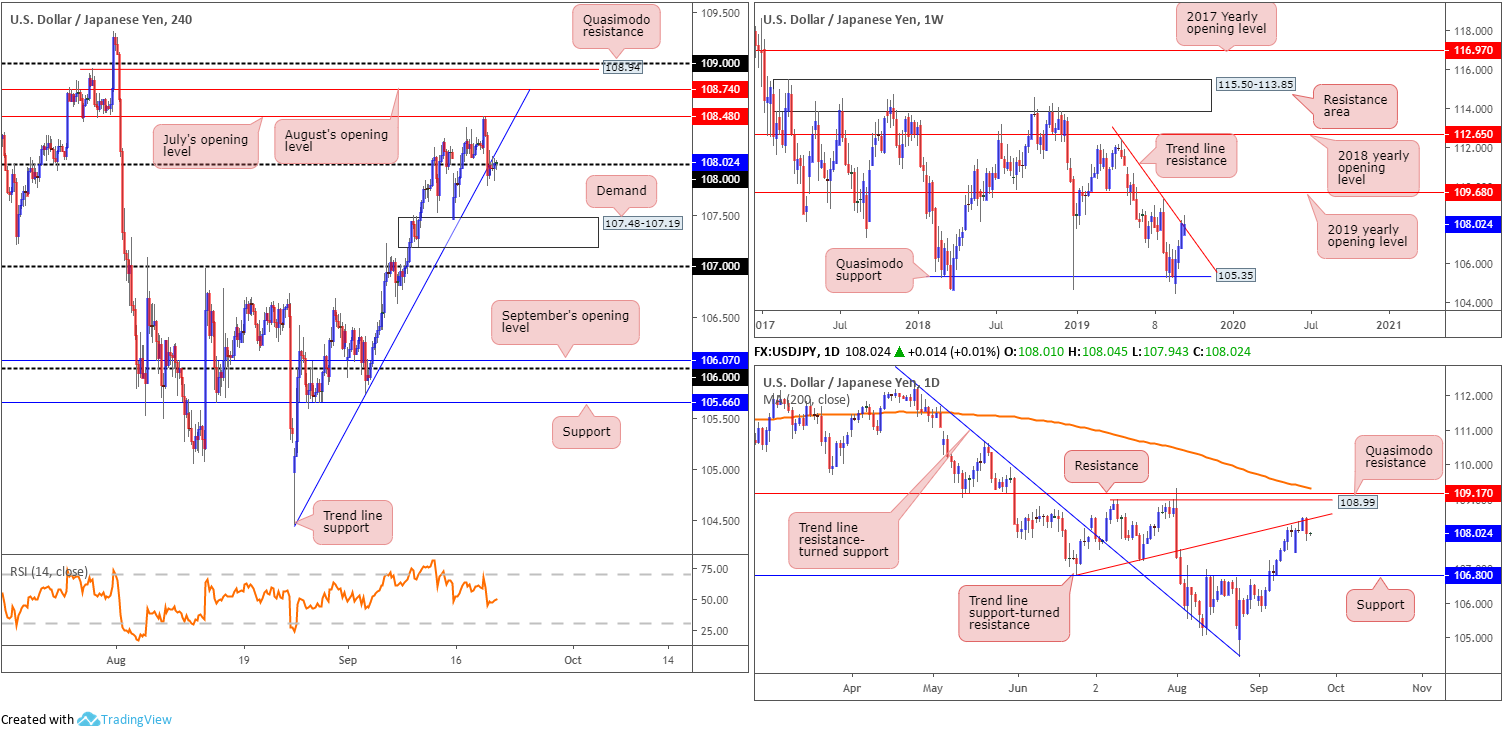
Thursday’s downside move witnessed the H4 candles dethrone not only a steep trend line support (taken from the low 104.44), but also the 108 handle. Although early trade sees H4 action trading a touch back above 108, the next port of call in terms of support falls in around demand at 107.48-107.19, sited a few points north of 107.
Technical research remains unchanged on the weekly timeframe which has price crossing trend line resistance extended from the high 112.40. This follows a healthy three-week long recovery off Quasimodo support at 105.35. Additional upside could see the 2019 yearly opening level at 109.68 enter the mix, though a reaction off the 109.31 high may also occur.
Daily activity rotated south off a trend line support-turned resistance (extended from the low 106.78) yesterday by way of a bearish engulfing formation. In the event this triggers additional selling today/next week, support at 106.80 is eyed as the next downside target.
Areas of consideration:
The break of the H4 trend line support along with the 108 handle signals a possible shift in sentiment. Couple this with trend line resistances identified on the weekly and daily timeframes as well as a daily bearish engulfing candlestick pattern, focus shifts to selling today.
Ultimately, though, before pulling the trigger, traders are urged to consider waiting for signs of seller intent to form at the underside of 108 in the mould of a H4 bearish candlestick structure (entry and risk can be calculated on the back of this range), with H4 demand at 107.48-107.19 set the initial take-profit target.
USD/CAD:
Having seen WTI snap a 2-day losing streak Thursday, trading above $58.50/bbl, and the US dollar index shift lower, the USD/CAD wrapped up the session in negative territory, down 0.21%.
For traders who read Thursday’s technical research you may recall the following:
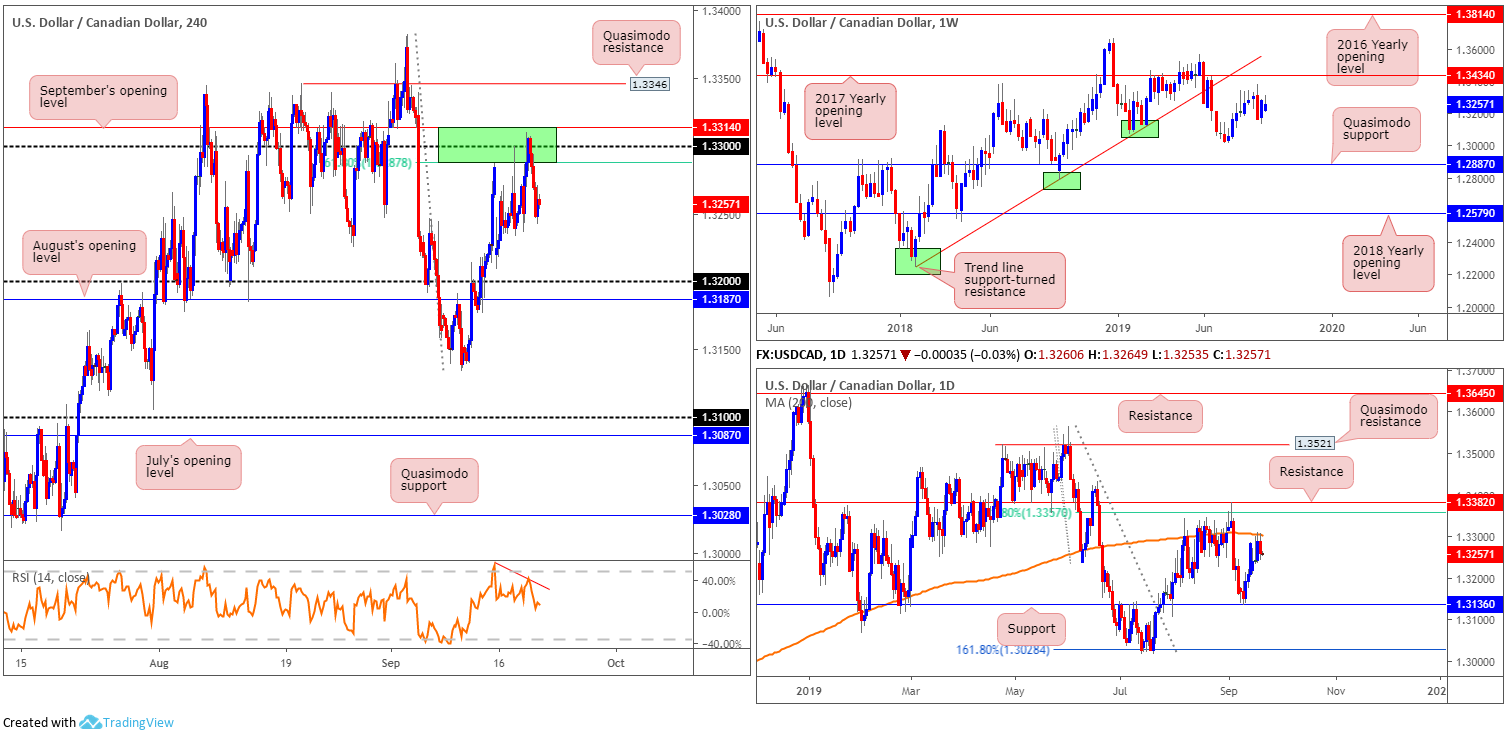
A portion of buy stops were likely filled above 1.33 in recent hours, though this is unlikely to attract many buyers into the market given we remain within the walls of a prominent sell zone (green) on the H4 timeframe: between September’s opening level at 1.3314, the round number 1.33 and the 61.8% Fibonacci ratio at 1.3287 (1.3314/1.3287). In addition to the H4 sell zone, the research team notes RSI movement currently chalking up negative divergence (red line) and daily price rejecting the 200-day SMA value at 1.3304 (orange).
Although the H4 sell zone mentioned above at 1.3314/1.3287 is being tested a second time, a H4 bearish candlestick formation printed from here (entry/risk can be set according to this pattern) will likely be enough to entice sellers into the market, with an initial downside target set at the 1.32 handle.
While a H4 bearish candlestick formation did not materialise from the said H4 area, a clear bearish rotation was seen that eclipsed at least 50% of the previous bullish candle. Clearly this was enough. Well done to any of our readers who managed to jump aboard this move.
Areas of consideration:
Aside from active shorts out of 1.3314/1.3287, with a take-profit target set around 1.32, the research team sees little else to hang their hat on at the moment.
USD/CHF:
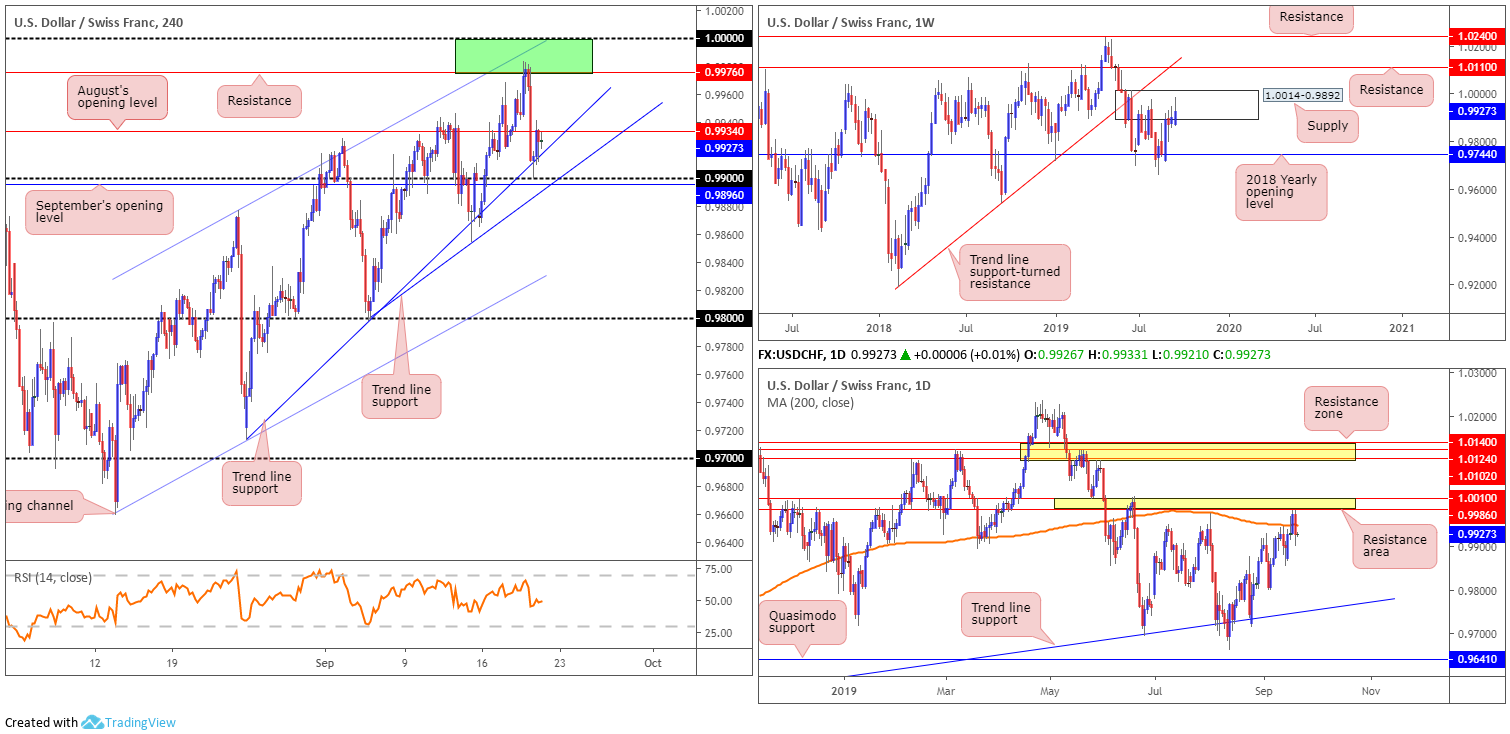
The Swiss National Bank (SNB) left interest rates unchanged at -0.75% Thursday, in-line with expectations. In addition to this, the central bank retained its familiar commentary around a willingness to intervene in FX markets if needed, and also lowered its inflation/GDP forecasts for 2019. This prompted an aggressive selloff in USD/CHF price, bringing H4 candles lower from a resistance area at 1.0000/0.9976 (comprised of a notable high formed at the end of July from 0.9976. a channel formation extended from the high 0.9877 and 1.0000 [parity]). The selloff engulfed August’s opening level at 0.9934 and tested 0.99/trend line support (taken from the low 0.9798), before mildly recovering and retesting 0.9934 as resistance at the close.
Weekly price continues to engage with supply coming in at 1.0014-0.9892. As underscored in yesterday’s technical briefing, this is the second time back to the area, meaning it may struggle to hold price action lower. A rotation lower from here, nevertheless, has the 2018 yearly opening level at 0.9744 in sight. In the event buyers brush aside the said supply, resistance at 1.0110 is in view, as is long-term trend line support-turned resistance taken from the low 0.9187. A closer reading of price action on the daily timeframe has the pair airing a bearish vibe just south of a daily resistance area at 1.0010/0.9986. As you can see, this recently saw price engulf the 200-day SMA (orange – 0.9744). The research team notes limited active demand south of price action, with the next obvious base coming in by way of a trend line support etched from the low 0.9542.
Areas of consideration:
Well done to any of our readers who shorted the H4 resistance area at 1.0000/0.9976, as this was a noted area for potential selling opportunities – it might be an idea to begin considering taking partial profits off the table and reducing risk to breakeven.
As long as the H4 candles remain defensive beneath 0.9934, and daily flow holds south of its 200-day SMA, a break of 0.99 may be in store, perhaps setting the stage for a run towards 0.98.
Dow Jones Industrial Average:
US equity indexes closed near unchanged Thursday, a day after the second interest rate cut of 2019 by the Federal Reserve. The Dow Jones Industrial Average erased 52.29 points, or 0.19%; the S&P 500 concluded flat while the tech-heavy Nasdaq 100 added 13.24 points, or 0.17%.
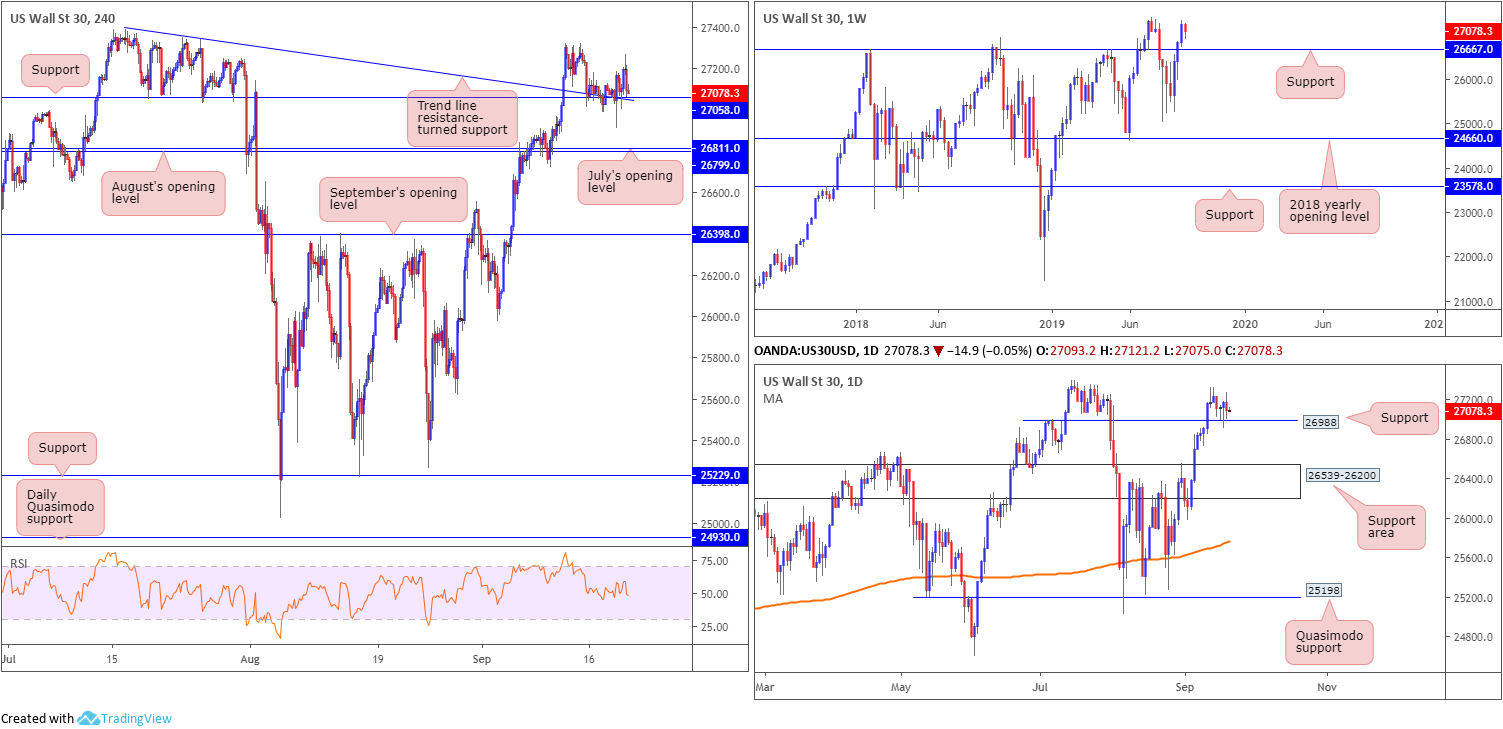
A robust H4 bullish outside formation formed off support coming in at 27058 and a converging trend line resistance-turned support Wednesday (taken from the all-time high 27388), which remains central to the H4 timeframe’s price action. As stated in Thursday’s technical briefing, buyers likely viewed this as a bullish indicator, targeting tops set around 27321, followed by the all-time high mentioned above at 27388.
On more of a broader perspective, weekly price still holds strong north of support at 26667 and is currently sited a short walk from 27388. Daily price, however, continues to hover a touch above support at 26988, though struggling to gain traction despite a number of bullish candlestick signals recently forming.
Areas of consideration:
On account of the above, longs remain in favour. Those already long on the back of the H4 bullish outside formation formed off support at 27058 are currently set in drawdown. Upside targets from here fall in around H4 tops at 27321, followed by the all-time high set at 27388.
XAU/USD (GOLD):
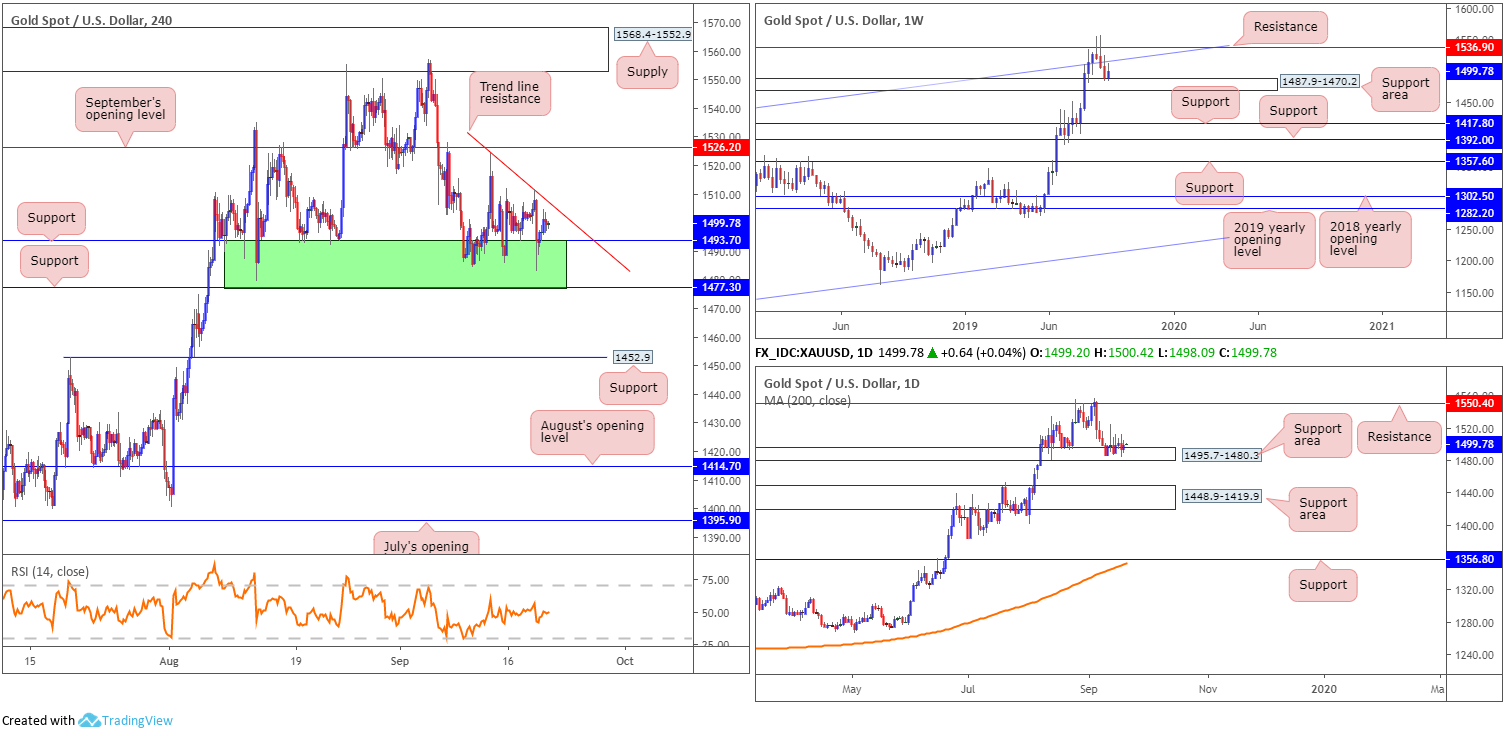
Bullion concluded Thursday a shade higher against the US dollar, recovering a portion of Wednesday’s losses influenced on the back of the Fed lowering its benchmark rate by 25 basis points to a range of 1.75%-2.00%. As evident from H4 structure, the metal remains testing a familiar support area between 1477.3/1493.7 (green). Buyers, particularly on the H4 timeframe, likely still eye higher prices all the time the current support zone is intact. A break of this area has support at 1452.9 to target.
In view of higher-timeframe structure remaining unchanged, the following is taken from Thursday’s outlook:
Viewing price action from the higher timeframes, weekly price, following a three-week bearish phase off resistance at 1536.9, is still seen tackling a support area drawn from 1487.9-1470.2. By the same token on the daily timeframe, we can see price rejected resistance at 1550.4 and is shaking hands with a support area at 1495.7-1480.3 (glued to the top edge of the current weekly support area).
Areas of consideration:
In order to validate buyer intent out of the current H4 support zone at 1477.3/1493.7, a H4 close above local trend line resistance (extended from the high 1524.2) is required. A decisive push through this barrier exposes September’s opening level as the next resistance at 1526.2. Ideally, a retest at the broken trend line as support is eyed as possible entry, even better if the retest forms by way of a H4 bullish candlestick signal (entry and risk can then be set according to this structure).
The accuracy, completeness and timeliness of the information contained on this site cannot be guaranteed. IC Markets does not warranty, guarantee or make any representations, or assume any liability regarding financial results based on the use of the information in the site.
News, views, opinions, recommendations and other information obtained from sources outside of www.icmarkets.com.au, used in this site are believed to be reliable, but we cannot guarantee their accuracy or completeness. All such information is subject to change at any time without notice. IC Markets assumes no responsibility for the content of any linked site.
The fact that such links may exist does not indicate approval or endorsement of any material contained on any linked site. IC Markets is not liable for any harm caused by the transmission, through accessing the services or information on this site, of a computer virus, or other computer code or programming device that might be used to access, delete, damage, disable, disrupt or otherwise impede in any manner, the operation of the site or of any user’s software, hardware, data or property.


