
Waiting for lower timeframe confirmation is our main tool to confirm strength within higher timeframe zones, and has really been the key to our trading success. It takes a little time to understand the subtle nuances, however, as each trade is never the same, but once you master the rhythm so to speak, you will be saved from countless unnecessary losing trades. The following is a list of what we look for:
- A break/retest of supply or demand dependent on which way you’re trading.
- A trendline break/retest.
- Buying/selling tails/wicks – essentially we look for a cluster of very obvious spikes off of lower timeframe support and resistance levels within the higher timeframe zone.
We typically search for lower-timeframe confirmation between the M15 and H1 timeframes, since most of our higher-timeframe areas begin with the H4. Stops are usually placed 1-3 pips beyond confirming structures.
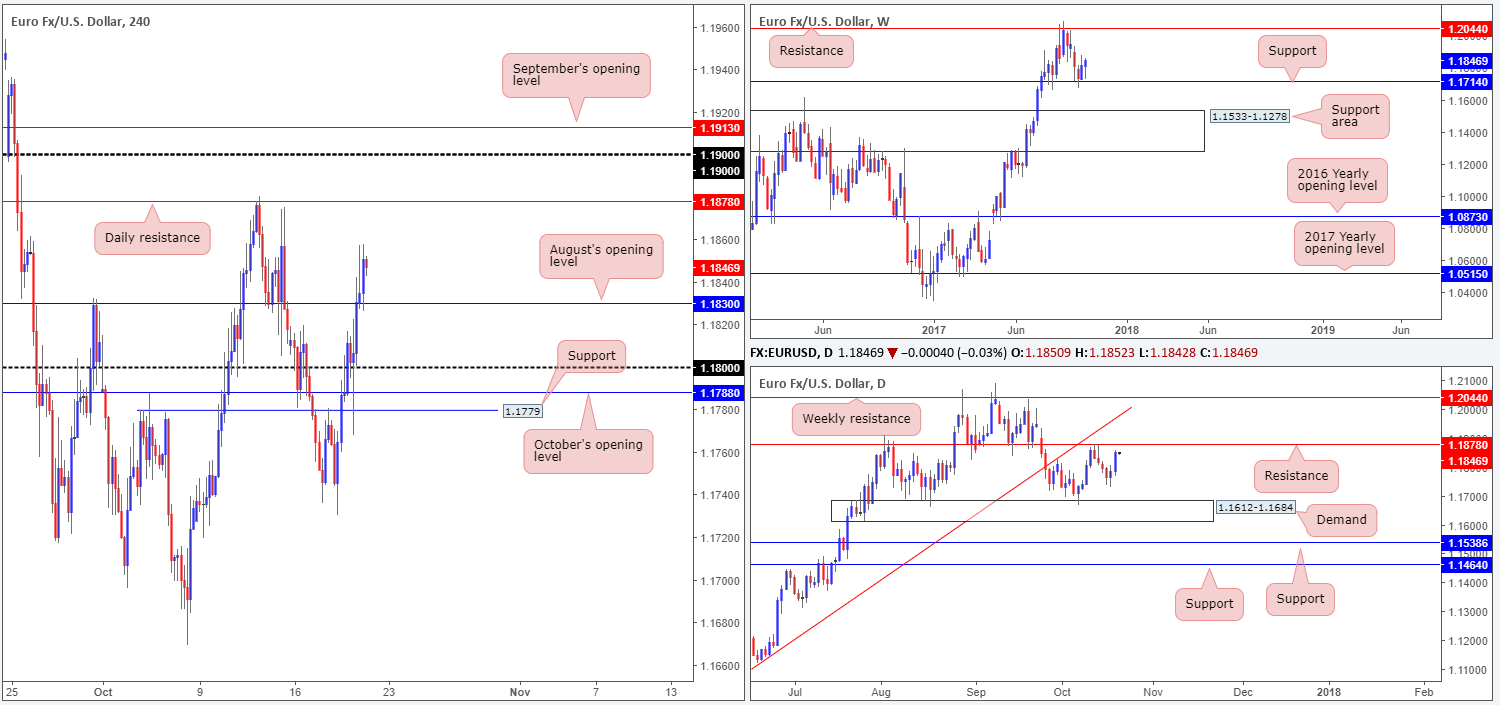
EUR/USD:
The single currency is seen trading with a reasonably strong bias to the upside this morning, which resulted in daily price chalking up a near-full-bodied bull candle on Thursday.
The H4 candles, as you can see, conquered August’s opening level at 1.1830 yesterday and shortly after retested the line as support. According to H4/daily structure, the pair now finds itself in front of daily resistance at 1.1878. Boasting a strong history (see daily timeframe), this level could potentially hamper further upside should the unit connect with this barrier today. The flip side to this, of course, is the weekly timeframe. For three weeks, the euro has been reasonably well-bid from support coming in at 1.1714, and shows room for the buyers to push as far north as resistance at 1.2044.
Suggestions: At current prices, neither a long nor short seems attractive.
Here’s why:
A long in this market, although in-line with weekly flow, would have you go against possible selling from daily resistance mentioned above 1.1878. Along similar lines, selling this market would be a reasonable opinion according to daily structure, but this would simultaneously place one in direct conflict with weekly buyers!
We just don’t feel the need to risk funds when the higher timeframes display a clear conflict of opinion.
Data points to consider: European council meeting at 11am ; US existing Home sales m/m at 3pm; FOMC member Mester speech at 7pm GMT+1.
Levels to watch/live orders:
- Buys: Flat (stop loss: N/A).
- Sells: Flat (stop loss: N/A).
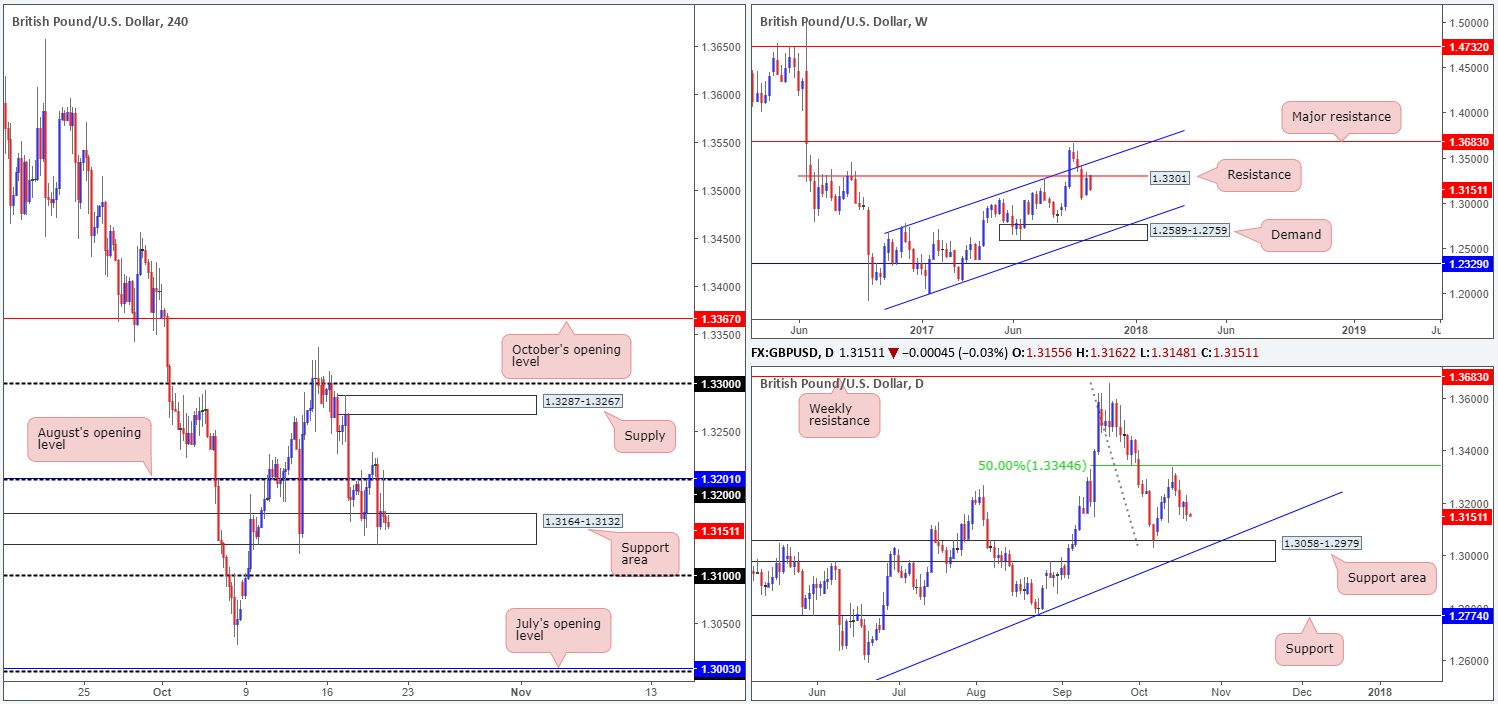
GBP/USD:
Since the 17th October, the British pound has been seen etching out a consolidation using a H4 support area fixed at 1.3164-1.3132 and the 1.32 handle/August’s opening level at 1.3201. Despite the somewhat abrupt selloff sparked by lower-than-expected UK retail sales yesterday, the range remains intact.
Turning our attention over to the weekly timeframe, resistance at 1.3301 continues to hold firm. A vigorous push lower from here would, as far as we can see, likely bring demand at 1.2589-1.2759 into the spotlight. Down on the daily timeframe, however, recent action printed a reasonably nice-looking bearish engulfing formation. In addition to this, there’s also room seen for the sellers to carry the unit down to demand pegged at 1.3058-1.2979, which happens to intersect with trendline support taken from the low 1.2108.
Suggestions: While weekly and daily structure point to further selling, a short on the H4 scale is problematic. Besides the current support area mentioned above at 1.3164-1.3132, directly below sits the 1.32 handle. And, even with 1.32 cleared, downside is limited due to the top edge of the daily support area at 1.3058.
Data points to consider: UK Public sector net borrowing at 9.30am; US existing Home sales m/m at 3pm; FOMC member Mester speech at 7pm GMT+1.
Levels to watch/live orders:
- Buys: Flat (stop loss: N/A).
- Sells: Flat (stop loss: N/A).
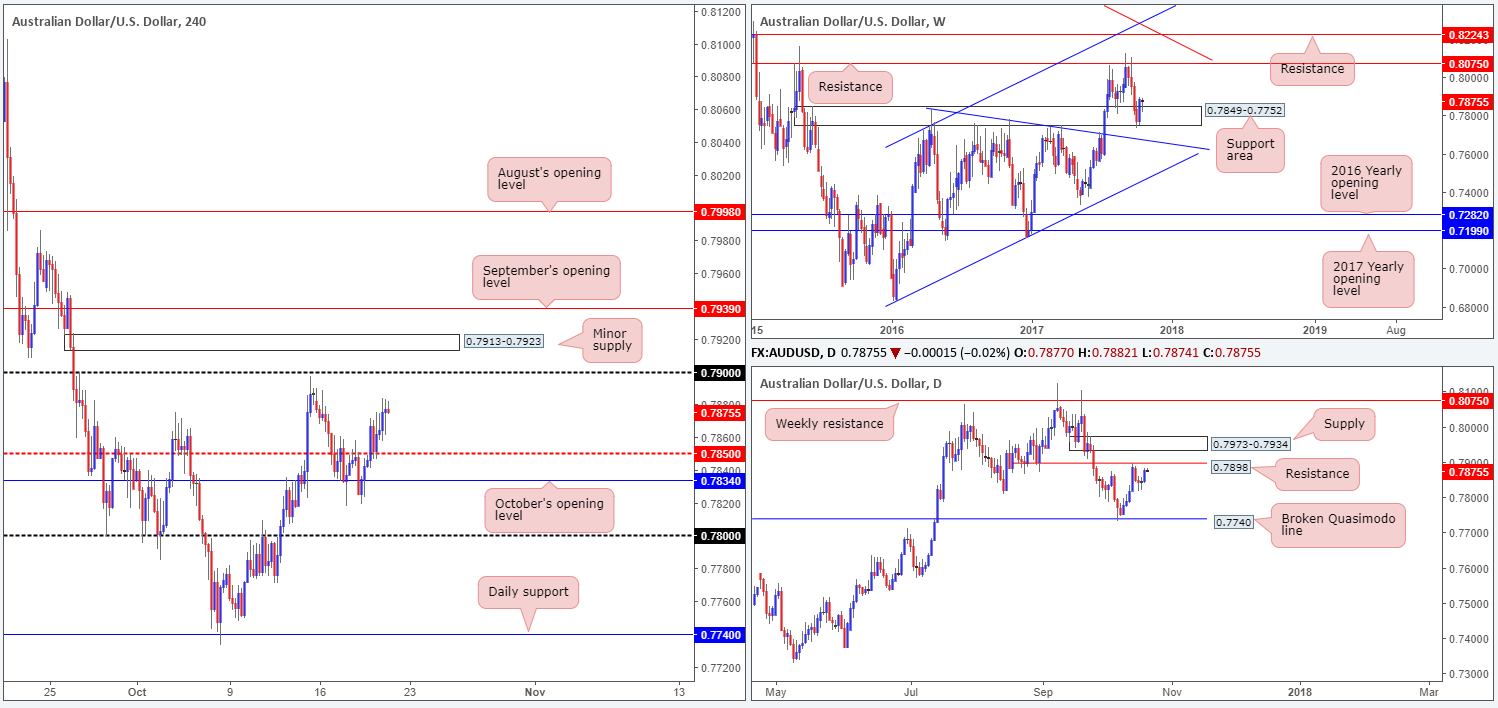
AUD/USD:
For the folks who read Thursday’s report you may recall that the desk underscored a probable buy trade should H4 price break through 0.7850 and retest it as support. As you can see, price did exactly that! The next upside target on the H4 scale, therefore, is the 0.79 handle.
Our reasoning behind the noted trade idea was simply due to room being seen above 0.7850 to move higher, weekly price trading from a support area at 0.7849-0.7752 (boasts strong historical significance that stretches back as far as April 2016) and daily action showing little resistance on the horizon until 0.7898.
Suggestions: Apart from our recent trade call, we also want to highlight a possible intraday sell opportunity at the long target (0.79). Once/if H4 price strikes 0.79, a fakeout will likely ensue up to nearby minor supply at 0.7913-0.7923. One can only imagine the stops embedded above 0.79! And with a great deal of traders likely unaware of the almost hidden supply lurking above, these stops are ripe for the taking.
As we said though, an intraday move should be all that’s expected from here, given where we are trading from on the weekly timeframe. How you trade this will be down to your individual trading plan as the move may only bounce a few pips and continue gravitating north, so trade cautiously, guys!
Data points to consider: US existing Home sales m/m at 3pm; FOMC member Mester speech at 7pm GMT+1.
Levels to watch/live orders:
- Buys: Flat (stop loss: N/A).
- Sells: Possible intraday sell from 0.79 (stop loss: for us, it’d have to be above nearby H4 supply at 0.7925).
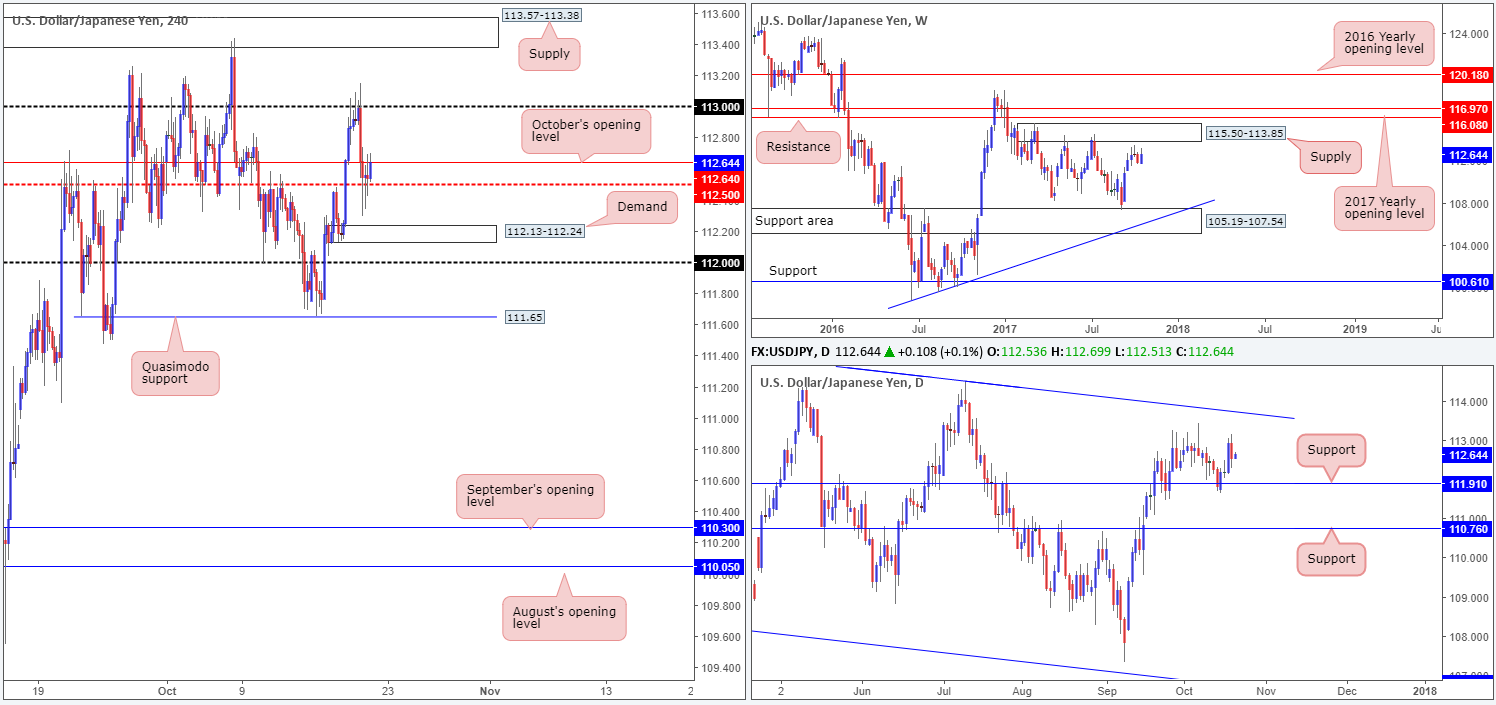
USD/JPY:
Boosted by safe-haven flows caused by a heavy selloff seen across major global stock markets on Thursday, the USD/JPY failed to sustain gains beyond the 113 handle. The day ended with H4 price aggressively whipsawing through the mid-level support band 112.50, followed by a tight consolidation between this number and October’s opening level at 112.64. A break above 112.64 today would likely unlock the path north back up to 113, whereas a push below 112.50 will, almost immediately, bring one face-to-face with demand at 112.13-112.24 (shadowed closely by the 112 handle).
From the weekly timeframe, the candles are currently facing in the direction of supply at 115.50-113.85. In conjunction with weekly price, daily action also looks poised to gravitate up to a trendline resistance extended from the high 115.50, which happens to intersect with the noted weekly supply.
Suggestions: In view of both the weekly and daily charts showing possible buying, we have absolutely no interest in shorting this market.
Due to H4 price offering a little more than 30 pips above 112.64 till we reach 113, a buy trade is also difficult and possibly not tradable without a small enough stop to accommodate risk/reward.
Data points to consider: US existing Home sales m/m at 3pm; FOMC member Mester speech at 7pm GMT+1.
Levels to watch/live orders:
- Buys: Flat (stop loss: N/A).
- Sells: Flat (stop loss: N/A).
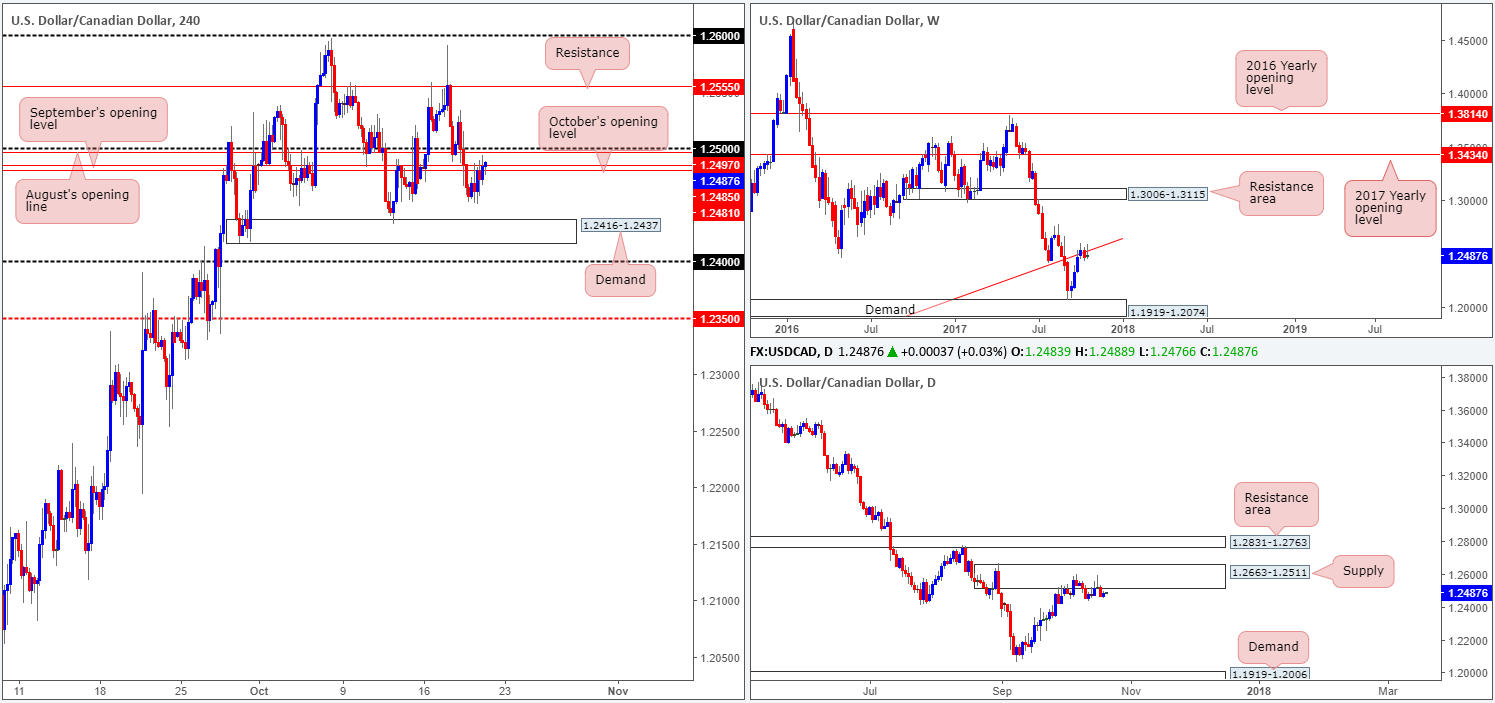
USD/CAD:
The USD/CAD took on more of a sober approach on Thursday, ranging no more than 45 pips on the day. With this is mind, the outlook for Friday’s movement will somewhat echo thoughts put forward in yesterday’s report…
As can be seen from the H4 timeframe this morning, the candles have been (and still are) seen teasing the underside of 1.25/1.2481 (Aug, Sept and Oct opening levels and the round number 1.25). This, by and of itself, is an incredibly confluent price zone and could encourage sellers into the market today. The next port of call on the H4 scale, should the bears continue to press lower, can be seen at demand drawn from 1.2416-1.2437, followed closely by the 1.24 handle.
As we underscored in several reports already, a move lower in this market should not come as a surprise to any technician who follows a multi-timeframe approach. On the weekly timeframe, we can see that the buyers and sellers are currently battling for position around the underside of a trendline resistance extended from the low 0.9633. In conjunction with the weekly timeframe, the daily timeframe shows that the candles remain fixed at supply drawn from 1.2663-1.2511.
Suggestions: With higher-timeframe structure in mind and the clear downtrend this market has been in since May, entering long is not something we would stamp high probability.
Selling this unit on the other hand would, in our technical view, be possible from 1.25/1.2481. However, we would insist on having a reasonably sized H4 bearish candle form, prior to pulling the trigger here. The reason being is simply due to the possibility of the round number acting as a magnet to price, and therefore potentially prompting a fakeout.
Data points to consider: US existing Home sales m/m at 3pm; FOMC member Mester speech at 7pm; CAD CPI m/m and CAD retail sales m/m at 1.30pm GMT+1.
Levels to watch/live orders:
- Buys: Flat (stop loss: N/A).
- Sells: 1.25/1.2481 ([waiting for a reasonably sized H4 bearish candle to form – preferably a full, or near-full-bodied candle – is advised] stop loss: ideally beyond the candle’s wick).
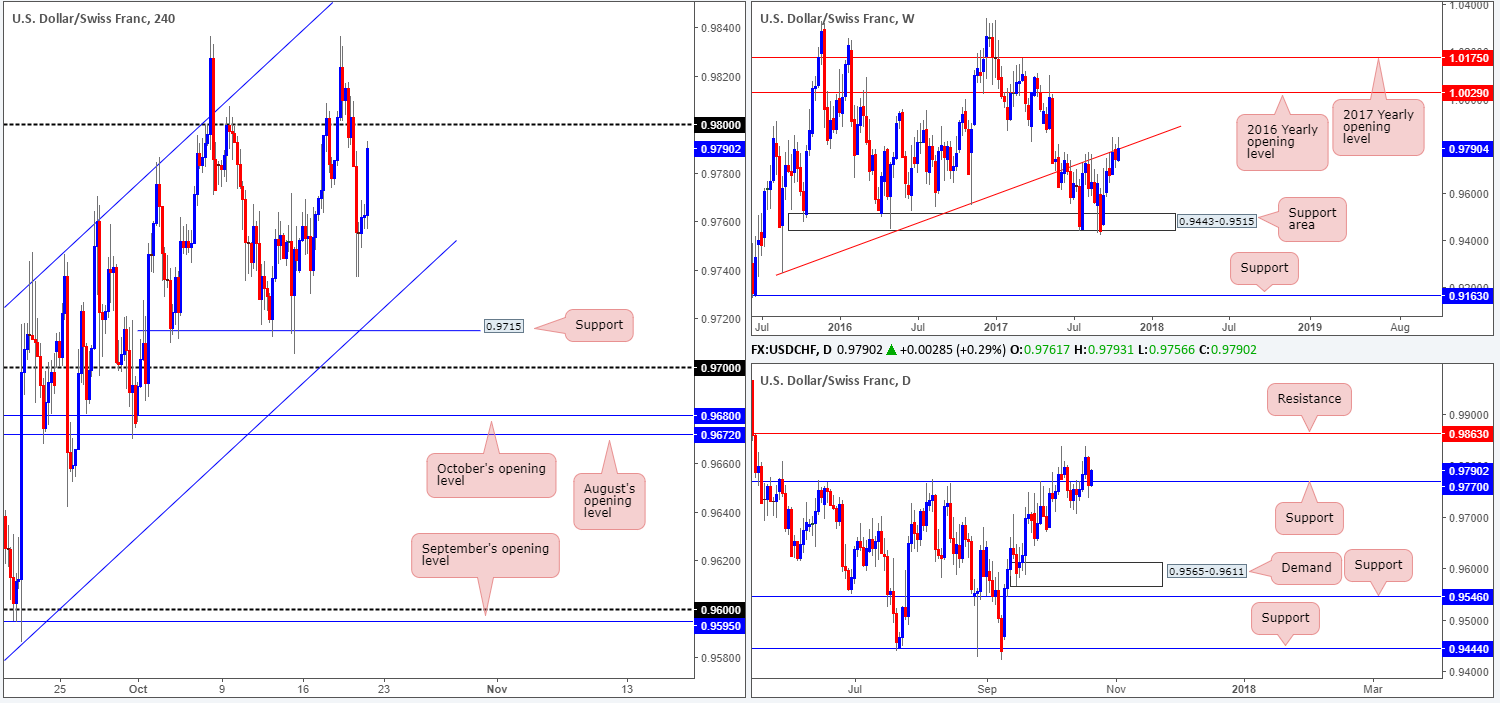
USD/CHF:
Using a top-down approach this morning, we can see that weekly price continues to challenge the underside of a trendline resistance extended from the low 0.9257. From a technical standpoint, the daily support at 0.9770 is likely what’s stopping the bears from spreading lower.
As we write, the current H4 candle is aggressively pushing higher. This is due to the US Senate passing the 2018 budget blueprint, setting the stage for Republican tax reform effort. The next technical ceiling on the radar is the 0.98 handle.
Suggestions: With weekly movement suggesting sellers have the upper hand, and the daily timeframe highlighting support, alongside recent US news, trading this market is a tad fiddly. As such, we have opted to remain on the sidelines for now.
Data points to consider: US existing Home sales m/m at 3pm; FOMC member Mester speech at 7pm GMT+1.
Levels to watch/live orders:
- Buys: Flat (stop loss: N/A).
- Sells: Flat (stop loss: N/A).
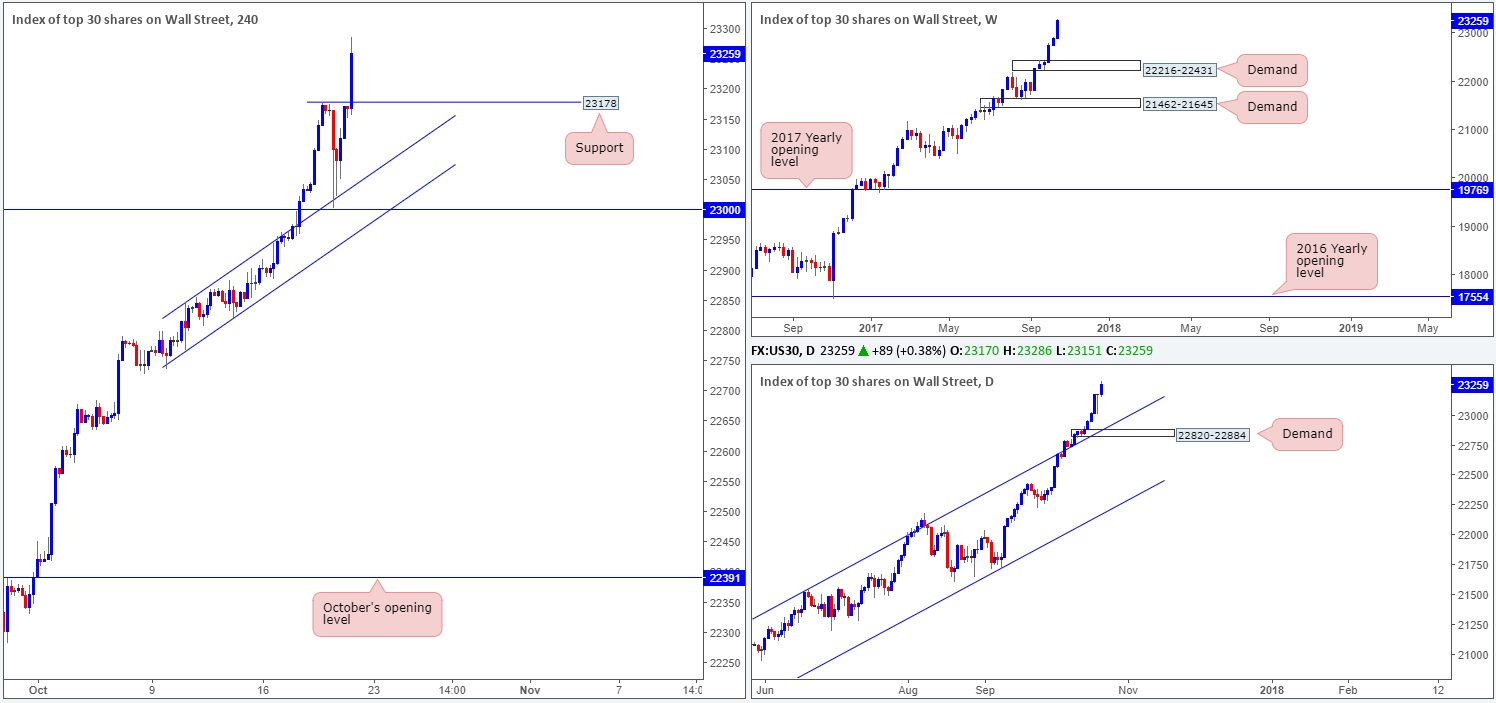
DOW 30:
Thanks to the US Senate recently adopting budget, and therefore giving momentum to Trump’s tax-cut plans, US stocks are up 0.3% and are, as we write, tapping a record high of 23286.
This came after a brisk selloff to lows of 23003 on Thursday, which, as you can see, was supported by not only the 23000 landmark, but also a H4 channel resistance-turned support taken from the high 22846.
Suggestions: While this is certainly a buyers’ market right now, we’re finding it difficult to pin down any worthy supports at the moment. The H4 line marked at 23178 (Wednesday’s high) is, of course, a potential candidate, but not really a stripe we’d label as high probability due to little converging confluence seen here. In saying that though, should H4 price strike this level today and hold ground in the shape of a full or near-full-bodied candle, we may consider pressing the buy button, given the strength of the underlying trend.
Data points to consider: US existing Home sales m/m at 3pm; FOMC member Mester speech at 7pm GMT+1.
Levels to watch/live orders:
- Buys: 23178 region ([waiting for a reasonably sized H4 bullish candle to form – preferably a full, or near-full-bodied candle – is advised] stop loss: ideally beyond the candle’s tail)
- Sells: Flat (stop loss: N/A).
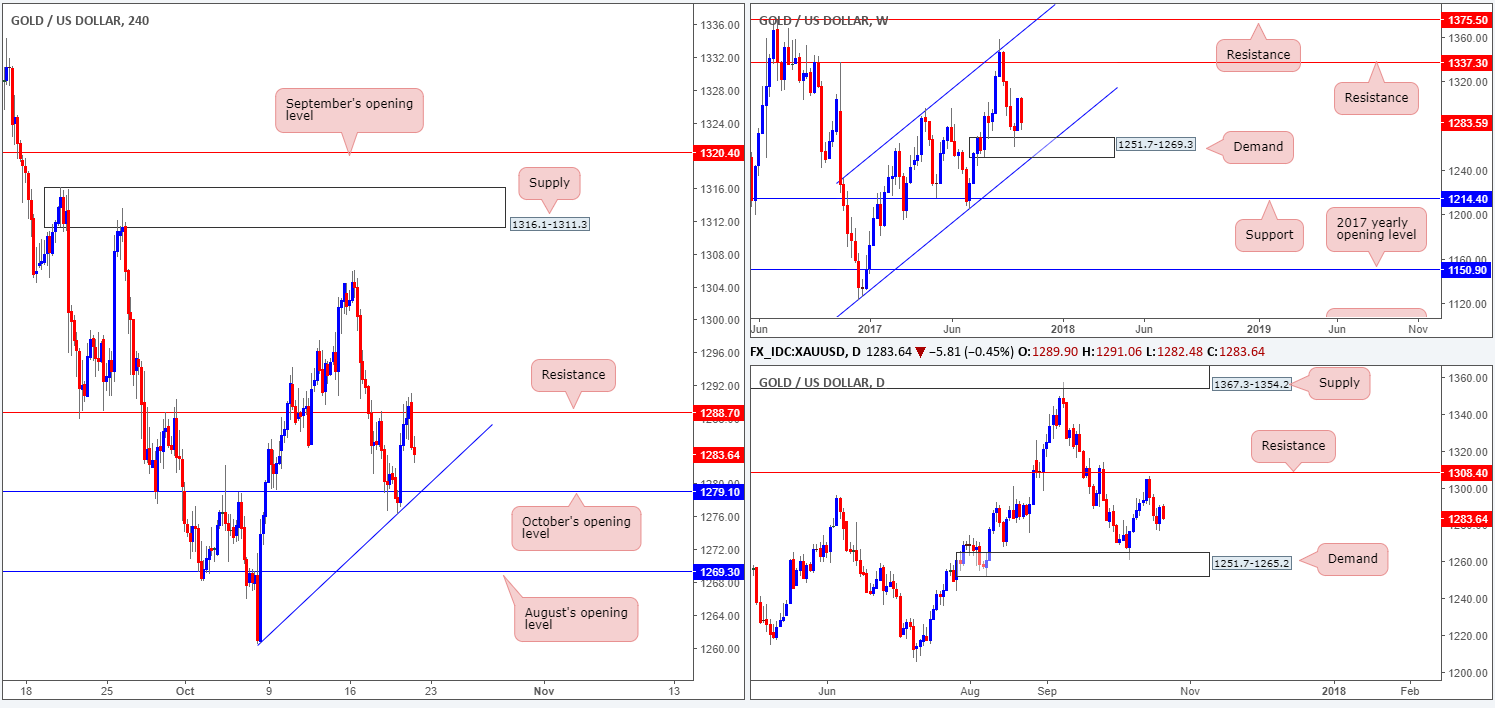
GOLD:
Trade update: closed for breakeven – see Thursday’s report for details.
In recent dealings, the price of gold took on a somewhat negative tone after the US dollar caught a fresh bid on the back of recent US tax reform news. Provided that the bears maintain this posture, the next port of call will likely be October’s opening level at 1279.1 on the H4 timeframe, which happens to converge nicely with a trendline support etched from the low 1260.4. So, with that level on the radar, would it be a base to consider buying from?
Entering long from 1279.1 is certainly an option, but we feel it may only be good for a bounce at best. This simply comes down to seeing space for daily sellers to push down to demand drawn from 1251.7-1265.2.
Suggestions: Given the current landscape, we’ll pass on a long from 1279.1. A far better line for a buy trade, in our opinion, is August’s opening level at 1269.3. Besides this line being positioned just ahead of the noted daily demand, 1269.3 also denotes the top edge of a weekly demand area coming in at 1251.7-1269.3.
Levels to watch/live orders:
- Buys: 1269.3 region ([waiting for a reasonably sized H4 bullish candle to form – preferably a full, or near-full-bodied candle – is advised] stop loss: ideally beyond the candle’s tail).
- Sells: Flat (stop loss: N/A).


