
Key risk events today:
Japanese banks closed in observance of Vernal Equinox Day; Canada Core Retail Sales m/m and Retail Sales m/m.
(Previous analysis as well as outside sources – italics).
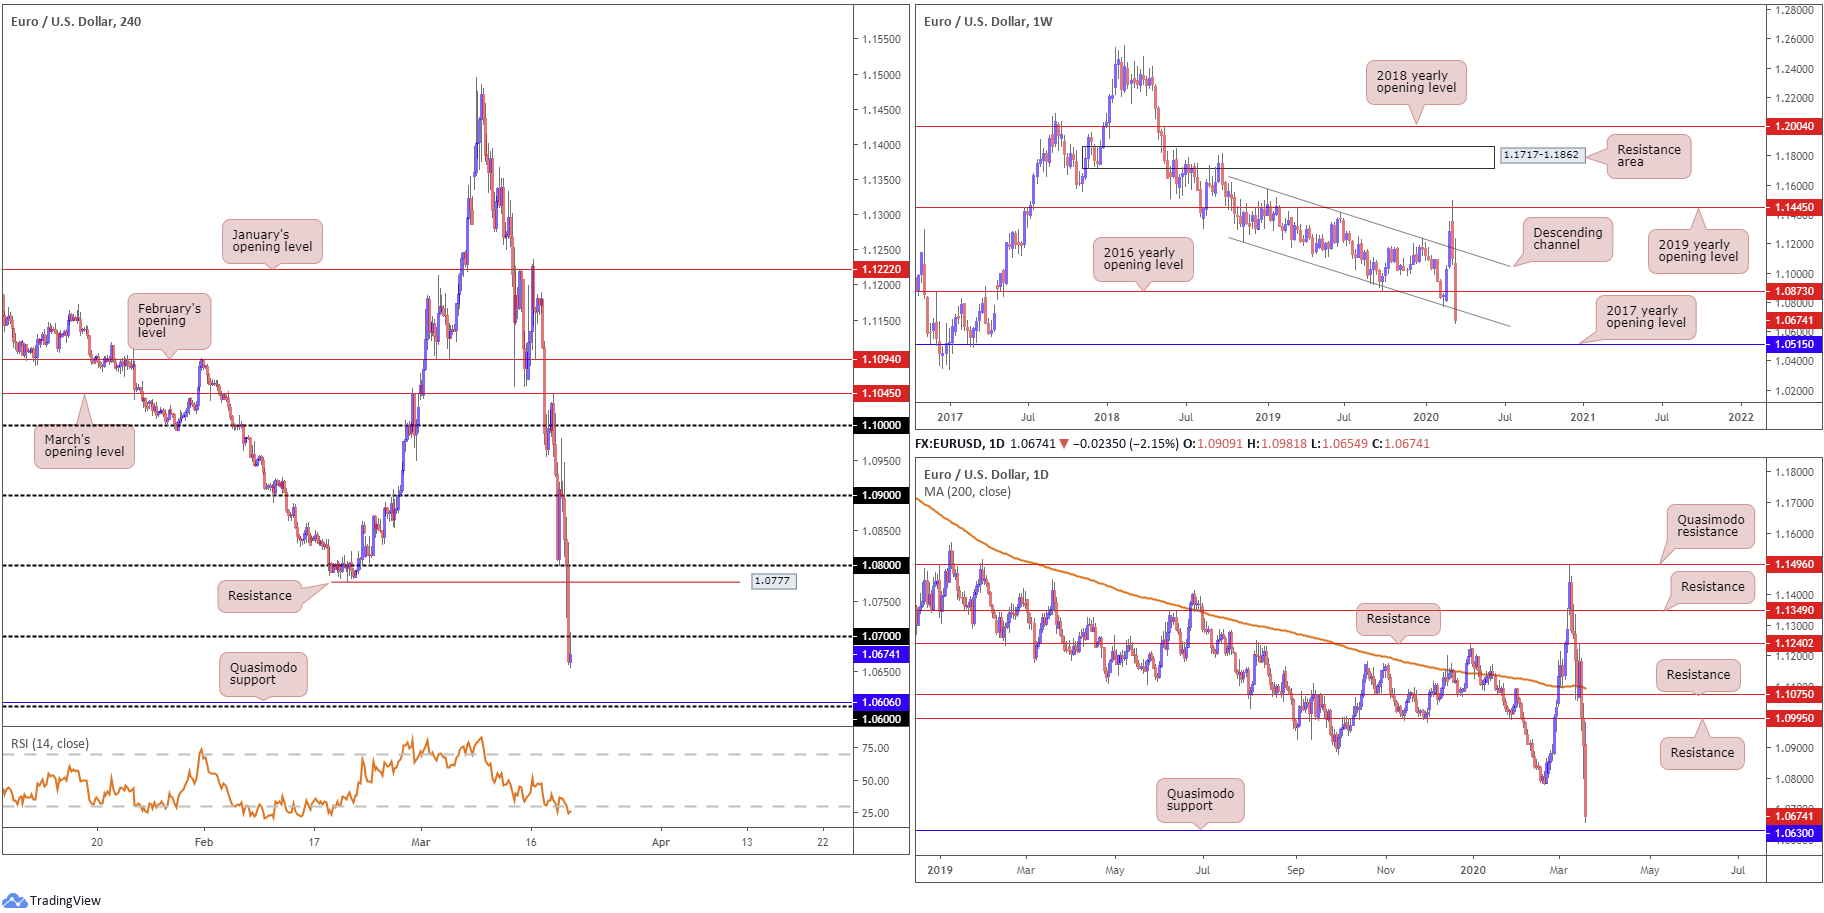
EUR/USD:
Led by unrelenting demand for the buck, Europe’s shared currency extended losses for a third successive session Thursday. Erasing more than 200 points and registering 37-month lows at 1.0654, EUR/USD tunnelled through a number of key technical supports, including the 1.0777 level and the 1.07 handle. The break of 1.0777 is significant in this market, tripping heavyweight sell-stop liquidity consequently fuelling downside.
With 1.07 now likely to represent resistance, bolstered by the fact the round number also signifies a Quasimodo support-turned resistance (see April 19, 2017), sellers may strengthen their grip and make a beeline for a Quasimodo support level fixed at 1.0606, followed by the 1.06 handle. What’s also notable from a technical perspective is the relative strength index (RSI) continues to toy with oversold terrain.
Further out on the weekly timeframe, channel support, taken from the low 1.1215, was recently engulfed, potentially clearing the pathway for further losses towards the 2017 yearly opening level at 1.0515. Elsewhere, on the daily timeframe we can see price is poised to approach Quasimodo support at 1.0630, with a rejection off this level likely making a play for 1.0777, a H4 resistance, though clearly also visible on the daily and weekly scale.
Areas of consideration:
With all three timeframes exhibiting scope to the downside, further selling south of 1.07 is a possibility. Should the H4 candle close as is, in the shape of a rejection wick, this will likely generate moves to daily Quasimodo support at 1.0630, followed by H4 Quasimodo support at 1.0606 and the 1.06 handle.
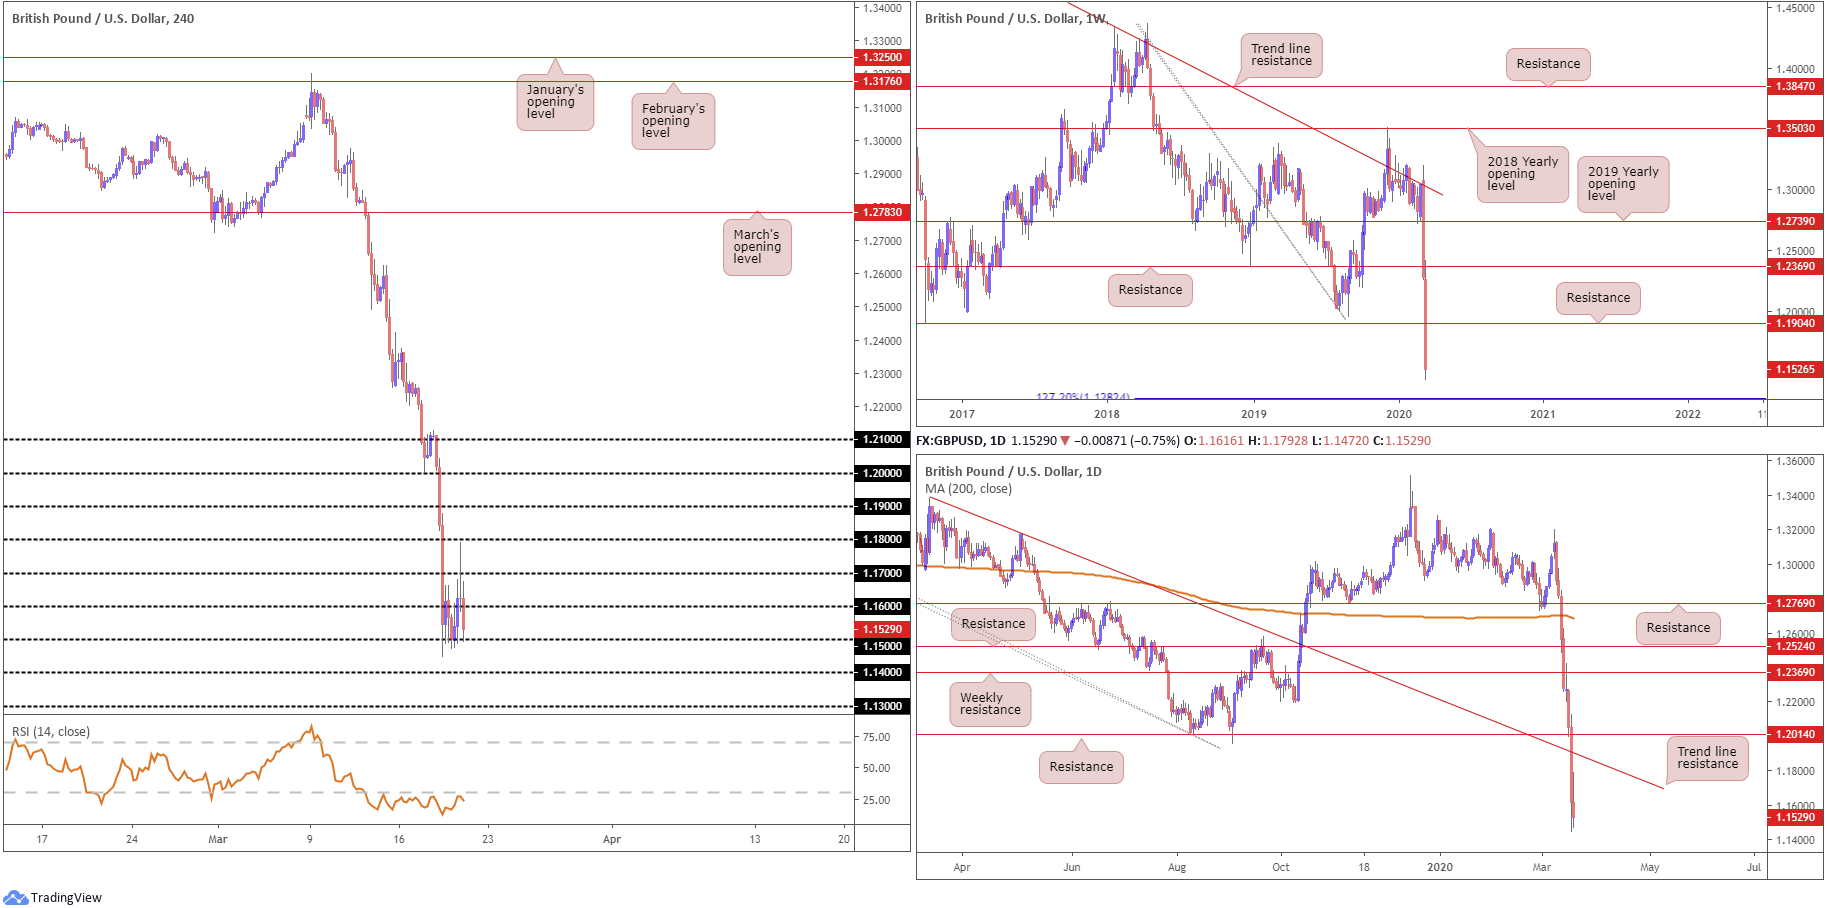
GBP/USD:
Following Wednesday’s grim sell-off that scored multi-year lows, the British pound staged a comeback Thursday after the Bank of England (BoE) slashed interest rates from 0.25% to 0.1%, and unveiled an extra £200 bn to its quantitative easing (QE) program. Despite the surge, recovery peaks at 1.1792 emerged, a touch south of the 1.18 handle, with price recoiling into negative territory, currently fading the 1.15 base. Amidst rampant demand for dollars, the relative strength index (RSI) also remains housed within oversold terrain, though currently bottoming off 15.00.
Currently down more than 6% on the week, weekly support at 1.1904 offered little respite, with long-term flow eyeing the 127.2% Fibonacci extension point at 1.1282 as the next possible downside target. Before reaching this far south, however, traders may want to pencil in the possibility of a retest at 1.1904.
The daily timeframe houses a similar support target at 1.1282, the weekly 127.2% Fibonacci extension. Daily structure, though, reveals possible resistance emerging off a trend line formation, taken from the high 1.3380. It should also be noted the 200-day SMA value at 1.2684 is turning lower after remaining flat since November 2019.
Areas of consideration:
Although holding off 1.15 on the H4, both weekly and daily timeframes exhibit scope to approach 1.1282, essentially the 1.13 handle. As such, a H4 close beneath 1.15 could spark further selling in this market, targeting moves beyond 1.14 to 1.13. Conservative traders may opt to wait and see if a retest at 1.15 materialises before pulling the trigger; others may be satisfied with short entries on the H4 breakout candle south of 1.15.
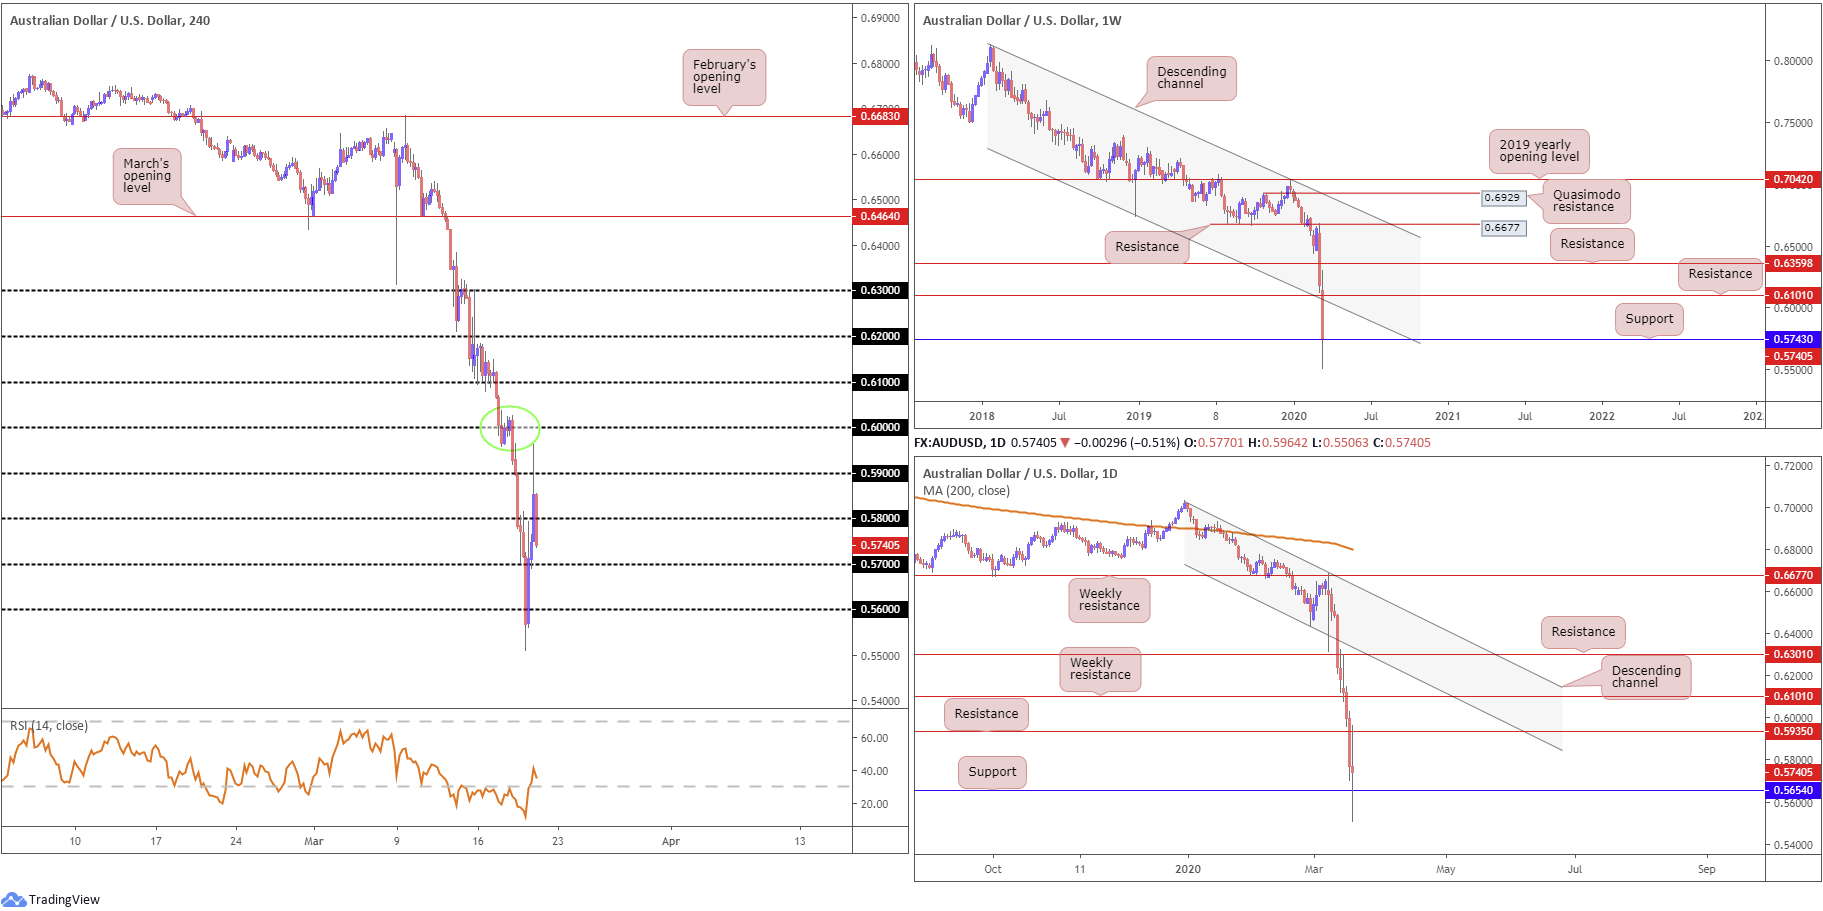
AUD/USD:
Thursday had AUD/USD embrace fresh seventeen-year lows at 1.5506, before staging a near-400-point recovery to highs at 0.5963, testing H4 supply (green oval) at 0.6027-0.5958 in the process, before turning to levels south of 1.58.
The Reserve Bank of Australia (RBA) cut rates by 25 bps to 0.25%, while on a positive note, Aussie unemployment fell to 5.1%. The real game-changer appeared to be the Fed extending and expanding swap lines to the likes of the RBA and RBNZ. The impact was short-lived, however, as the US dollar index continued to reign supreme into the close, closing in on the 103.00 handle.
Weekly sellers embraced support at 0.5743 in recent trading, with a rejection possibly paving the way for an approach to channel support-turned resistance, taken from the low 0.6744. Meanwhile, on the daily timeframe, price action shook hands with support coming in at 0.5654 yesterday, with resistance standing at 0.5935. Candlestick traders will note the day’s activity chalked up a long-legged doji formation, generally considered to be a sign of indecision and confusion.
Areas of consideration:
Despite the relative strength index (RSI) recovering from oversold territory on the H4, H4 action closed back beneath 0.58, suggestive of moves towards 0.57. Traders intent on shorting this market, though, must take into account weekly price tests support at 0.5743 and daily flow is seen coming off 0.5654, therefore downside could be hindered.
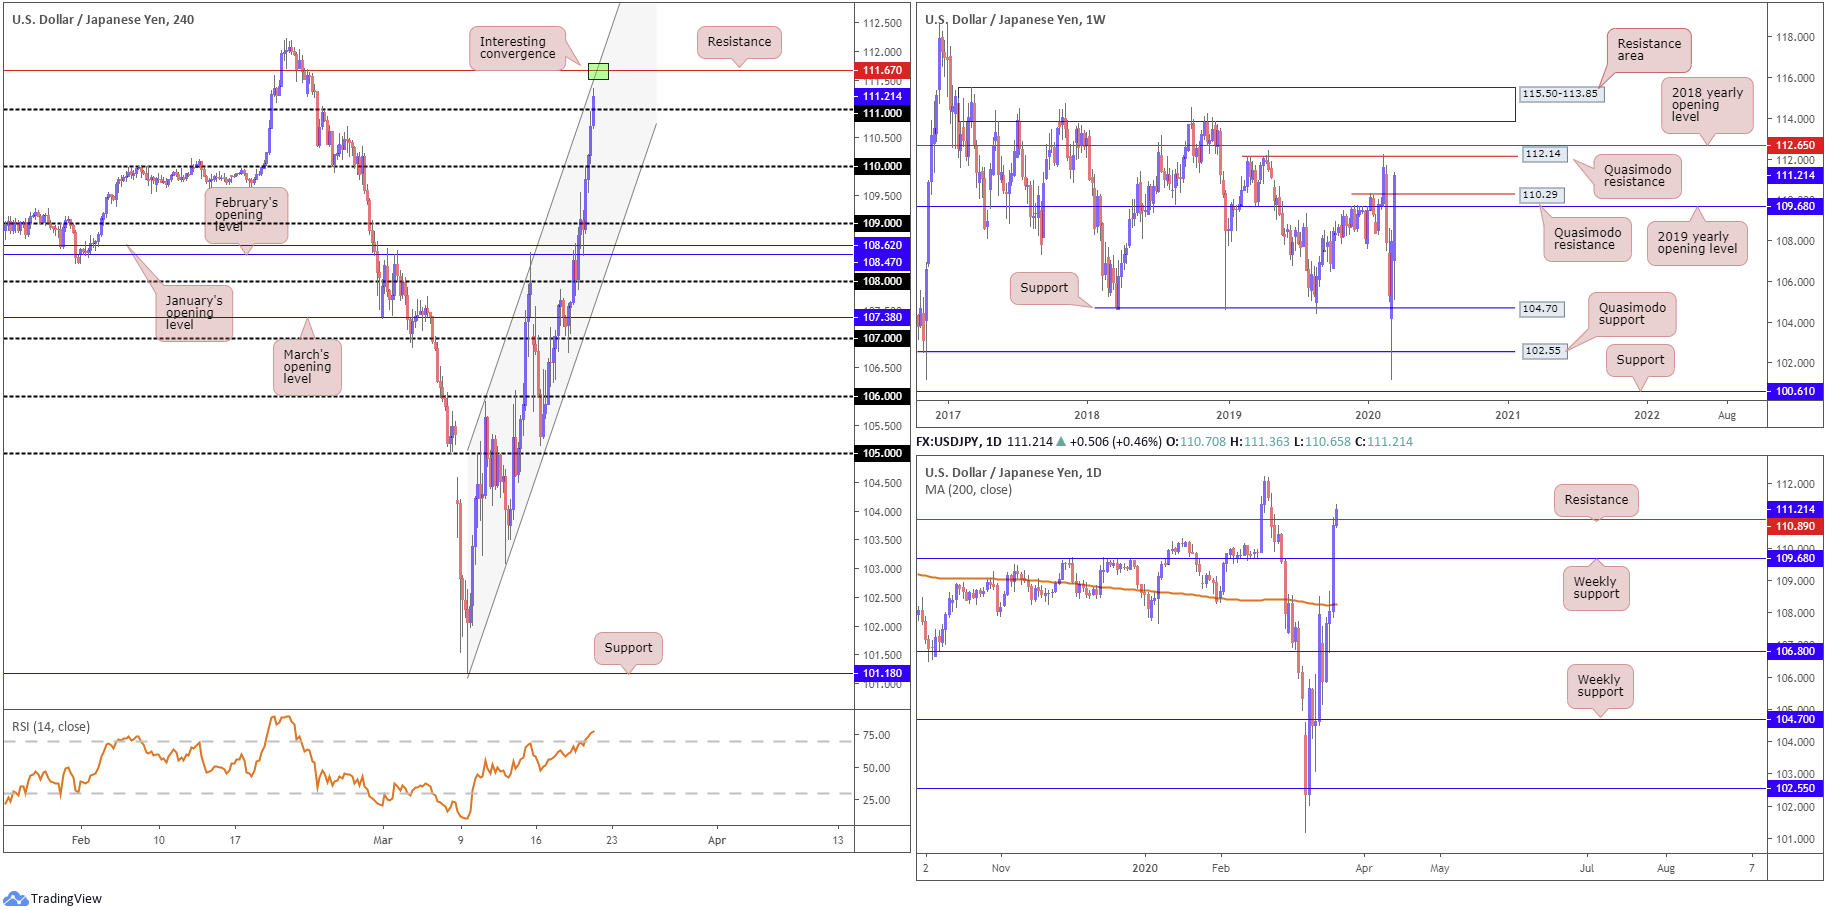
USD/JPY:
The US dollar index reserved a strong underlying bid Thursday, retaining its safe-haven status amid fresh coronavirus headlines.
USD/JPY trade, based on the weekly timeframe, crossed its 2019 yearly opening level to the upside at 109.68 and a Quasimodo resistance at 110.29. This may prep the ground for a run to familiar Quasimodo resistance at 112.14, trailed closely by the 2018 yearly opening level at 112.65.
Led by broad-based USD bidding, USD/JPY registered 2.4% gains Thursday, overthrowing the noted weekly levels and testing daily resistance at 110.89. In recent hours, additional upside has seen the daily resistance’s mettle tested. Within reason, a daily close north of 110.89 may be viewed as a prompt we’re headed for the weekly Quasimodo resistance at 112.14.
Across the page on the H4 timeframe, the unit engages with the 111 handle, closely dovetailing with channel resistance, extended from the high 105.91. Also of interest here is the resistance level stationed at 111.67 and the relative strength index (RSI) recently climbing into overbought space.
Areas of consideration:
The point marked in green on the H4 timeframe – the area H4 resistance at 111.67 and H4 channel resistance merge – may be an area of interest for sellers today. A key technical aspect here is liquidity above 111, in the form of buy stops, which will likely appeal to larger sellers.
The downside to shorts in this market, aside from the obvious uptrend in play, is daily price recently tackling resistance at 110.89 and weekly action exhibiting scope to run higher. As such, traders may consider waiting for additional confirmation off 111.67 before pulling the trigger. Of course, though this is trader dependent.
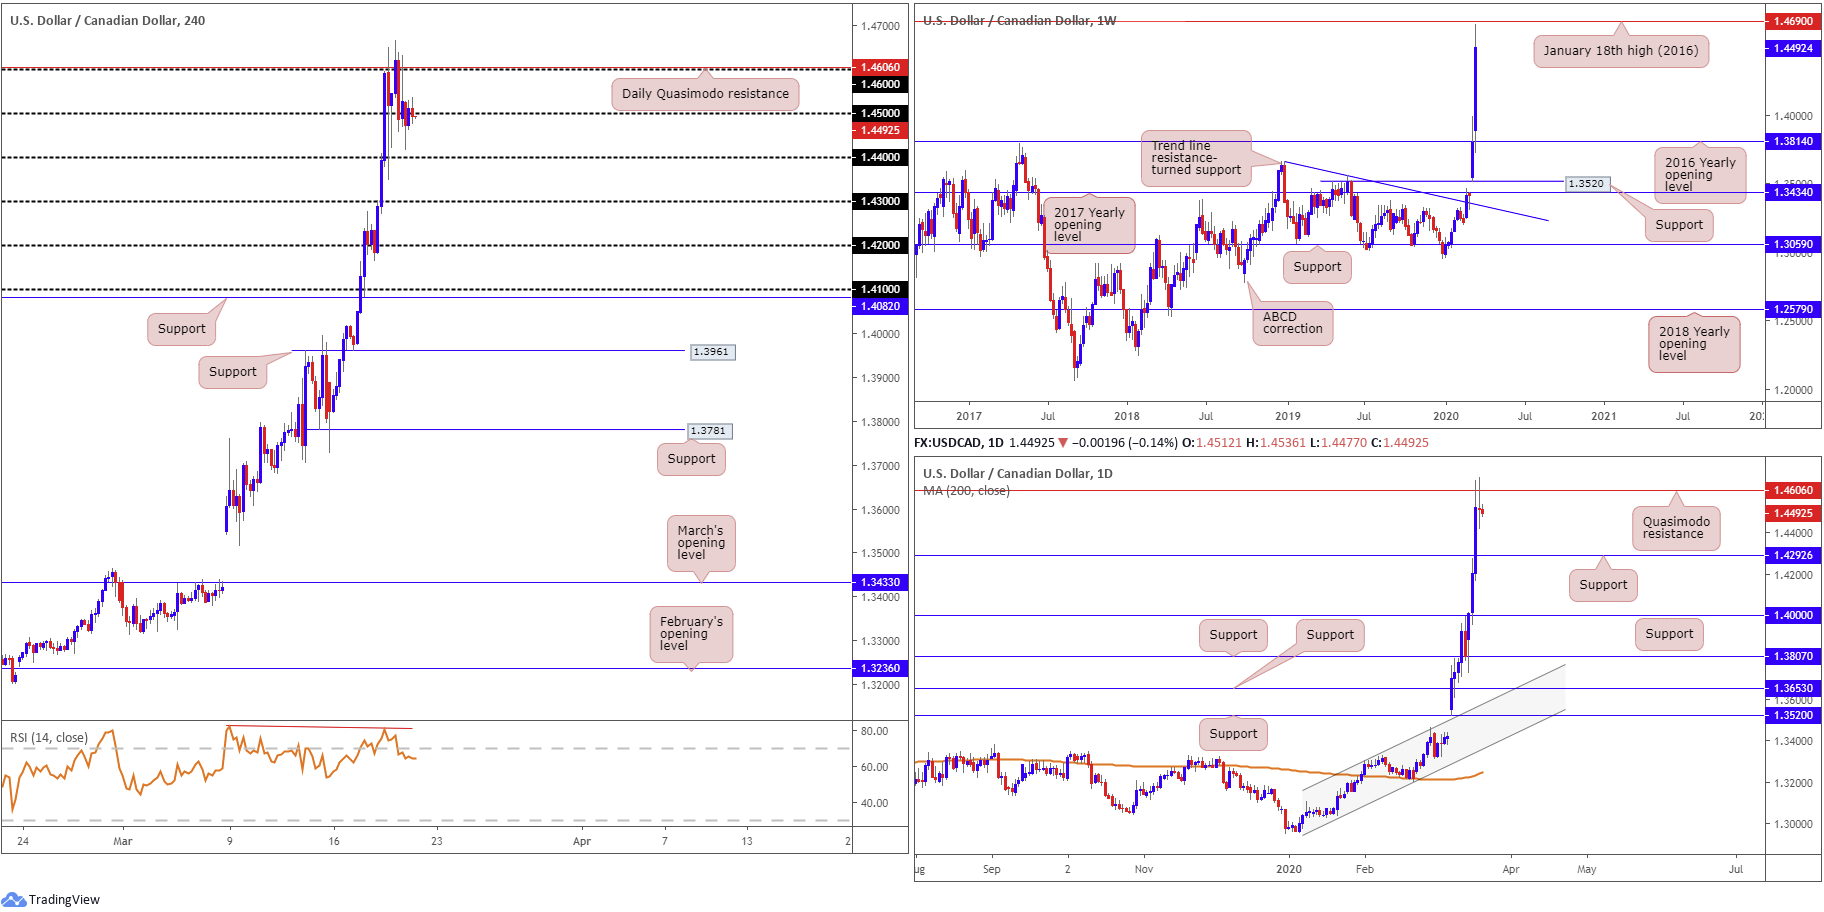
USD/CAD:
Despite rising to highs of 1.4667, USD/CAD bulls lost their flavour amid a recovery in oil prices from $20.08/bbl.
Daily Quasimodo resistance at 1.4606 elbowed its way into the spotlight in recent trading by way of a doji candlestick formation, dovetailing closely with the 1.46 handle on the H4 timeframe and confirmed by RSI bearish divergence. This was highlighted resistance in Thursday’s technical briefing.
The said daily Quasimodo formation is key to this market, located a touch beneath the 1.4690 January 18th high (2016), positioned on the weekly timeframe.
Areas of consideration:
For those who read Thursday’s analysis you may recall the following:
A H4 close below 1.45 today will likely arouse seller interest to 1.44 and possibly 1.43, closely shadowed by daily support at 1.4292. The recent pullback to lows at 1.4349 likely did a good job of clearing most buyers in this vicinity, therefore the path south, theoretically, should be clear.
Conservative sellers may seek additional confirmation before committing; this could be something as simple as a retest at the underside of 1.45. Other traders may feel the evidence presented – daily Quasimodo resistance at 1.4606 entering the fold – may be enough to justify a short on a H4 candle close beneath 1.45.
The above pieces remain valid into today’s session. Those who already took shorts based on a H4 close beneath 1.45 were likely already taken out for breakeven or small gains, given recent fluctuations around 1.45.
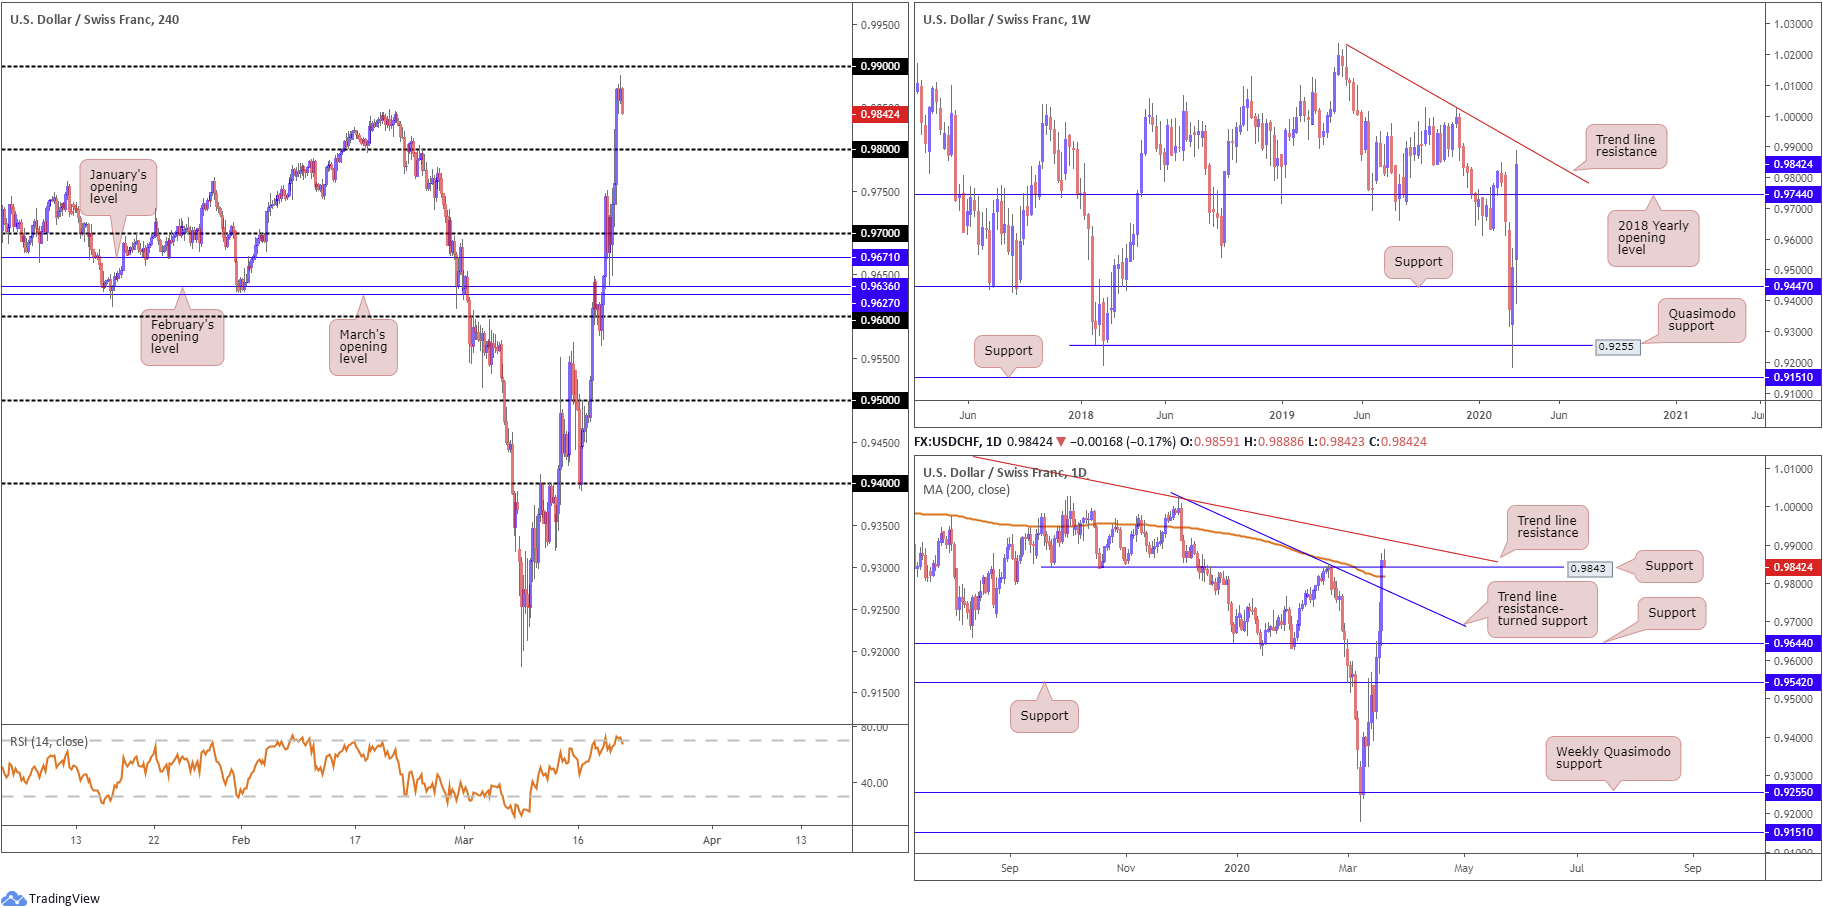
USD/CHF:
The US dollar concluded Thursday strongly higher against the Swiss franc, adding more than 180 points, or 1.90%. With FX volatility off the charts, USD/CHF surpassed the 0.9848 February 20th high and tests levels a few points south of 0.99, consequently pulling the relative strength index (RSI) into oversold territory. One can only imagine the number of buy stops tripped in recent movement. Technicians with a focus on price-action based strategies may also want to note the 0.99 handle also represents Quasimodo resistance, with the left shoulder taken from early December 2019.
Further afield on the weekly timeframe, the key observation is trend line resistance, taken from the high 1.0226. The 2018 yearly opening level at 0.9744 fell through amidst recent bidding and now represents feasible support. Elsewhere, daily price pressured its way through trend line resistance, extended from the high 1.0023, the 200-day SMA (orange – 0.9817) and resistance at 0.9843 (now potential support). Moderate supply is visible to the left of price, though not much to get excited about. The next real challenge, in terms of resistance, on this scale can be seen around the weekly trend line resistance highlighted above.
Areas of consideration:
Daily support at 0.9843 is, at the time of writing, facing a retest. Buyers from this region face the possibility of a whipsaw to the 200-day SMA. Upside targets from this region reside around the 0.99 handle and the current weekly trend line resistance.
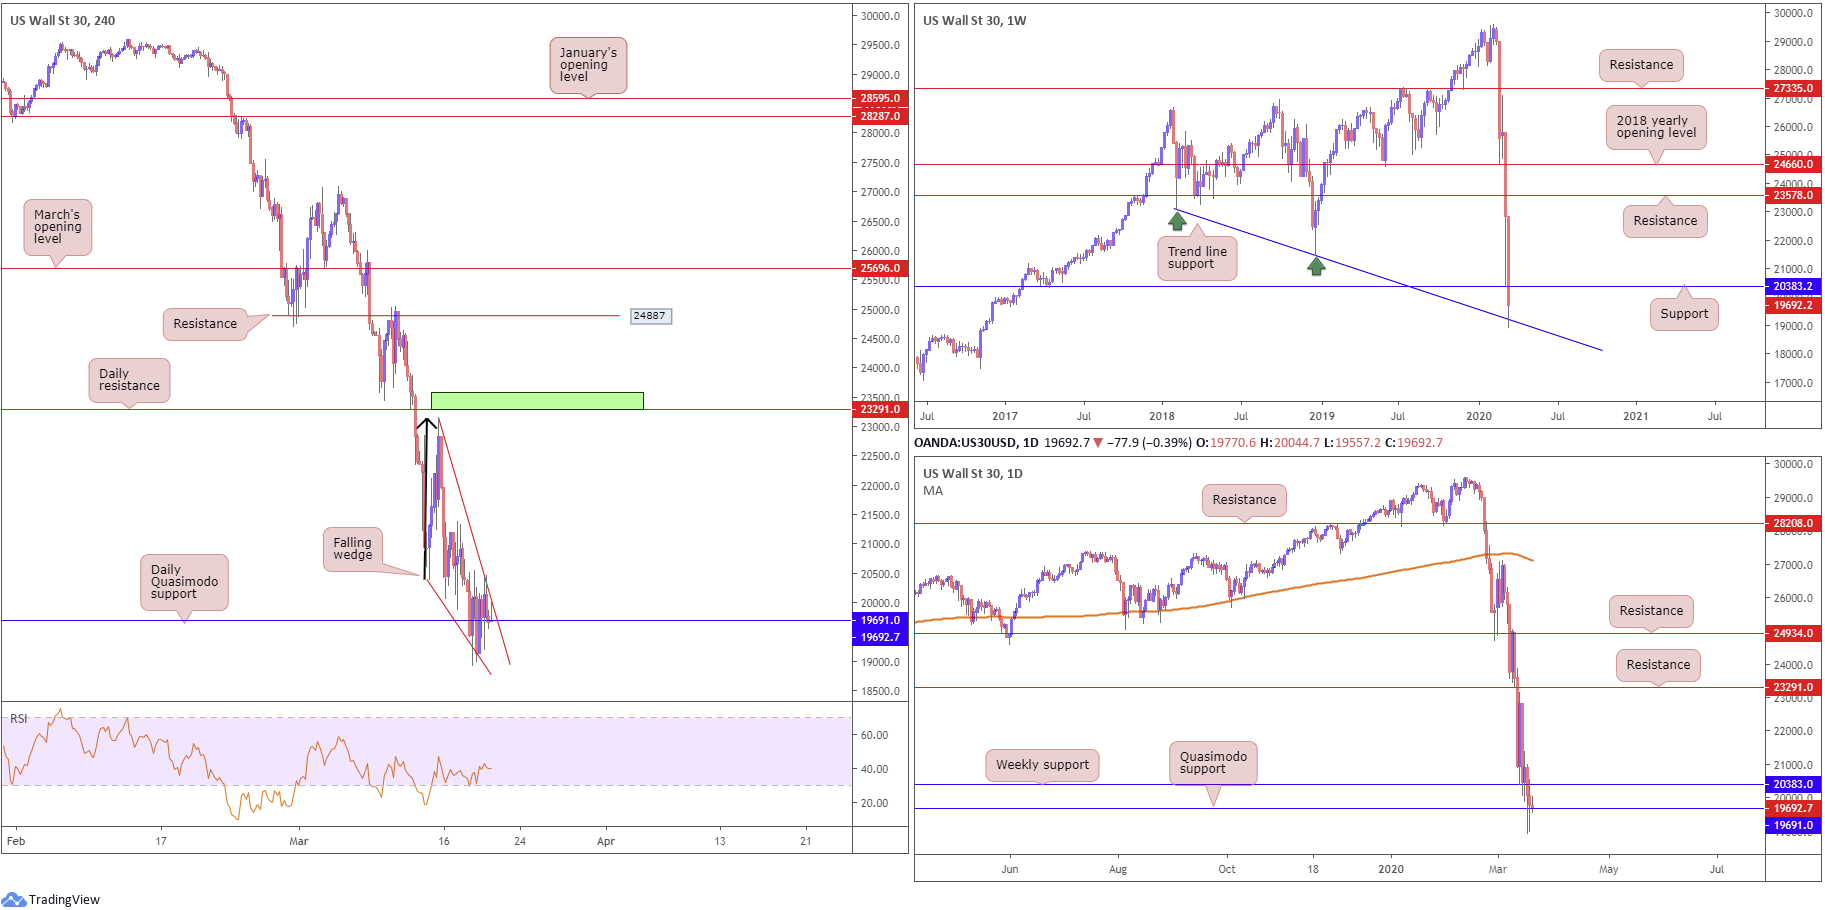
Dow Jones Industrial Average:
Major US benchmarks modestly firmed Thursday, reinforced by central banks pledging support for the economic shocks from the coronavirus pandemic. The Dow Jones Industrial Average advanced 188.27 points, or 0.95%; the S&P 500 also gained 11.31 points, or 0.47%, and the tech-heavy Nasdaq 100 ended higher by 113.35 points, or 1.58%.
From a technical standpoint, price action on the weekly timeframe overthrew support at 20383 but embraced trend line support, pencilled in from the low 23055. As of writing, buyers lack conviction from here.
The daily Quasimodo support at 19691 remains in play, withstanding two downside attempts in recent trading. This level also represents support on the H4 timeframe.
In addition to the above structure, it appears the H4 candles are compressing within a descending (or falling) wedge formation (23145/20385). This is typically considered a bullish reversal signal.
Areas of consideration:
The combination of weekly support at 20383, shadowed closely by daily Quasimodo support at 19691 and a H4 descending wedge pattern may be enough to encourage further upside today. As such, a H4 close above the upper limit of the descending wedge will likely offer traders an entry long into this market, with protective stop-loss orders generally positioned beneath the lower limit of the formation and a take-profit target measured from the base of the pattern (black arrow) and added to the breakout point.
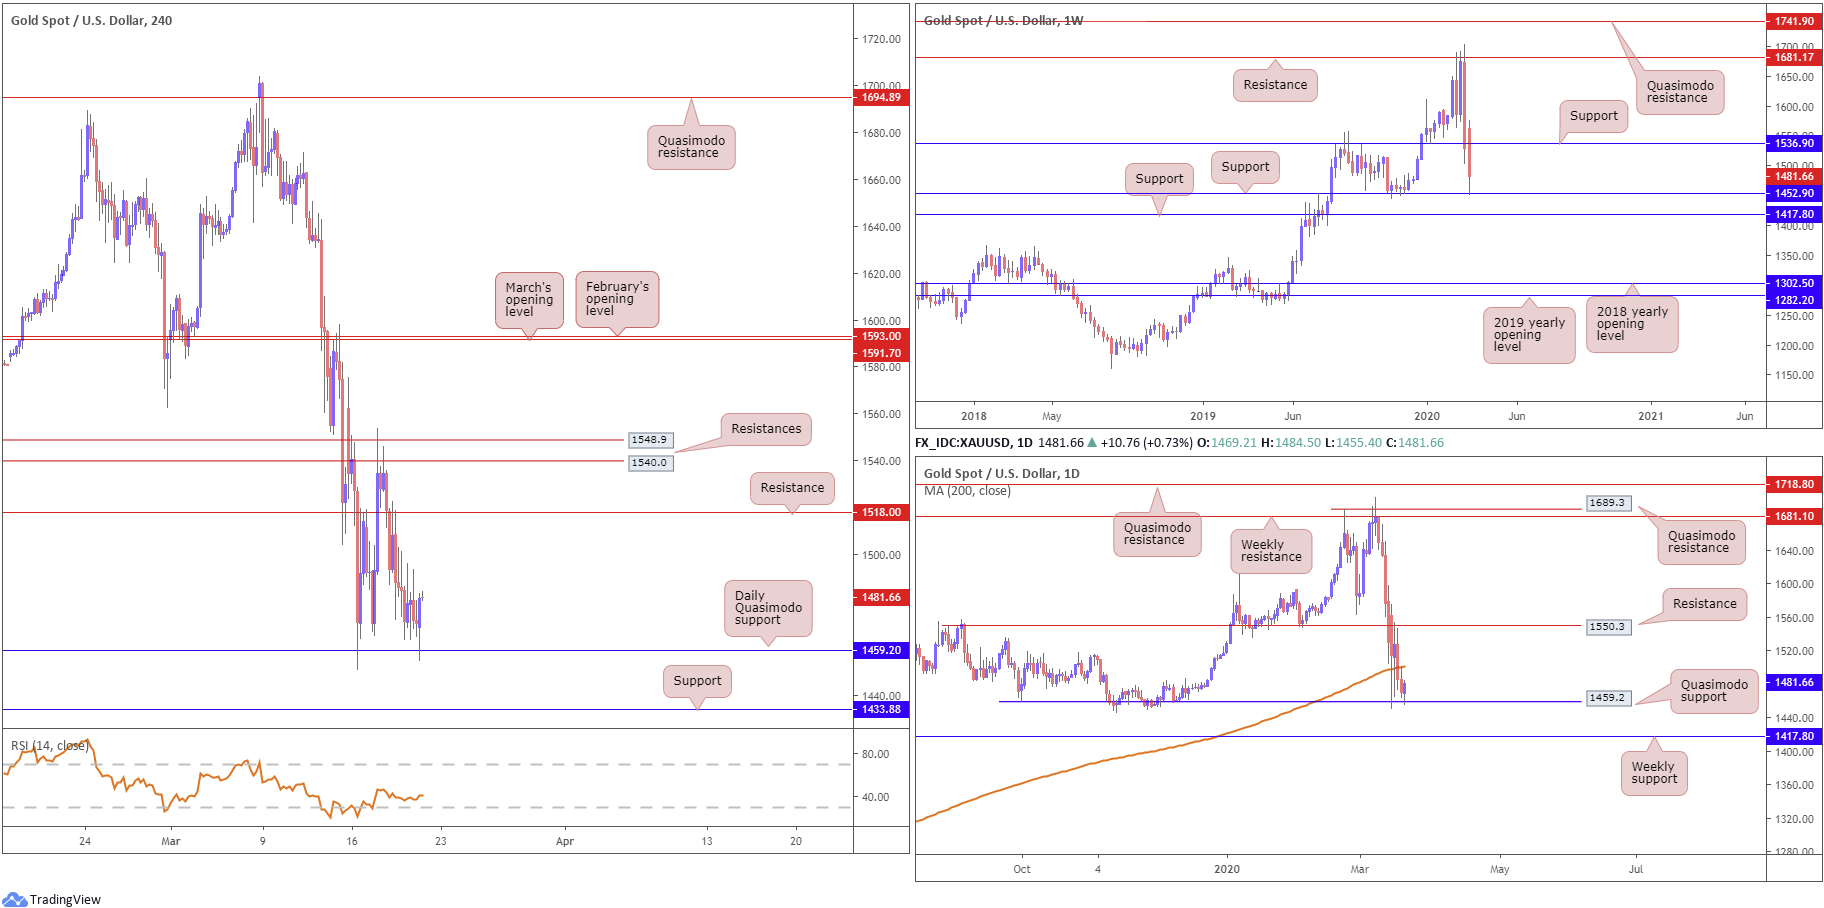
XAU/USD (GOLD):
XAU/USD spot prices remained on the defensive Thursday amid rampant demand for the greenback, recording a 1% loss.
Weekly price reveals softening beneath support at 1536.9, reconnecting with support priced in at 1452.9, positioned ahead of support at 1417.8.
Meanwhile, daily price, though leaving resistance at 1550.3 unchallenged, reclaimed the 200-day SMA (orange – 1500.7) to the downside in recent trade and shook hands with a familiar Quasimodo support at 1459.2, sited above the weekly support at 1417.8.
Resistances between 1548.9/1.1540.0 on the H4 timeframe held firm mid-week, sending intraday flow under support at 1518.0 (now a serving resistance level) and charted the way towards the daily Quasimodo support mentioned above at 1549.2.
Areas of consideration:
Those who read recent analysis may recall the following:
Should a H4 close form below support at 1518.0, knowing we’re trading below resistance at 1550.3 on the daily timeframe, this may generate additional downside, with a revisit to daily Quasimodo support at 1459.2 a possibility.
Well done to any readers who managed to jump aboard the recent move lower, either by way of the breakout candle or a retest at the underside of 1518.0. Connecting with daily Quasimodo support likely fuelled a wave of short covering, though many might hold a portion of the position open for a possible run to weekly supports at 1452.9 and 1417.8, with H4 support set in between at 1433.8.
The accuracy, completeness and timeliness of the information contained on this site cannot be guaranteed. IC Markets does not warranty, guarantee or make any representations, or assume any liability regarding financial results based on the use of the information in the site.
News, views, opinions, recommendations and other information obtained from sources outside of www.icmarkets.com.au, used in this site are believed to be reliable, but we cannot guarantee their accuracy or completeness. All such information is subject to change at any time without notice. IC Markets assumes no responsibility for the content of any linked site.
The fact that such links may exist does not indicate approval or endorsement of any material contained on any linked site. IC Markets is not liable for any harm caused by the transmission, through accessing the services or information on this site, of a computer virus, or other computer code or programming device that might be used to access, delete, damage, disable, disrupt or otherwise impede in any manner, the operation of the site or of any user’s software, hardware, data or property.


