
Key risk events today:
UK Current Account; UK Final GDP q/q; MPC Member Haskel Speaks; Canada Retail Sales m/m and Core Retail Sales m/m; US Final GDP q/q; US Core PCE Price Index m/m and Personal Spending m/m.
EUR/USD:
Less-than-stellar US macroeconomic data kept the US dollar index in check Thursday, wrapping up the session unchanged. The Federal Reserve Bank of Philadelphia’s monthly report revealed the diffusion index for current general activity fell 10 points this month to 0.3, its lowest reading in six months. In addition to this, according to the Department of Labour, the advance figure for seasonally adjusted initial claims was 234,000, a decrease of 18,000 from the previous week’s unrevised level of 252,000, though came in higher than consensus at 225k.
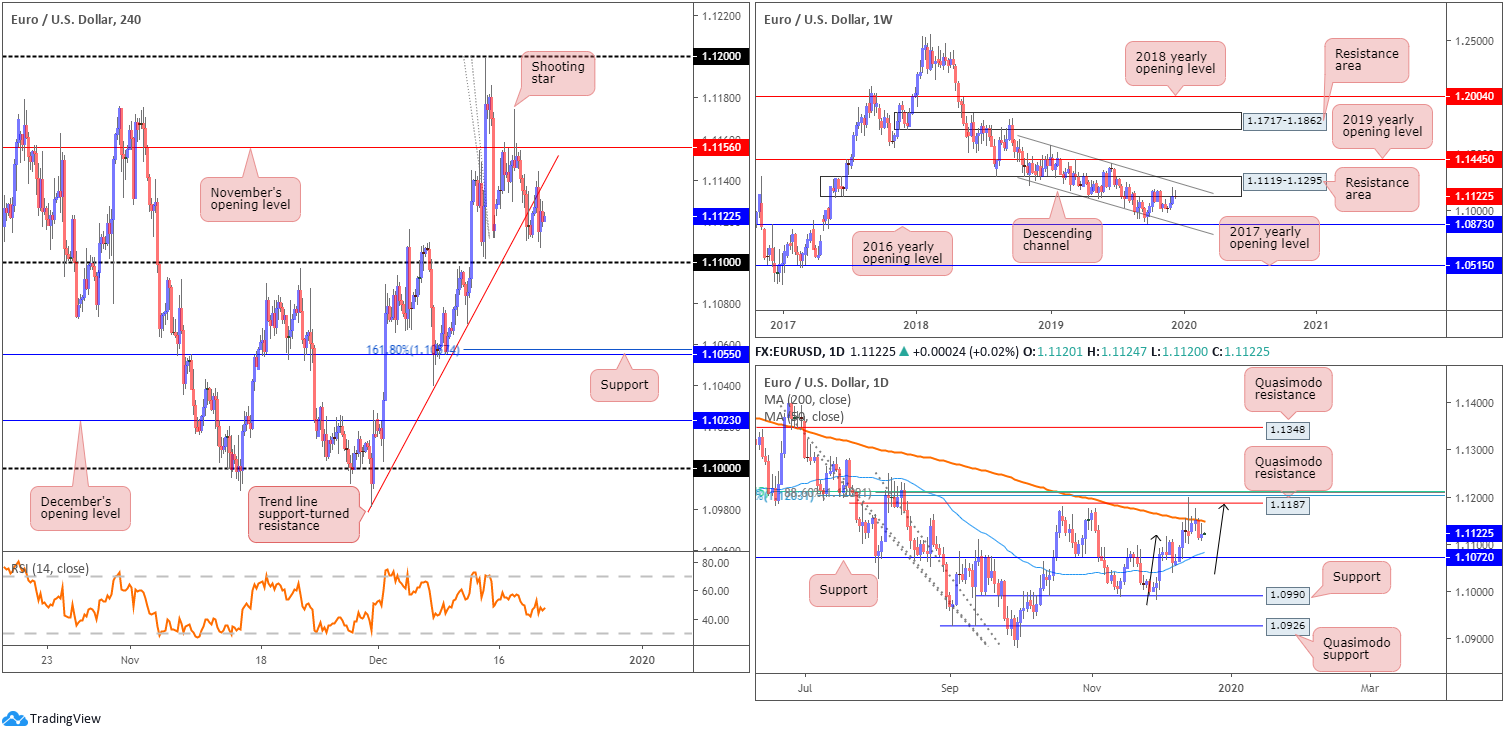
Although EUR/USD eked out marginal gains in recent trade, H4 movement maintains a downbeat tone after successfully retesting the underside of a recently penetrated trend line support, taken from the low 1.0981. The 1.11 handle lies nearby as possible support, with a break of this level potentially setting the stage for a run towards support at 1.1055, which aligns closely with a 161.8% Fibonacci extension point at 1.1061. To the upside, nevertheless, November’s opening level at 1.1156 remains the next port of call in terms of resistance.
Weekly flow remains contained south of a long-standing resistance area at 1.1119-1.1295, which intersects with a channel resistance, extended from the high 1.1569. Downside objectives fall in at the 2016 yearly opening level at 1.0873 and channel support, taken from the low 1.1109.
A closer reading of technical movement on the daily timeframe reveals the 200-day SMA (orange – 1.1148) holds price lower. Previously, however, price whipsawed through the said SMA and connected with Quasimodo resistance at 1.1187, positioned a few points south of a Fibonacci cluster around the 1.1206 neighbourhood. What’s also notable from a technical perspective is the bearish ABCD correction (black arrows) that terminated at the aforementioned Quasimodo resistance. Based on daily analytics, further downside is certainly a possibility. Support on this timeframe rests at 1.1072/50-day SMA (1.1081), with a break of this level potentially setting the stage for a push towards support at 1.0990.
Areas of consideration:
Well done to any readers who managed to short November’s opening level at 1.1156 on Tuesday, based on the H4 shooting star pattern. This was a noted setup and remains in motion, with 1.11 resting close by as the initial take-profit target. Reducing risk to breakeven at 1.11 is an option, with daily support at 1.1072 set as the next take-profit target.
Also worthy of attention today is the following setup taken from previous analysis:
Knowing daily support at 1.1072 lurks beneath 1.11, and given psychological levels are prone to fakeouts, the likelihood of a fakeout developing through 1.11 to 1.1072 remains high, according to the chart studies. In the event a fakeout through 1.11 takes form, longs on a H4 close back above the round number could be a possibility, targeting November’s opening level at 1.1156 as initial resistance. However, this will have you competing with weekly sellers, therefore strict trade management is an absolute must.
GBP/USD:
Sterling accelerated its decline against the buck Thursday, erasing more than 65 points, or 0.53%. Softness, according to research, largely stemmed from poor UK retail sales, however the pre-Christmas period has had participants questioning the reliability of the report as the black-Friday/cyber week dates will be included in the next report. In terms of the Bank of England’s communication yesterday, policymakers, once again, opted to stand pat on rates at 0.75%, with a 7-2 vote split (Saunders and Haskel as dissenters to the decision).
Those who read Thursday’s technical briefing may recall the following:
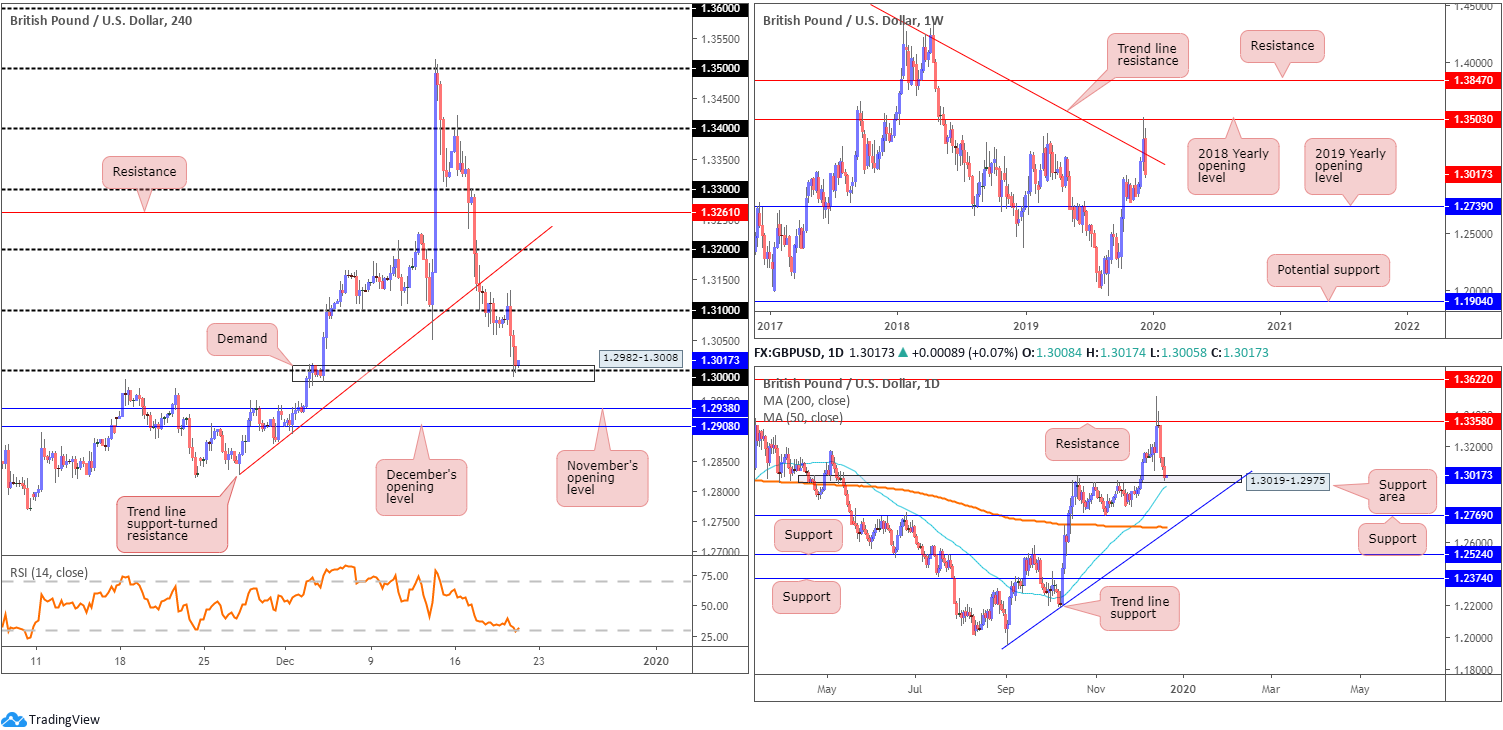
Considering 1.31 may provide a ceiling to the market today, a retest at this angle is likely of interest for many traders. A retest by way of a H4 bearish candlestick signal is considered the ideal scenario; not only will this help identify seller intent, it’ll provide entry/risk metrics to work with.
As evident from the H4 chart this morning, the retest at 1.31 occurred but failed to chalk up a tradeable candlestick formation, unfortunately.
On a wider perspective, technicians may want to note the daily support area at 1.3019-1.2975 recently entered the fight. Interestingly, the 50-day SMA (blue – 1.2948), which recently crossed above the 200-day SMA (orange – 1.2694), is also positioned a few points south of the daily zone.
Weekly price, on the other hand, crossed back through long-standing trend line resistance, pencilled in from the high 1.5930, after testing the 2018 yearly opening level at 1.3503. A defined close south of this barrier highlights a possible approach towards the 2019 yearly opening level at 1.2739.
Areas of consideration:
With H4 price currently testing demand at 1.2982-1.3008 and the key figure 1.30, along with the relative strength index (RSI) shaking hands with oversold levels, a recovery may take place into the week’s close. This is further reinforced by the daily support area underlined above at 1.3019-1.2975. While H4 and daily structure may be enough to lure buyers into the market, traders need to remain cognisant of weekly movement suggesting further selling could be in store.
Conservative buyers out of 1.30 will, at the very least, likely opt to wait for additional candlestick confirmation before pulling the trigger, targeting 1.31 as the initial upside take-profit zone. This helps identify buyer intent and also provides entry and risk metrics to work with.
AUD/USD:
AUD/USD bulls entered an offensive phase Thursday, striving for pole position on the G10 grid after hotter-than-expected jobs data and lacklustre dollar demand.
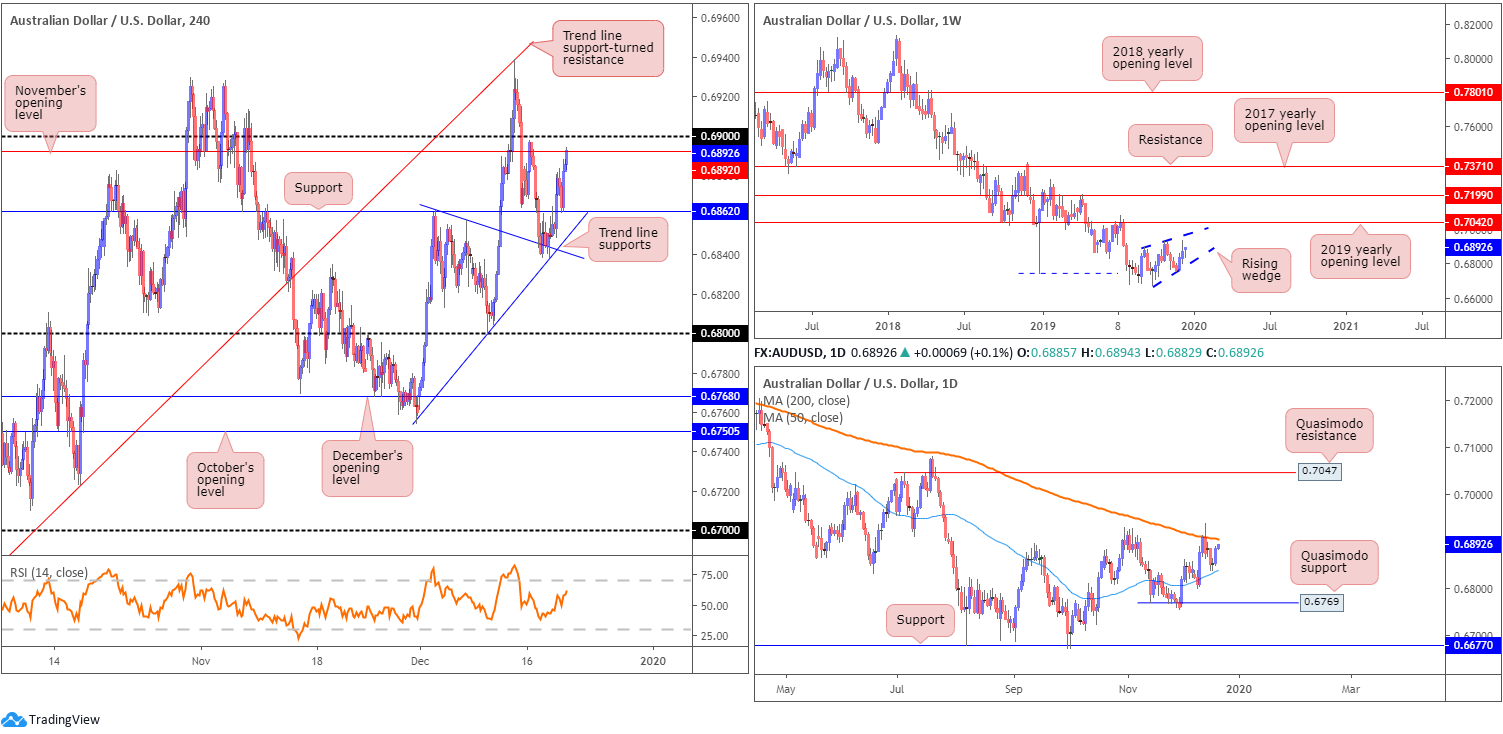
Technical research based on H4 movement reveals the candles retested support at 0.6862 and is, as of current price, crossing swords with November’s opening level at 0.6892, closely shadowed by the 0.69 handle.
What’s also interesting here, from a technical perspective, is the 200-day SMA (orange – 0.6904) coincides with 0.69. Given the pair has traded south of the said SMA since April 2019, a reaction from the 0.69ish vicinity may be on the menu today. Regarding support, the 50-day SMA (blue – 0.6837) is visible nearby, with a break perhaps clearing the path south to Quasimodo support at 0.6769.
In terms of weekly price, the candles have been busy carving out what appears to be a rising wedge formation, since registering a bottom in late September at 0.6670. This is typically considered a continuation pattern. As the 2019 yearly opening level at 0.7042 is seen close by, the aforementioned rising wedge could potentially continue advancing until connecting with this angle. The primary downtrend, visible from this timeframe, has also been in play since early 2018, consequently adding weight to a breakout south possibly emerging.
Areas of consideration:
0.69 is obvious resistance today. The fact it merges closely with the 200-day SMA certainly adds weight to a reaction being observed. However, psychological levels are prone to whipsaws. This tends to be interpreted as a ‘stop run’. With that being the case, waiting for a H4 bearish candlestick signal to form before engaging may be an idea, preferably one that closes south of November’s opening level at 0.6892. As for downside targets, 0.6862 remains a logical starting block.
USD/JPY:
The US dollar rotated south against the Japanese yen Thursday, losing more than 0.16% and chalking up a bearish outside day candlestick formation. US equities were more resilient to disappointing second-tier data, with investors continuing to cheer the prospects of a US/China trade deal.
The Federal Reserve Bank of Philadelphia’s monthly report revealed the diffusion index for current general activity fell 10 points this month to 0.3, its lowest reading in six months. In addition to this, according to the Department of Labour, the advance figure for seasonally adjusted initial claims was 234,000, a decrease of 18,000 from the previous week’s unrevised level of 252,000, though came in higher than consensus at 225k.
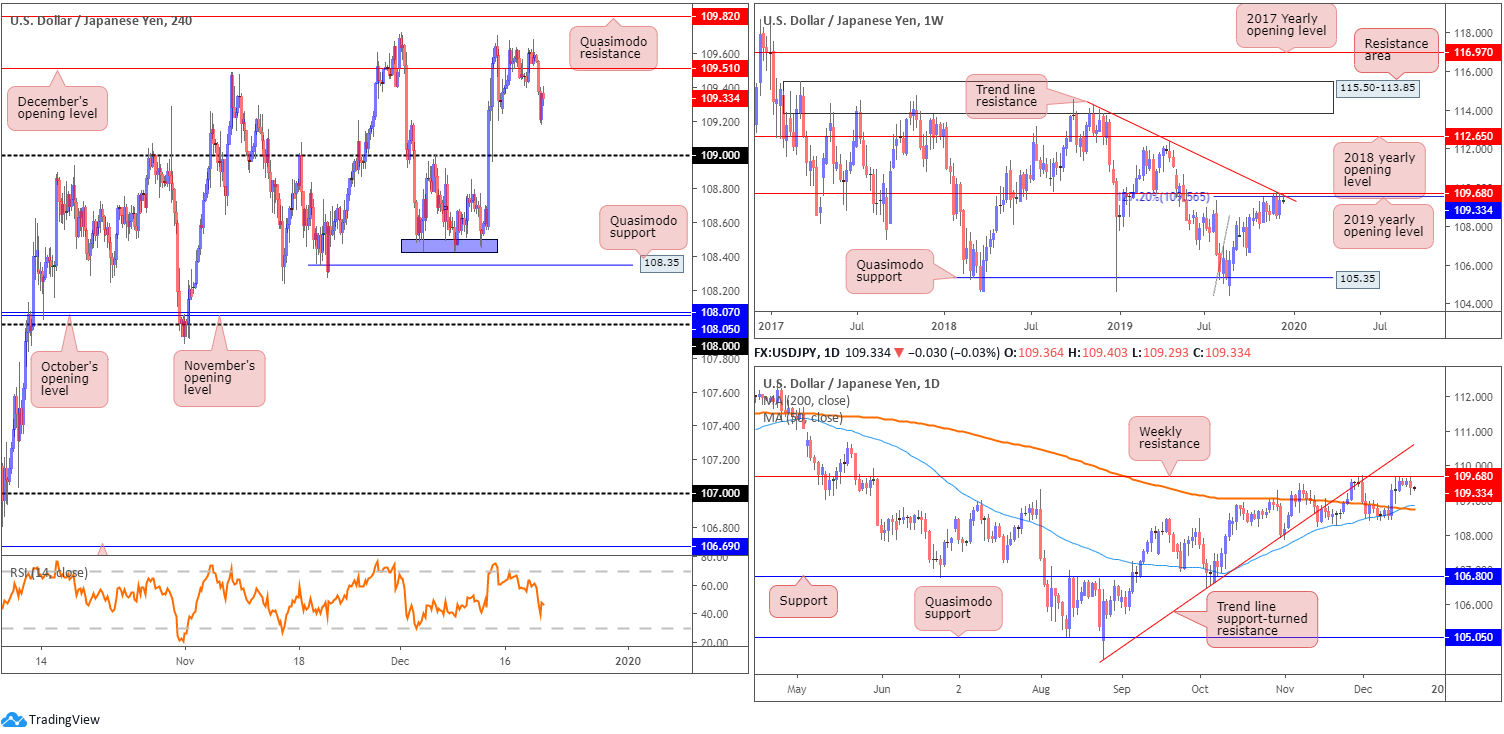
Technically, however, a move lower is not surprising. A collection of weekly resistances are in motion: a 127.2% Fibonacci ext. point at 109.56 (taken from the low 104.44), resistance formed at 109.68, the 2019 yearly opening level and trend line resistance, extended from the high 114.23. Aside from the 106.48 September 30 swing low, limited support is evident on the weekly timeframe until shaking hands with Quasimodo support at 105.35. A break north, however, highlights the 2018 yearly opening level at 112.65 as the next possible layer of resistance.
Daily action is also seen shaking hands with the said weekly resistances. The difference on this scale, nonetheless, is the downside targets. The 200/50-day SMAs (orange – 108.73/blue – 108.86) rest as potential support. Also note, the 50-day SMA is crossing above the 200-day SMA, generally viewed as a bullish indicator (a Golden Cross).
Across the page on the H4 timeframe, price, on the back of testing weekly resistances, overpowered December’s opening level at 109.51, exposing the 109 handle. Quasimodo resistance at 109.82 remains unchallenged.
Areas of consideration:
An obvious deduction from current structure would be to look for a retest at December’s opening level drawn from 109.51. A retest formed by way of a H4 bearish candlestick formation would likely entice further selling to 109 (traders have the option of using the candlestick pattern to determine entry and risk levels). Beyond 109, traders’ crosshairs are likely fixed on Quasimodo support at 108.35. Note not only is this considered a take-profit target, it is also a location buyers will likely look to enter long from, given the sell stops that will be taken from the lows (purple) around 108.45.
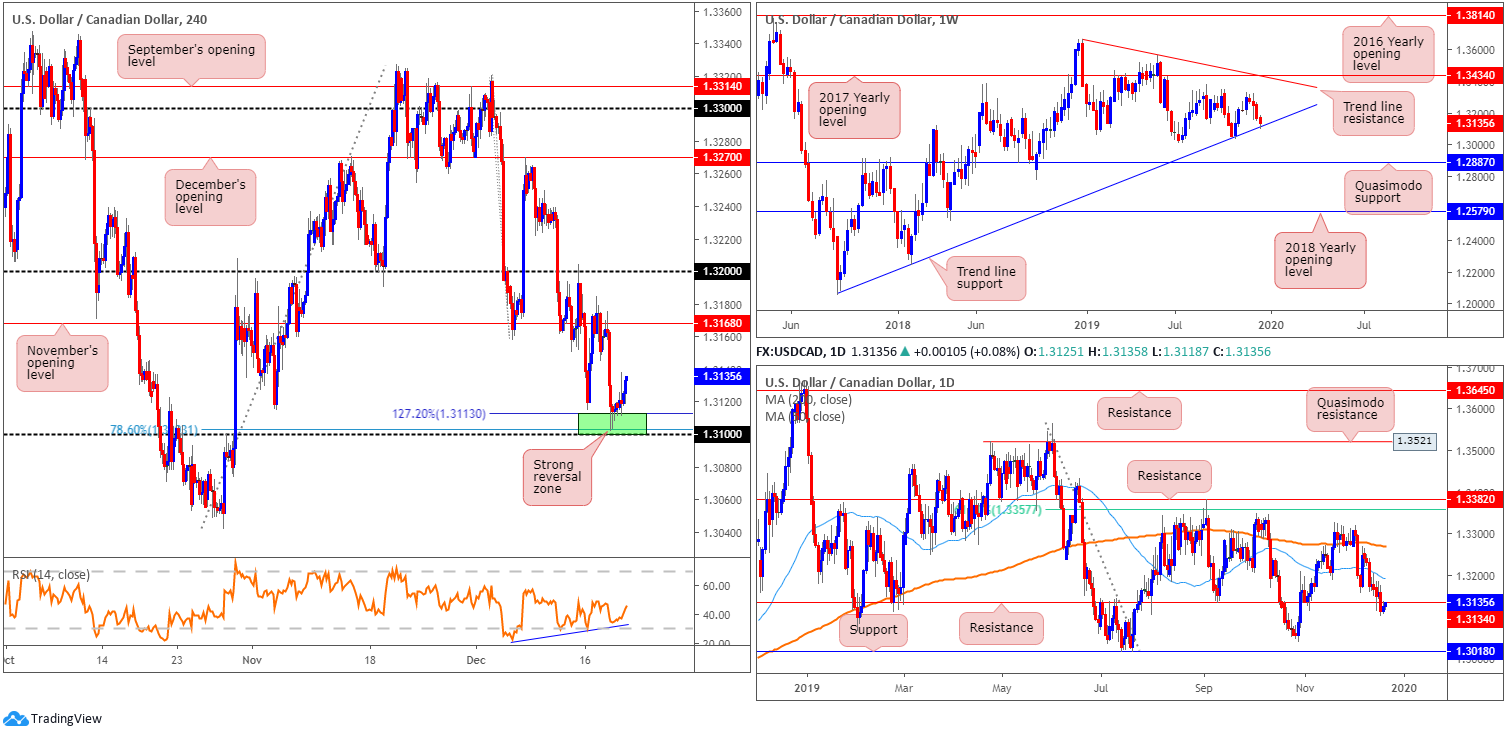
USD/CAD:
Technically, USD/CAD trades at an interesting juncture.
H4 price, as of current levels, is hovering north of 1.31/1.3113 (green – comprised of the round number 1.31, a 78.6% Fibonacci ratio at 1.3103 and a 127.2% Fibonacci extension point at 1.3113). In addition to this, the relative strength index (RSI) is producing bullish divergence (blue line).
Those who read Thursday’s report may recall the piece highlighting 1.31/1.3113 as a reasonably firm area of interest for possible long entries. The additional component here, also highlighted in yesterday’s analysis, is weekly price testing long-term trend line support, taken from the low 1.2061. A violation of this line likely gives way to Quasimodo support at 1.2887.
The downside to any long entries, however, is 1.3134, based on the daily timeframe, now serving as resistance.
Areas of consideration:
Well done to any readers who managed a long from 1.31/1.3113. Bidding remains steady, though price is currently testing daily resistance mentioned above at 1.3134.
Dependent on the long entry, and taking into account risk/reward, now may be a good time to begin thinking about partial profit taking, or at least reducing risk to breakeven.
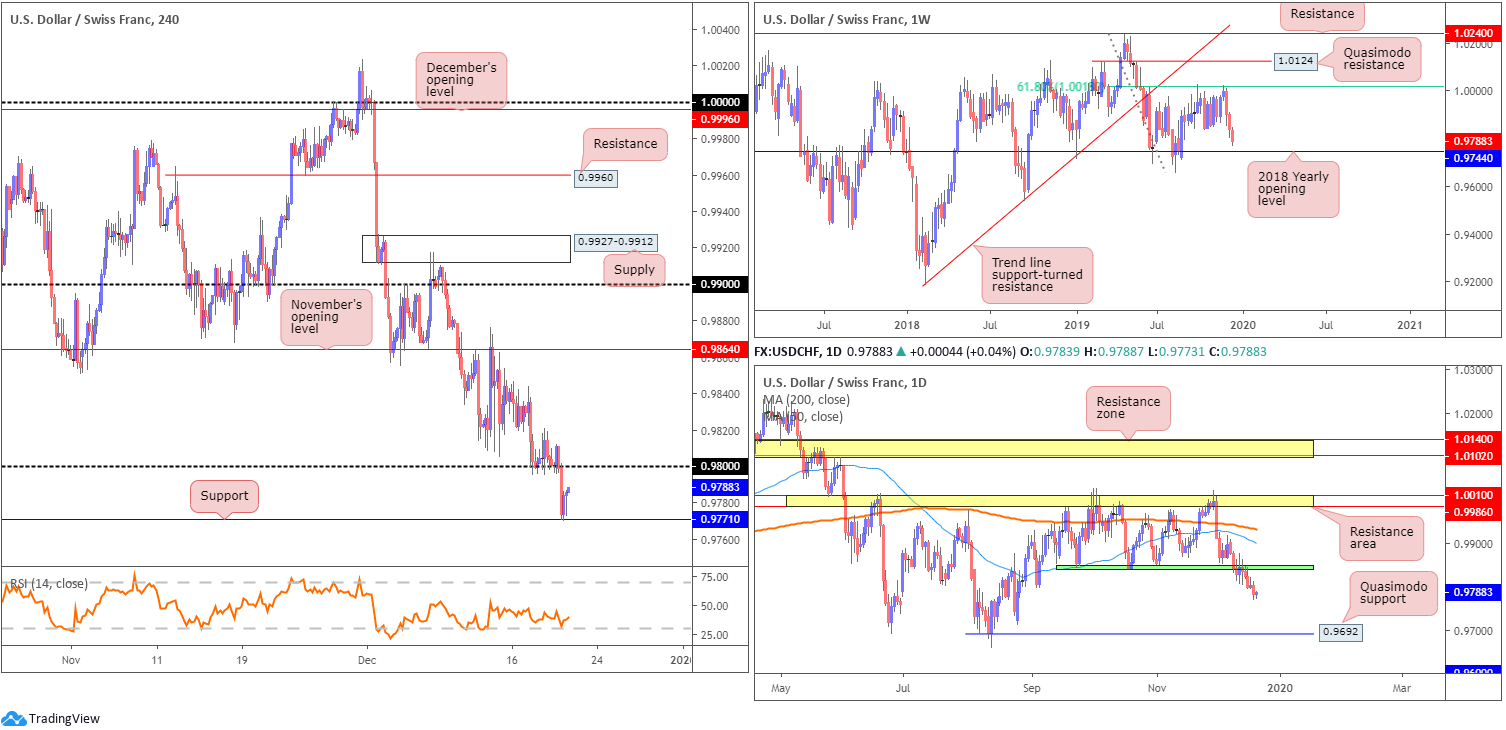
USD/CHF:
USD/CHF is set to record its third weekly successive loss, down 0.50% on the week thus far. In the shape of three near-full-bodied bearish candles, weekly price is seen approaching the 2018 yearly opening level at 0.9744.
In conjunction with weekly flow, the lower edge of a 3-month consolidation at 0.9845ish gave way last week. 0.9744 is the primary downside target on the weekly timeframe, while on the daily timeframe, Quasimodo support coming in at 0.9692 appears a valid target.
As evident from the H4 timeframe this morning, as expected, the 0.98 handle gave way and tested support coming in at 0.9771. Beyond this level, technicians likely have support at 0.9721 in sight as the next downside target, closely followed by the 0.97 handle.
Areas of consideration:
As weekly and daily timeframes display room to explore lower ground, traders are likely looking for either a retest at 0.98 to form, or a H4 close beneath the current H4 support at 0.9771. The latter is the higher probability setup, due to the area being cleared at least to the 2018 yearly opening level mentioned above on the weekly timeframe at 0.9744.
Traders are urged to ensure risk/reward metrics are favourable, targeting at least a 1:2 ratio to the first take-profit target.
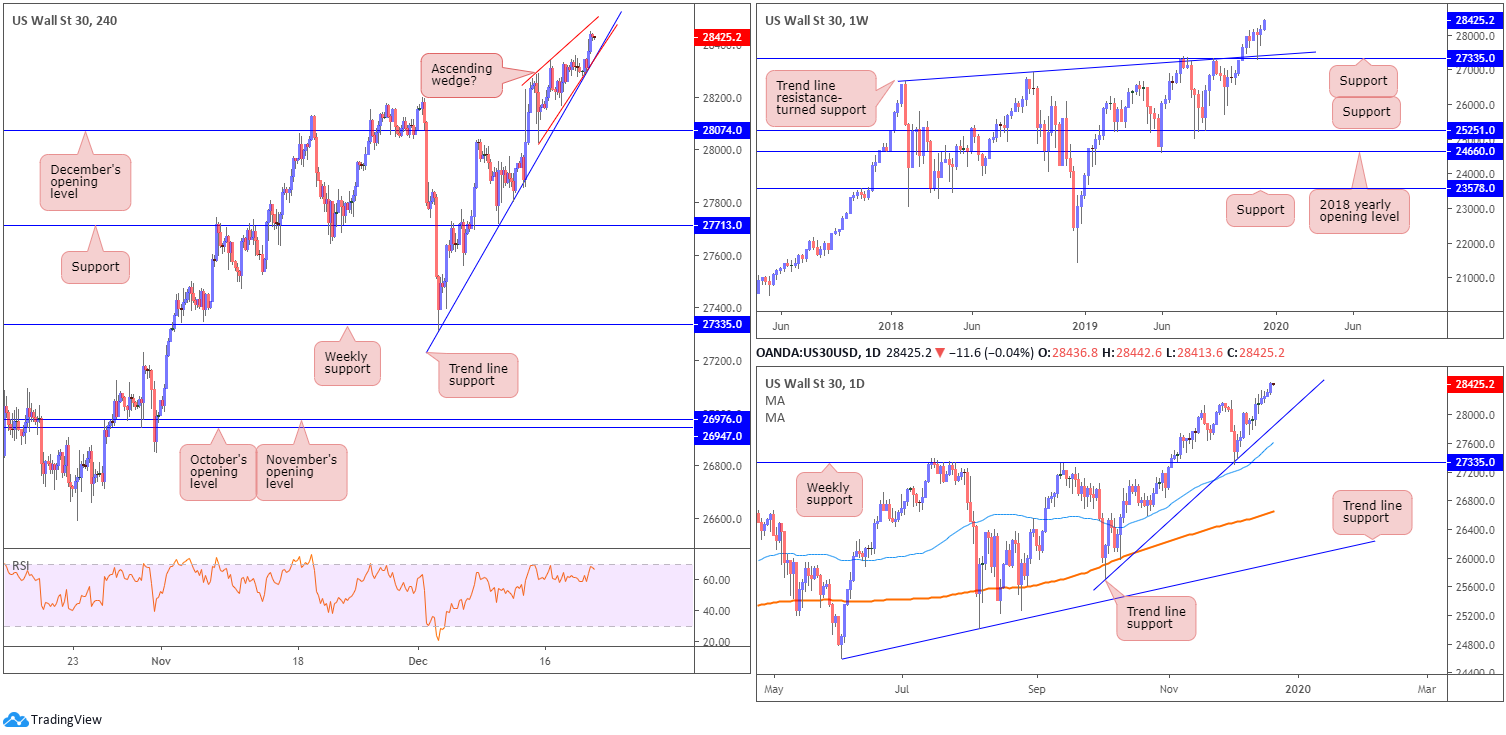
Dow Jones Industrial Average:
Wall Street’s major indexes resumed their rally Thursday as US Treasury Secretary Steven Mnuchin stated an initial US/China trade deal would be signed in early January. The Dow Jones Industrial Average added 137.68 points, or 0.49%; the S&P 500 advanced 14.23 points, or 0.45% and the tech-heavy Nasdaq 100 added 60.67 points, or 0.71%.
H4 trend line support, extended from the low 27314, held ground in strong form, lifting the DJIA to fresh record peaks of 28448. Technically, the said trend line support is steep and likely prone to breaking. In addition to this, an ascending wedge (red lines – 28026/28287) is in motion, and the relative strength index (RSI) remains tucked just beneath the 70.00 overbought value, consequently adding to a potential reversal.
Weekly price continues to trade north of support drawn from 27335, along with trend line support, etched from the high 26670. Meanwhile, on the daily timeframe, trend line support, extended from the low 25710, remains intact, bolstered by additional support from the 50-day SMA (blue – 27611).
Areas of consideration:
As the index forms eight consecutive daily bullish closes, the H4 ascending wedge (which shows momentum decreasing), coupled with the steep H4 trend line support (prone to breaking), is likely to see a near-term reversal come about.
The problem is not many traders feel comfortable selling this market on a break of the said H4 structures, given its current strength. Nevertheless, in the event a break lower materialises, December’s opening level resides reasonably close by as support at 28074.
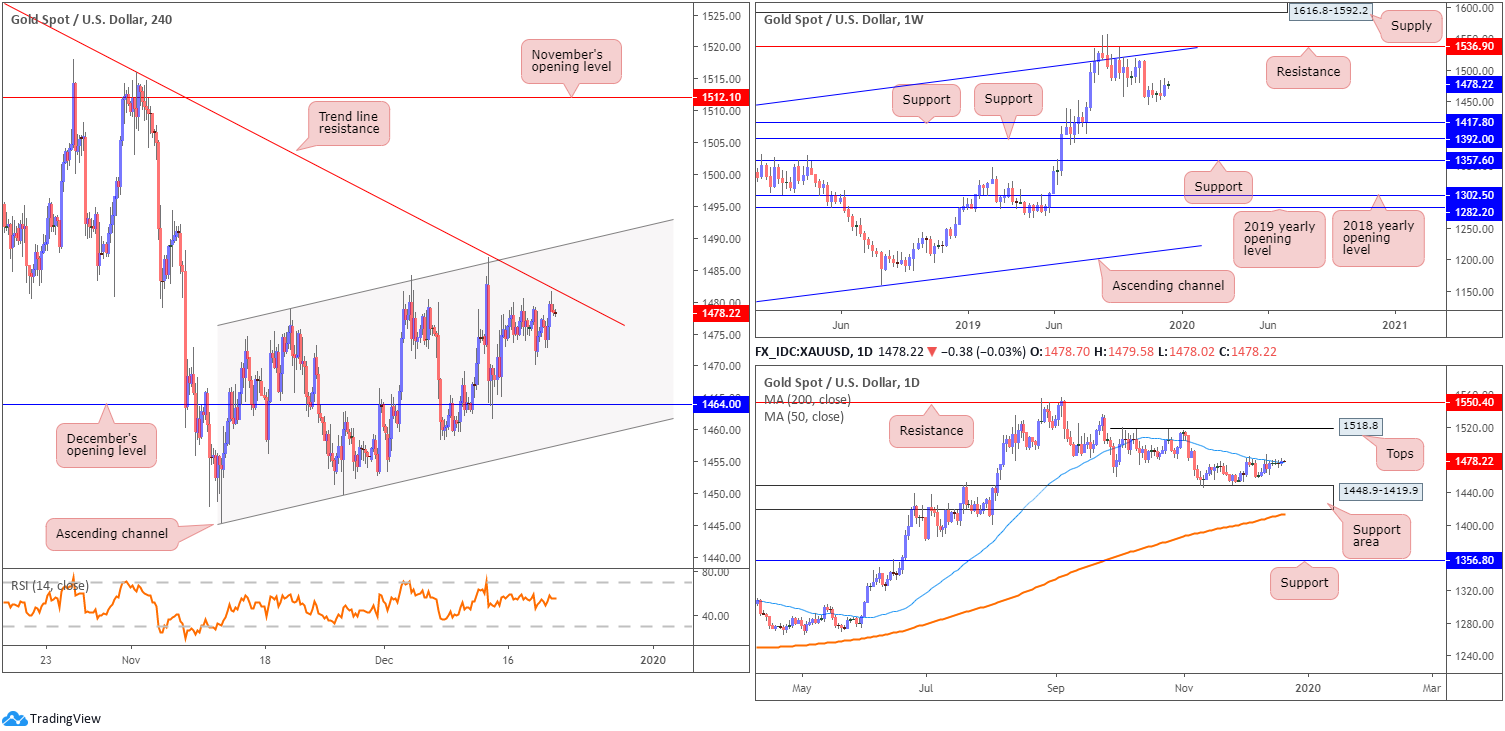
XAU/USD (GOLD):
XAU/USD spot prices have pretty much remained stale this week, ranging no more than $11. Technically, the lacklustre movement has resulted in a number of back-to-back daily indecision candles forming.
From the H4 timeframe, price continues to inch closer to a familiar trend line resistance, taken from the high 1557.1, missing the barrier by only a few points in recent movement. This follows last week’s near-to-the-point recovery off December’s opening level at 1464.0. Note, the H4 candles have also been compressing within an ascending channel formation since bottoming at 1445.5 (high at 1478.8).
On more of a broader perspective, since connecting with resistance at 1536.9 and channel resistance, extended from the high 1375.1, weekly price has been in a mild decline. Further downside from here potentially sets the stage for a move towards two layers of support at 1392.0 and 1417.8. Overall, however, the primary trend has faced a northerly trajectory since bottoming in early December 2015.
The 50-day SMA (blue – 1477.1) offered resistance in this market since early December, hampering upside from the daily support area coming in at 1448.9-1419.9. Yesterday, however, a marginal close north of the said SMA was seen, perhaps enough to generate further upside to tops around 1518.8, closely followed by resistance at 1550.4.
Areas of consideration:
Although daily price mildly closely above the 50-day SMA in recent trade, additional short entries at the current H4 trend line resistance remains an option. However, with limited confluence in view, traders are urged to consider confirmed entries, candlestick confirmation, for example. This not only helps identify seller intent, it also provides entry and risk levels to work with making it easier to calculate risk/reward.
(Italics represents previous analysis)
The accuracy, completeness and timeliness of the information contained on this site cannot be guaranteed. IC Markets does not warranty, guarantee or make any representations, or assume any liability regarding financial results based on the use of the information in the site.
News, views, opinions, recommendations and other information obtained from sources outside of www.icmarkets.com.au, used in this site are believed to be reliable, but we cannot guarantee their accuracy or completeness. All such information is subject to change at any time without notice. IC Markets assumes no responsibility for the content of any linked site.
The fact that such links may exist does not indicate approval or endorsement of any material contained on any linked site. IC Markets is not liable for any harm caused by the transmission, through accessing the services or information on this site, of a computer virus, or other computer code or programming device that might be used to access, delete, damage, disable, disrupt or otherwise impede in any manner, the operation of the site or of any user’s software, hardware, data or property.


