
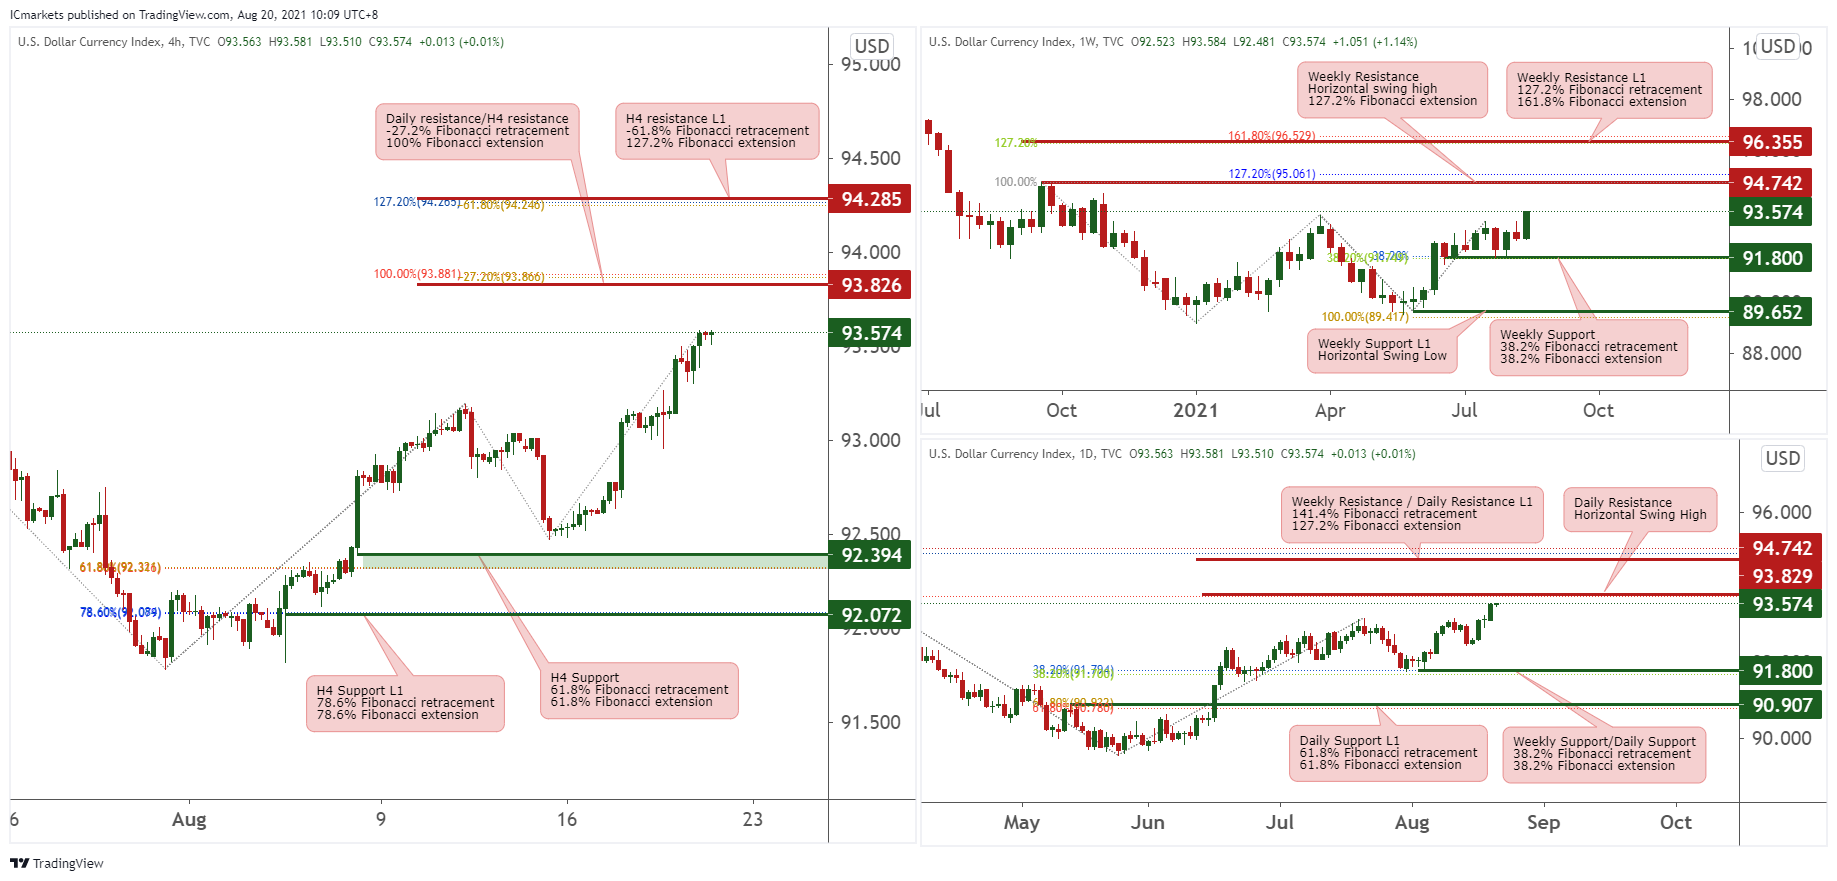
DXY:
Looking at the Weekly chart price may bearish towards the weekly support at 91.8 in line with 38.2% Fibonacci retracement and 38.2% Fibonacci extension. On the other hand, price may be bullish towards the weekly resistance at 94.742 in line with 127.2% Fibonacci extension and Horizontal swing high.
On the Daily timeframe, price is retesting the Daily resistance at 93.826 in line with Horizontal swing high and may bearish towards the Daily support at 91.8 in line with 38.2% Fibonacci retracement and 38.2% Fibonacci extension. On the other hand, price may be bullish towards the Daily resistance L1 at 94.742 in 127.2% Fibonacci retracement and 127.2% Fibonacci extension.
On the H4 timeframe, price may bearish towards the H4 support at 92.394 in line with 61.8% Fibonacci retracement and 61.8% Fibonacci extension. On the other hand, price may bullish towards the H4 resistance L1 at 94.285 in line with -61.8% Fibonacci retracement and 127.2% Fibonacci extension..
Areas of consideration:
- H4 resistance L1 of 94.285
- H4 support of 92.394
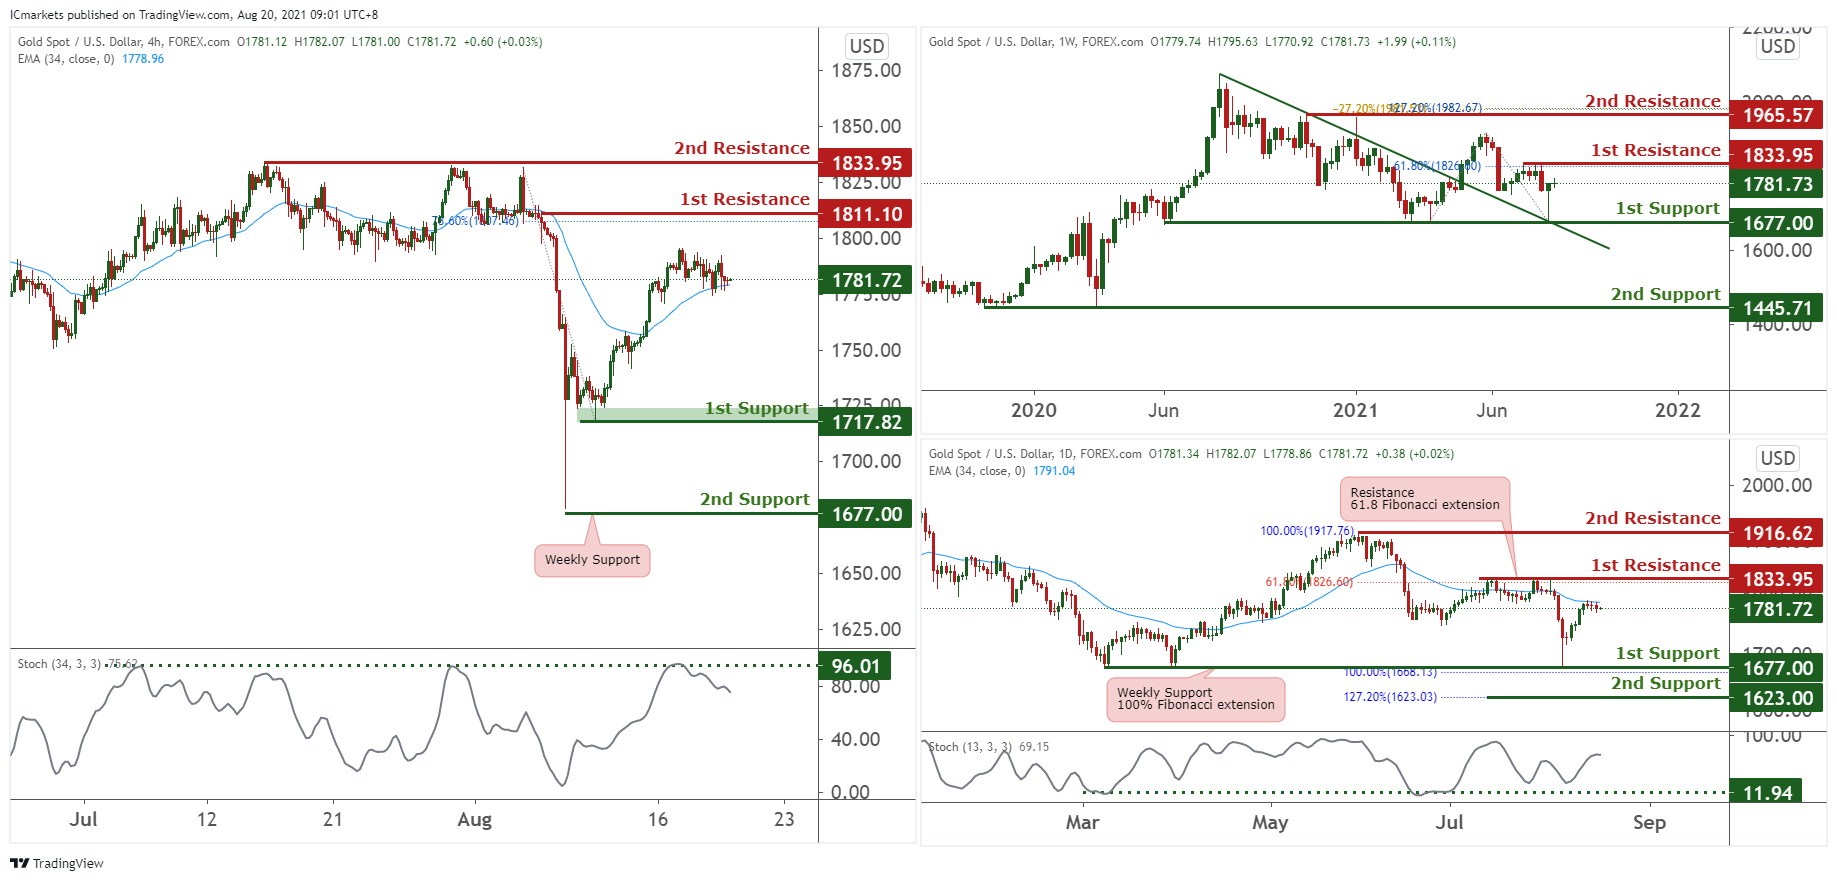
XAU/USD (GOLD):
On the weekly timeframe, price dropped lower and tested descending trendline support at 1677. Price is now holding between 1833 resistance and 1677 support. These two levels would be of key interest to long term traders. A break of either of these levels should see the price push higher towards next resistance at 1965 or next support at 1445.
On the Daily, price reacted above the weekly support at 1677 and below EMA 34. With stochastics reacting above support, we see a low probability bullish scenario where price may rise towards 1833 resistance. Otherwise, breaking below 1677 , riding downwards to 1623 in line with 127.2% Fibonacci extension.
On the H4, price drifted sideways but still holding above intraday support at 1717. With stochastics holding below resistance and price may retest the stochastic resistance as price is still reacting above EMA 34, we still might see a short term intraday push higher towards 1811. Otherwise, failure to hold above 1717 support zone, we will see price drop towards Weekly support at 1677 instead.
Areas of consideration:
- H4 resistance of 1811
- H4 support of 1717
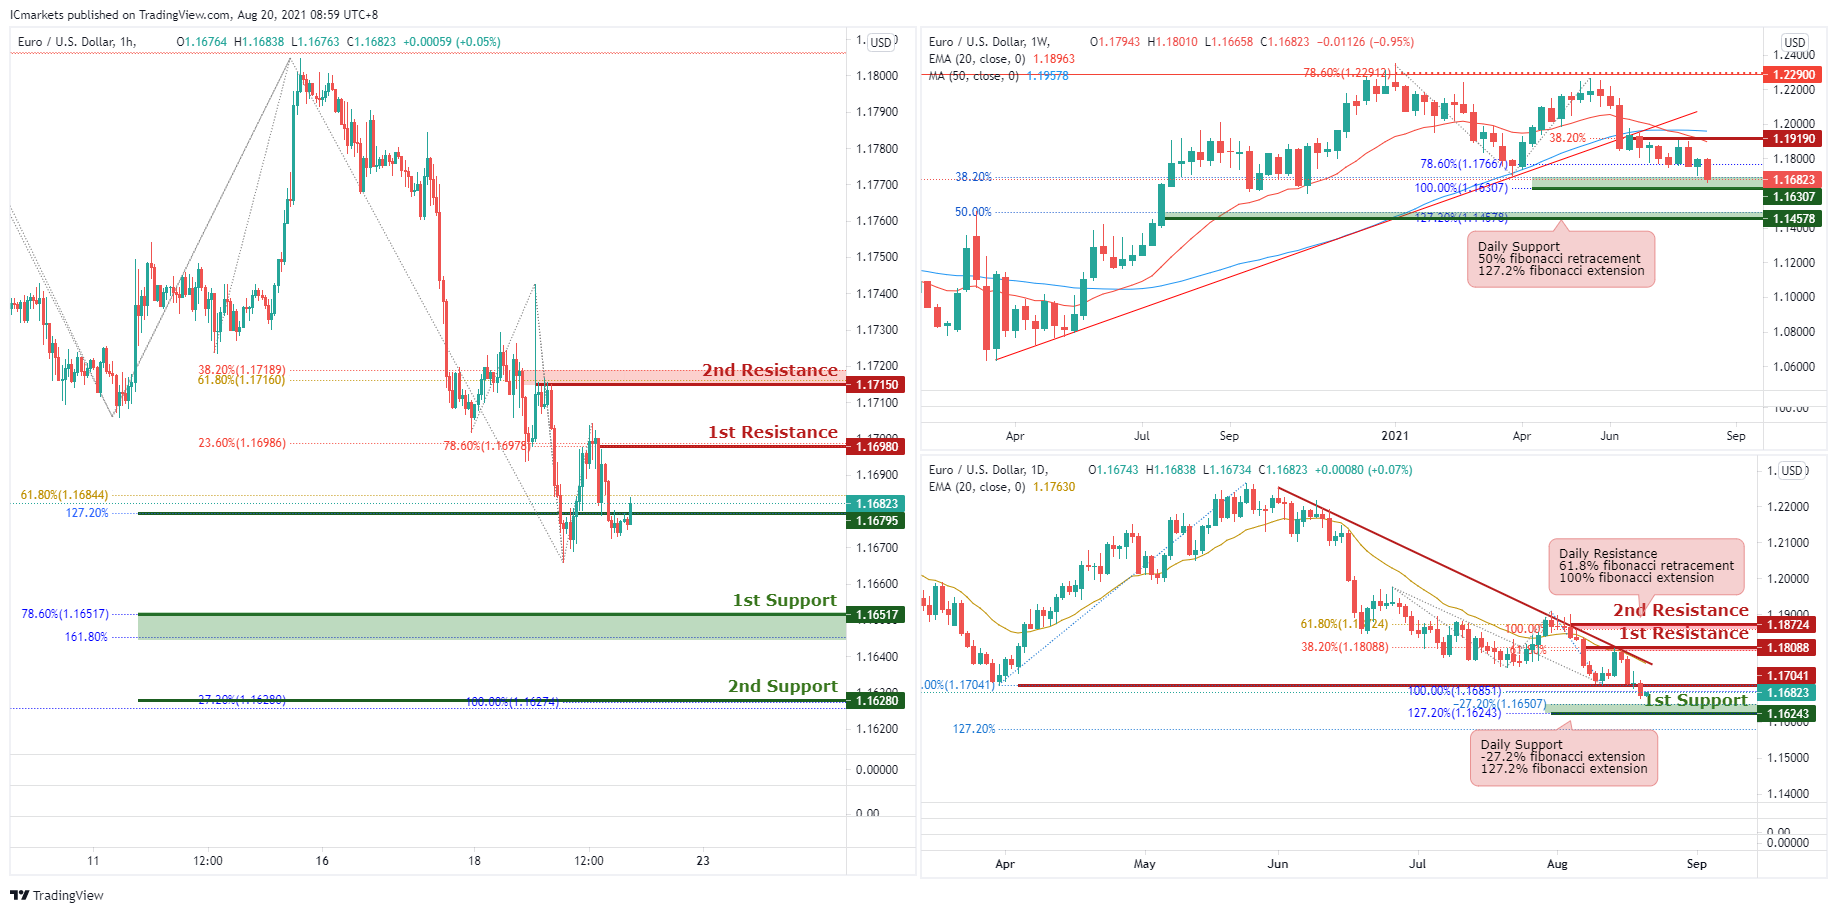
EUR/USD:
Looking at the weekly chart we can see that price is breaking below support at 1.17130, it could potentially swing towards support at 1.16307, in-line with 38.2% Fibonacci retracement and 100% Fibonacci extension. On the Daily chart, price broke previous support at 1.17041, in-line with 100% Fibonacci retracement and 100% Fibonacci extension. We could potentially continue further bearish pressure to the next support level at 1.16243, in-line with -27.2% Fibonacci retracement and 127.2% Fibonacci extension.
On the H4 timeframe, prices dropped to support at 1.16795, in-line with 127.2% Fibonacci retracement and 61.8% Fibonacci extension. Price could potentially continue its bearish pressure to next potential support at 1.16517, in-line with 161.8% Fibonacci retracement and 78.6% Fibonacci extension. The next support could potentially be at 1.16280, in-line with -27.2% Fibonacci retracement and 100% Fibonacci extension.
If the price bounces, it could potentially swing towards resistance at 1.16980, in-line with 23.6% Fibonacci retracement and 78.6% Fibonacci extension. If the price bounces higher, it could potentially swing towards next resistance at 1.17150, in-line with 38.2% Fibonacci retracement and 61.8% Fibonacci extension.
Areas of consideration:
- H4 time frame, support level at 1.16517 and 1.16280
- H4 time frame, resistance level at 1.16980 and 1.17150
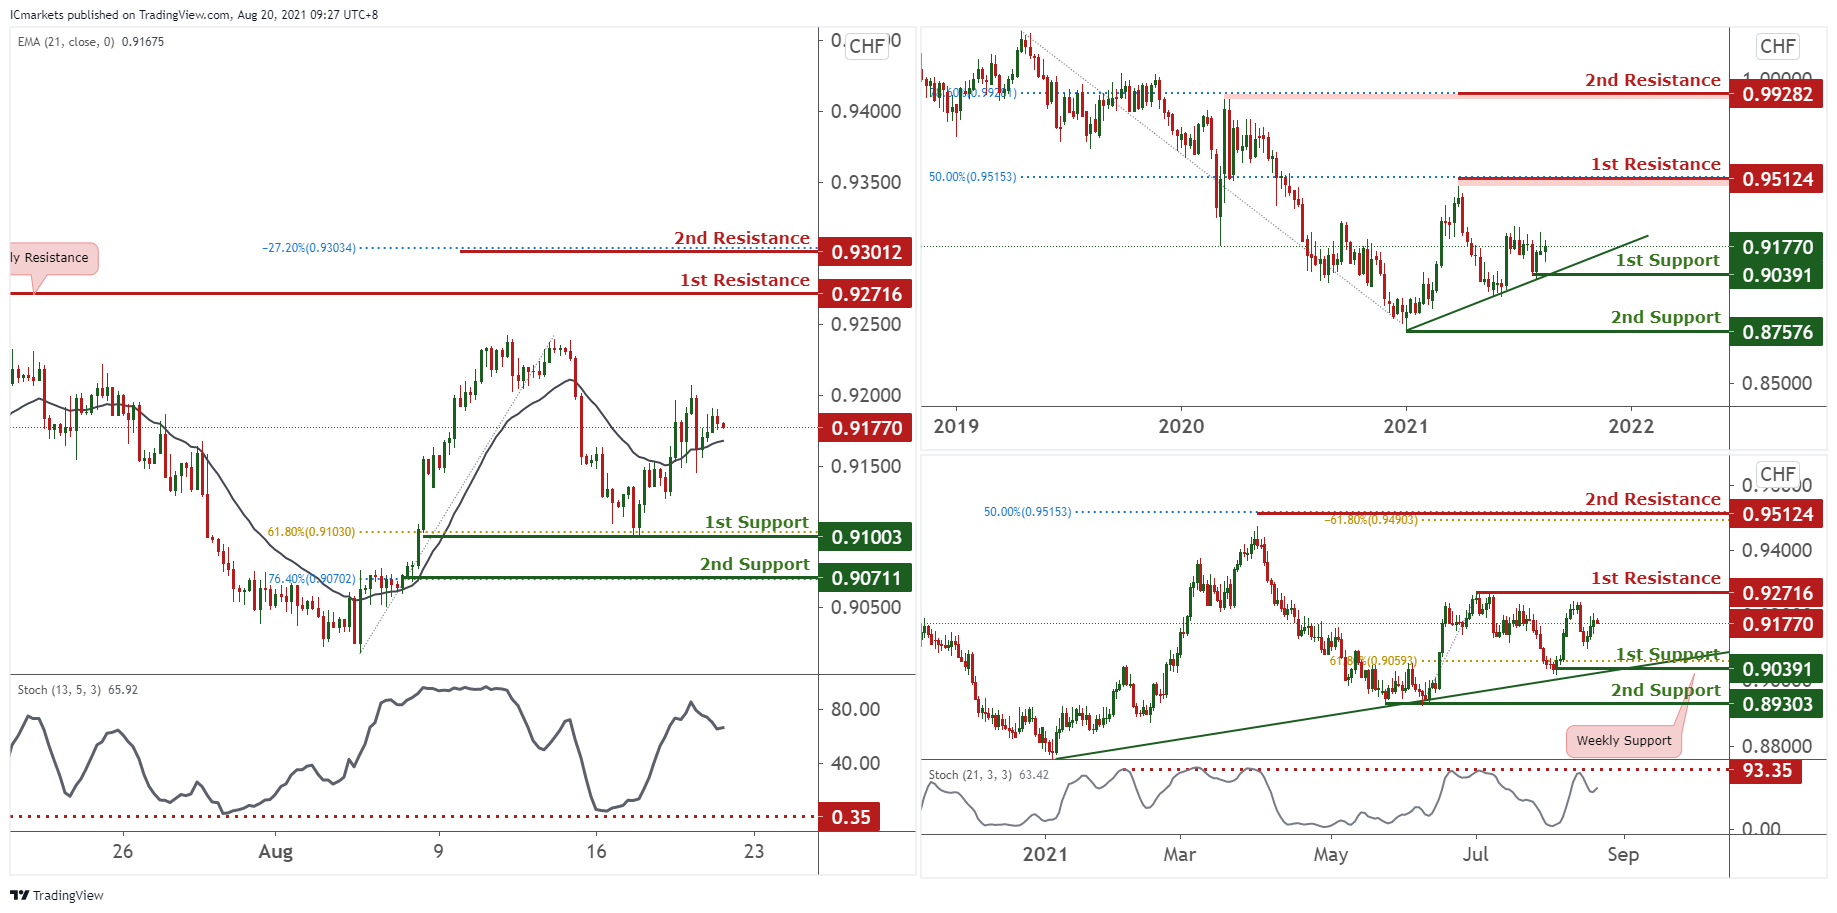
USD/CHF:
On the weekly, price is holding above ascending trendline support and also between 1st resistance at 0.95124 and 1st support at 0.90391. Traders should watch these levels closely for a break to see prices swing higher or drop lower. On the Daily, the price did not reach a graphical swing high. It is seen to have a bearish movement towards the 1st support at 0.90391. With stochastics testing resistance where price dropped in the past, we see a possibility that sellers could enter and push price towards the 1st support at 0.90391
On the H4, price has broken through the EMA 21 period and is holding above it,price has just bounced off the first support in line with the 61.8% Fibonacci Retracement. Price is expected to be pushed towards the 1st resistance. Our bullish bias is further supported with the stochastic indicator, the %K line has bounced off the strong support on the chart signifying a possible bullish momentum.
Areas of consideration:
- Watch Daily resistance at 0.92716
GBP/USD:
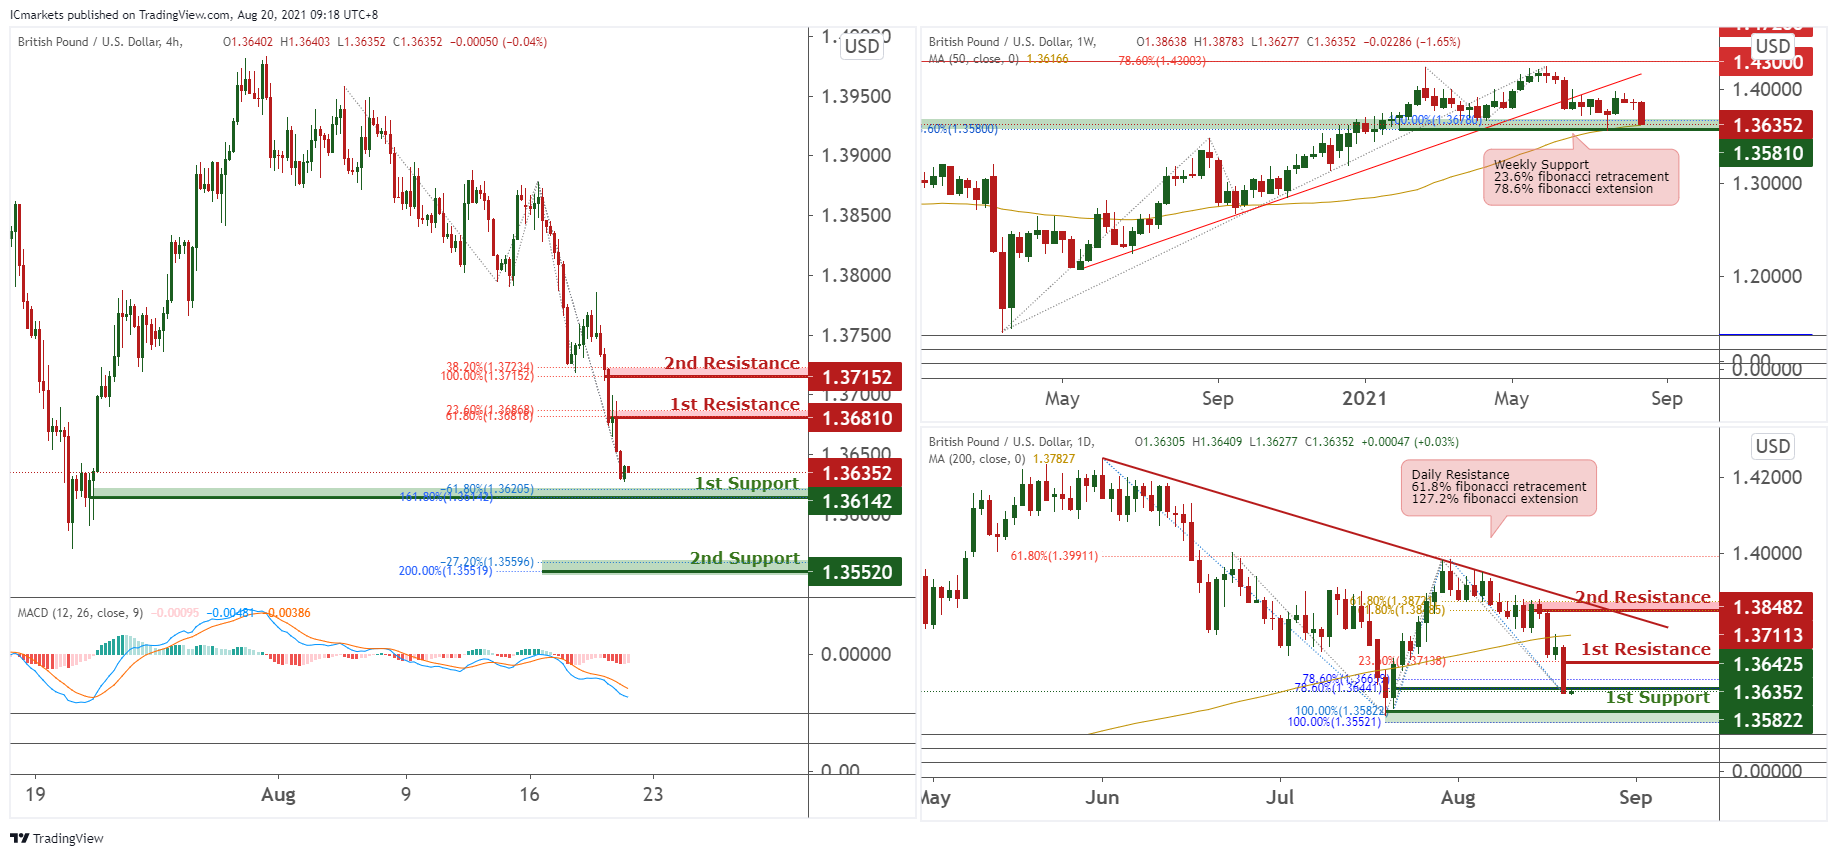
Looking at the weekly chart, prices are consolidating after breaking down from ascending trendline support-turned-resistance and retested support at 1.35810, in-line with 23.6% Fibonacci retracement, 78.6% Fibonacci extension and 50MA. On the Daily time frame price broke below support at 1.36425, it could potentially face further bearish pressure to support at 1.35822, in-line with 100% Fibonacci retracement and 100% Fibonacci extension.
On the H4 timeframe, price pierced through yesterday’s support towards first support at 1.36142, in-line with -61.8% Fibonacci retracement and 161.8% Fibonacci extension. Price could potentially continue its bearish momentum to next support at 1.35520, in-line with -27.2% Fibonacci retracement and 200% Fibonacci extension. MACD is also indicating bearish momentum for further downside.
If price bounces from this level, it could potentially swing towards resistance at 1.36810, in-line with 23.6% Fibonacci retracement and 61.8% Fibonacci extension. The next resistance could potentially be at 1.37152, in-line with 38.2% Fibonacci retracement and 100% Fibonacci extension
Areas of consideration:
- H4 time frame, 36142 and 1.35520 support level
- H4 time frame, 1.36810 and 1.37152 resistance level
USD/JPY
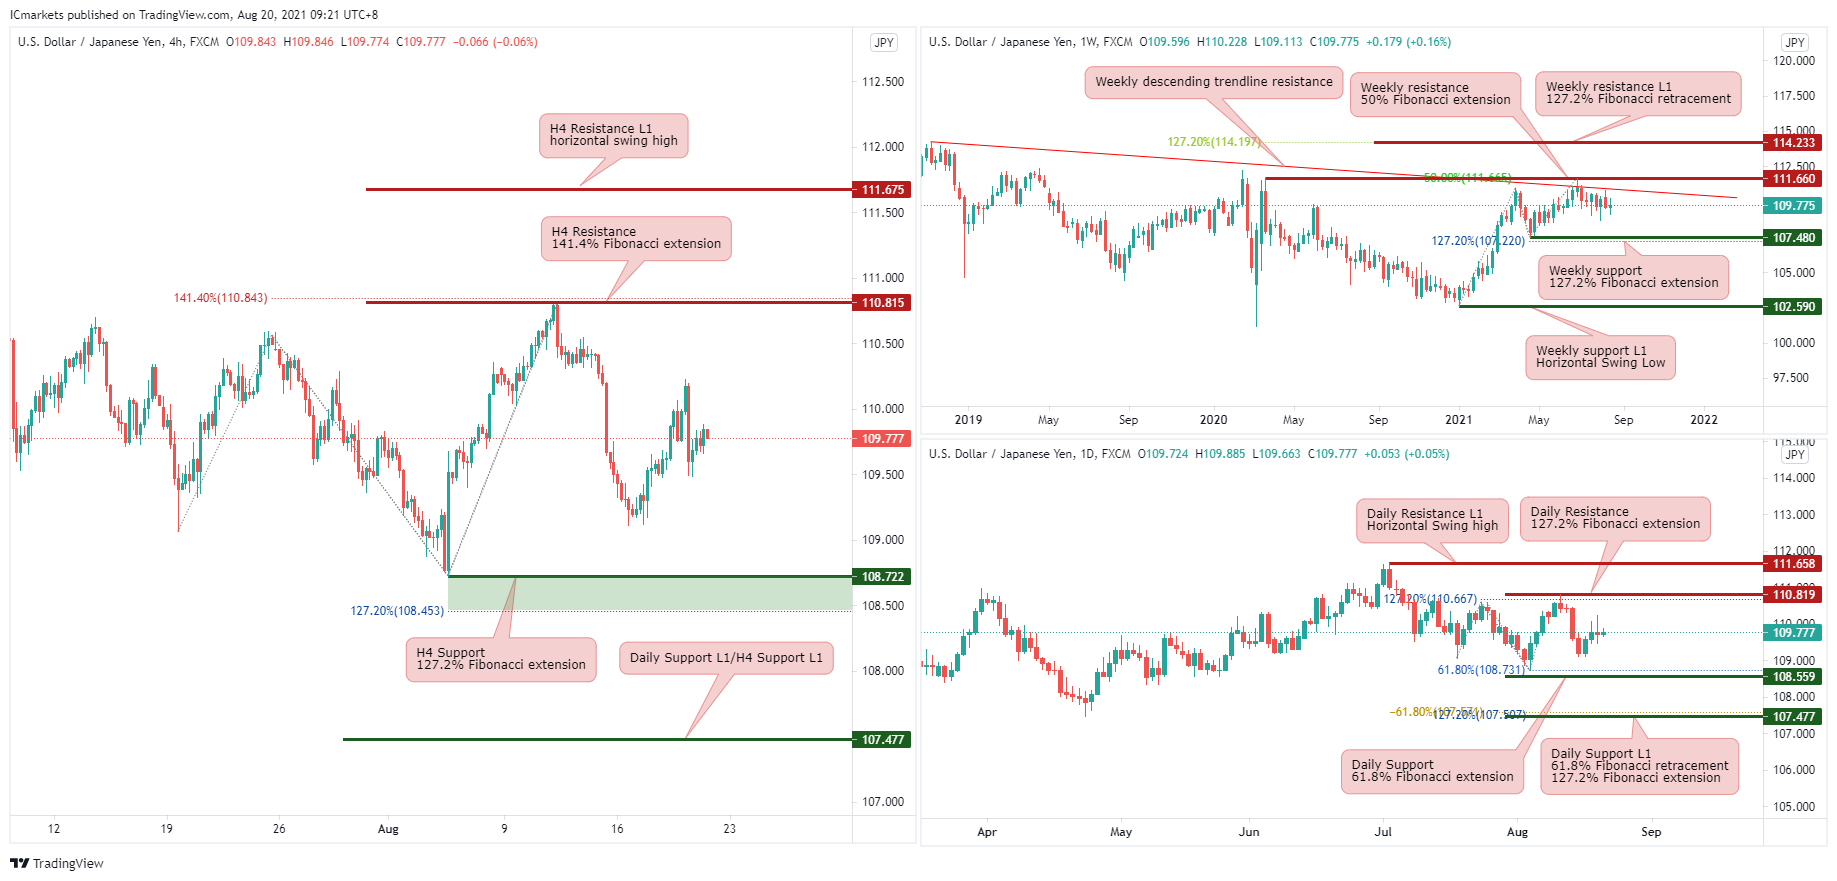
From the weekly timeframe, price is below the descending trendline resistance, and may bearish to weekly support 107.480 in line with 127.2% Fibonacci extension. On the other hand, price might move above the weekly descending trendline resistance and may move towards the weekly resistance at 111.660 in line with 50% Fibonacci extension.
On the Daily timeframe, price may bearish to the Daily support at 108.559 in line with 61.8% Fibonacci extension. On the other hand, price might move towards the Daily resistance at 110.819 in line with 127.2% Fibonacci extension.
On the H4 timeframe, price may bearish to the H4 support at 108.722 in line with 127.2% Fibonacci extension. On the other hand, price might move towards the H4 resistance at 110.815 in line with 141.4% Fibonacci extension.
Areas of consideration:
- 815 resistance level on the H4 timeframe
- 722 support level on the H4 timeframe
AUD/USD:
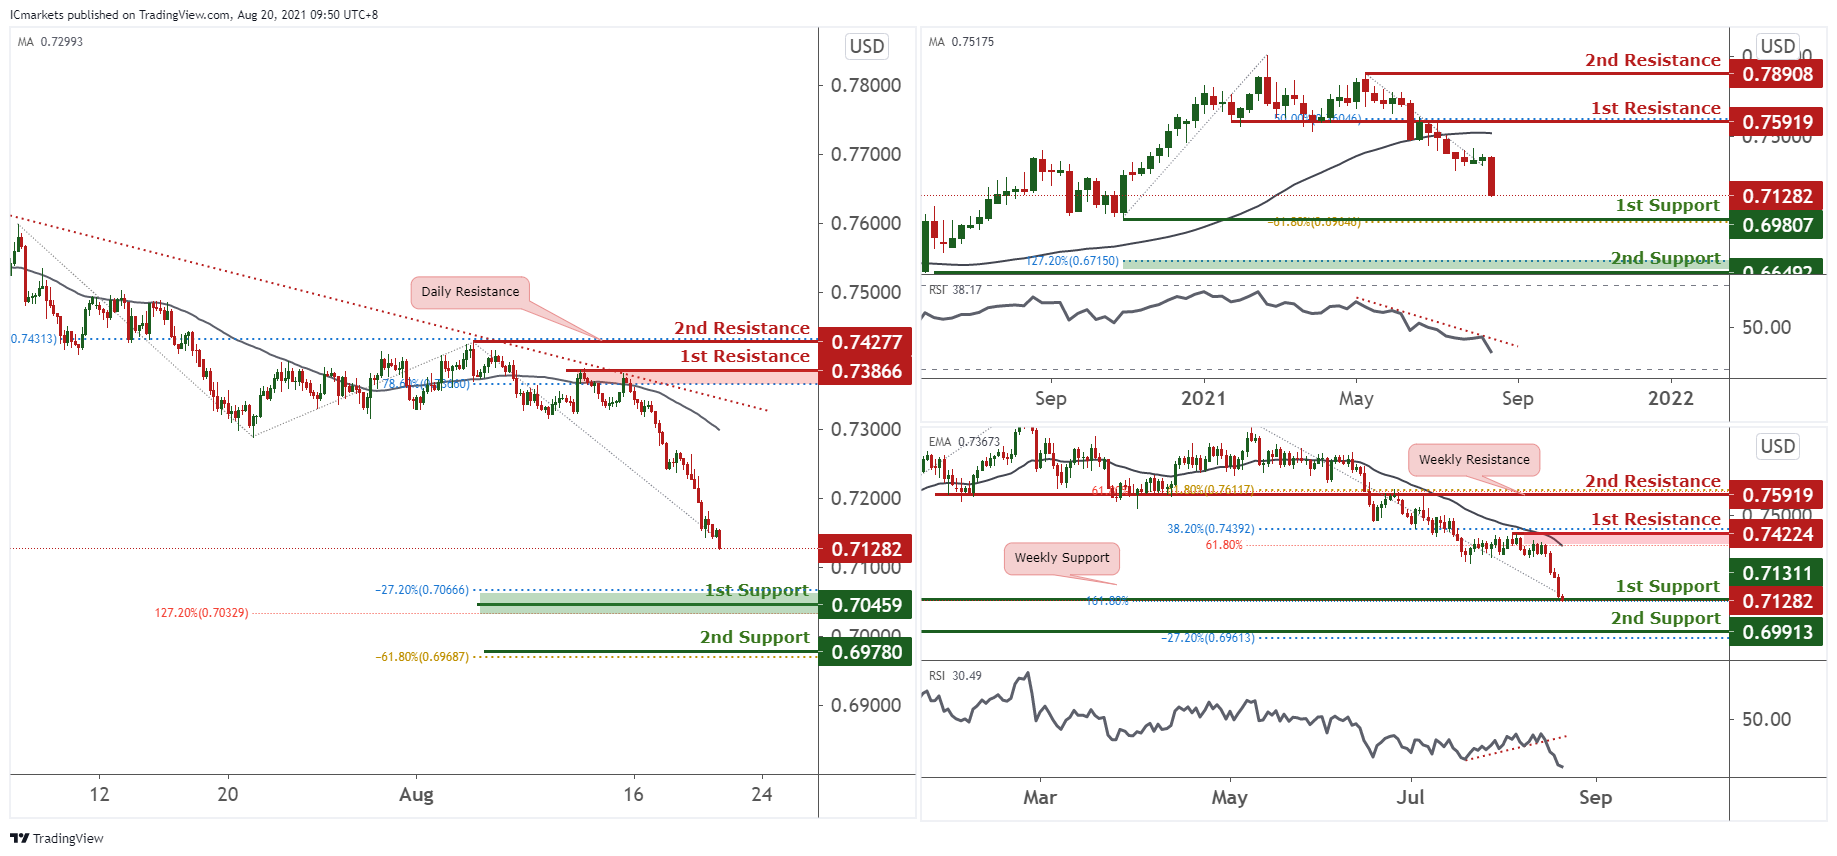
On the weekly, price is holding under the MA 50 showing bearish momentum, price is expected to put towards the first support in line with the -61.8% Fibonacci retracement level. Our bearish bias is further supported by the RSI indicator, it is showing a potential downward trend hence signifying a bearish momentum. On the Daily, the price is holding below EMA 34 showing a potential bearish momentum, price is expected to push downwards to the first support at 0.71311 in line with the 161.8% Fibonacci extension. Our bearish bias is further supported with the RSI indicator that broke the uptrend support turn resistance.
On the H4, price dropped lower and is approaching 1st support at 0.70459. Price is holding below the MA 50 indicating a continuation of a downward trend, our bearish bias is further supported by the price holding below the overall descending trendline resistance. Otherwise, failure to reach at 1st Support will see price bounce towards 1st resistance at 0.73866 in line with 78.6% Fibonacci retracement.
Areas of consideration:
- H4 potential reversal at 1st support.
NZD/USD:
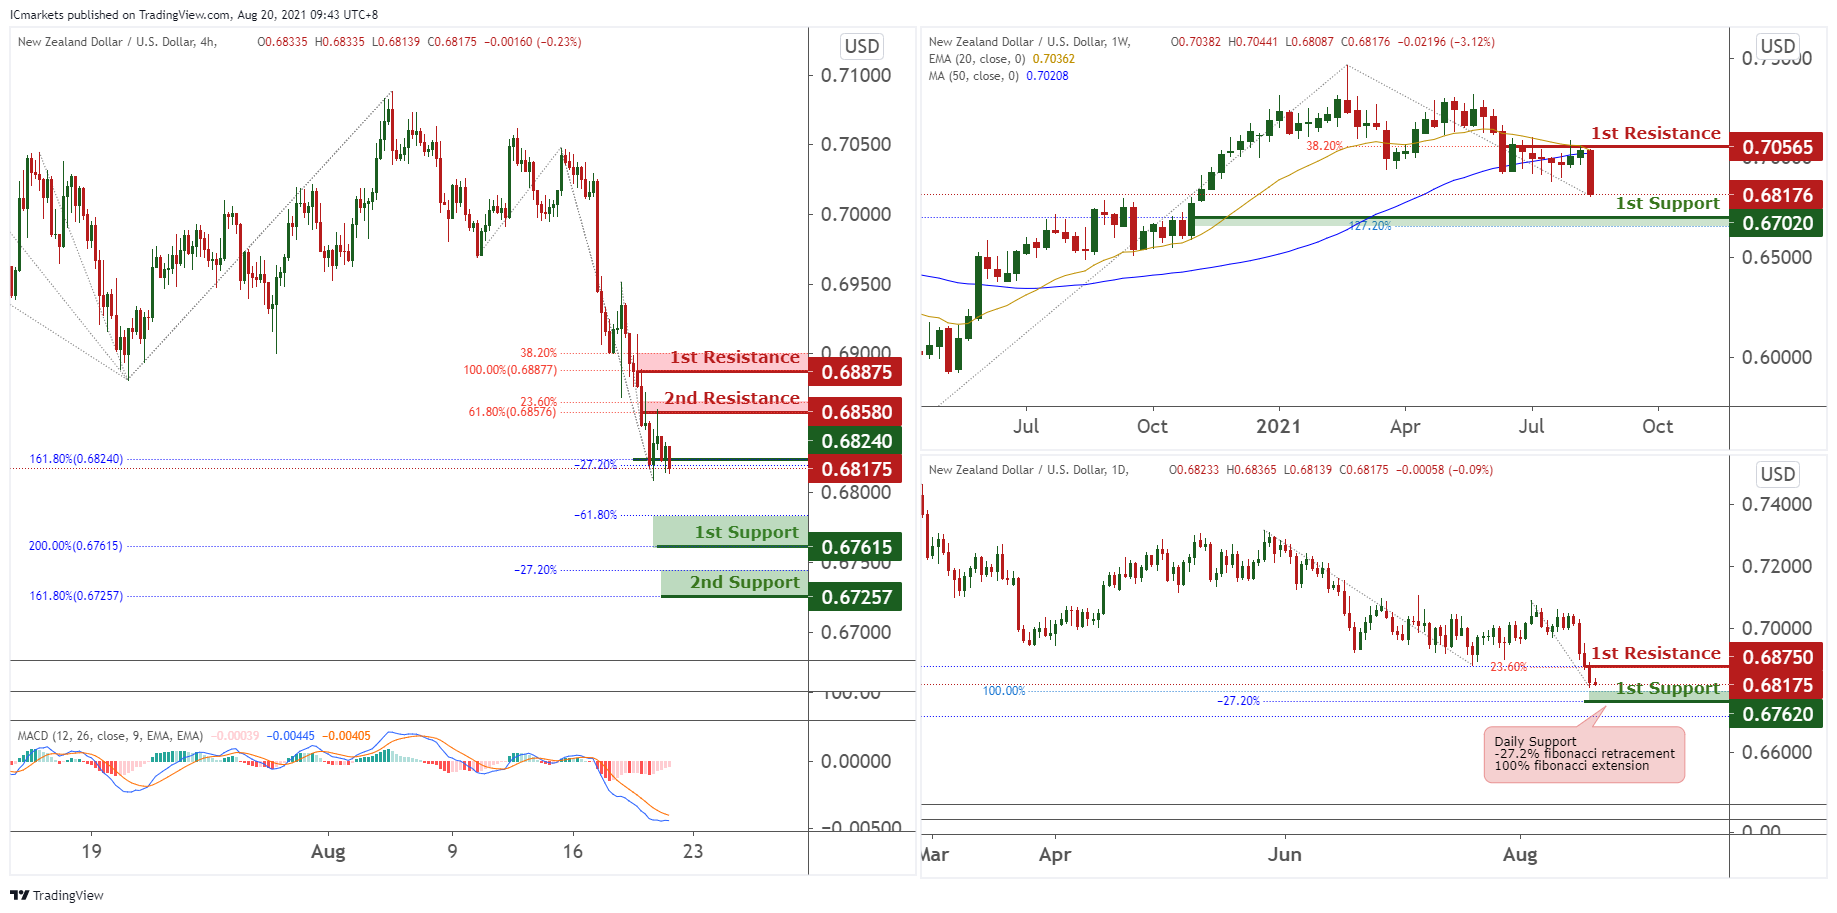
Looking at the weekly chart we could see that price broke below support at 0.69080 where it could potentially swing towards support at 0.67020, in-line with 38.2% Fibonacci retracement and 127.2% Fibonacci extension. On the Daily chart, if the price broke below 0.68750, it could potentially swing towards next support at 0.67620, in-line with -27.2% Fibonacci retracement and 100% Fibonacci extension.
On the H4 timeframe, prices dropped to support at 0.68240, in-line with -27.2% Fibonacci retracement and 161.8% Fibonacci extension. Price could potentially face further bearish pressure to first support at 0.67615, in-line with -61.8% Fibonacci retracement and 200% Fibonacci extension. MACD is also indicating bearish momentum for further downside. The next potential support will be at 0.67257, in-line with -27.2% Fibonacci retracement and 161.8% Fibonacci extension.
If price bounces, it could potentially swing towards resistance at 0.68580, in-line with 23.6% Fibonacci retracement and 61.8% Fibonacci extension. The next potential resistance could be at 0.68875, in-line with 38.2% Fibonacci retracement and 100% Fibonacci extension
Areas of consideration:
- H4 time frame, support level at 0.67615 and 67257
- H4 time frame, resistance level at 68580 and 0.68875
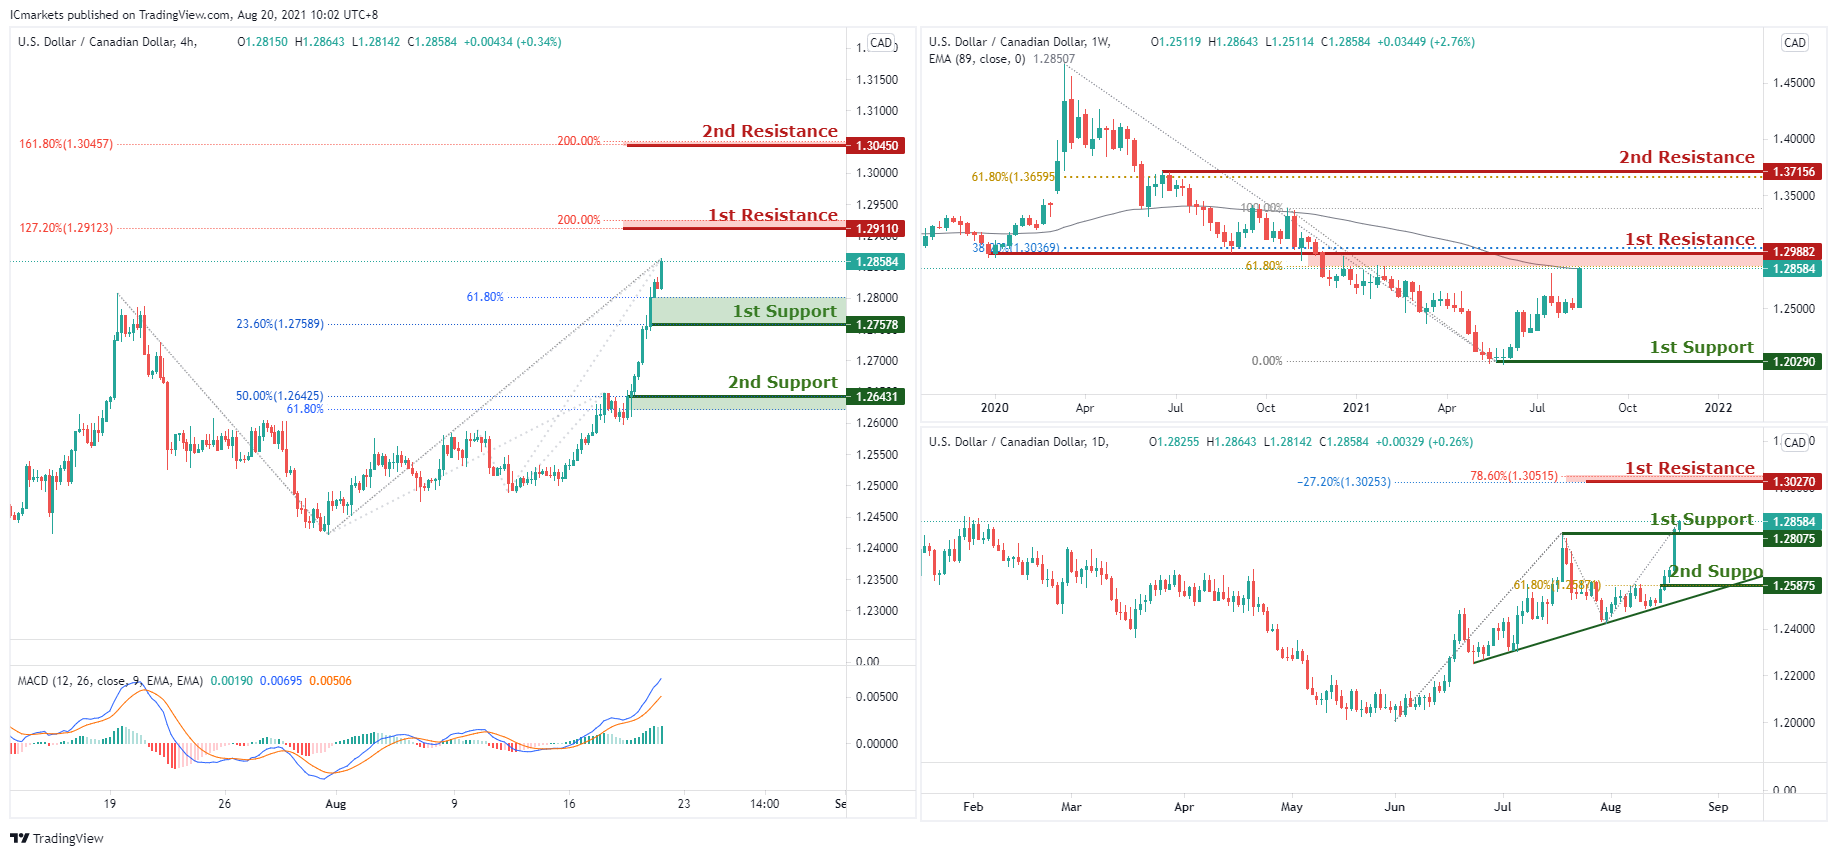
USD/CAD:
On the Weekly timeframe, price is approaching long term moving average and also both 38.2% and 61.8% Fibonacci retracement level at 1.29950. As long as the price is holding below this level, we could potentially see the price facing further bearish pressure in the long term. On the Daily price bounced above previous swing high, there could potentially be further upside to 1st resistance.
On the H4, prices bounced above previous high at 1.2805 and is heading towards potential first resistance at 1.29110, in-line with 127.2% Fibonacci retracement and 200% Fibonacci extension. MACD is also indicating bullish momentum for further upside. It could potentially continue its bullish momentum to next resistance at 1.30450, in-line with 161.8% Fibonacci retracement and 200% Fibonacci extension.
If price drops from current level, it could potentially find support at 1.27578, in-line with 23.6% Fibonacci retracement and 61.8% Fibonacci extension. The next potential support will be at 1.26431, in-line with 50% Fibonacci retracement and 61.8% Fibonacci extension.
Areas of consideration:
- H4 time frame, support level at 1.27578 and 26431
- H4 time frame, resistance level at 29110 and 1.30450
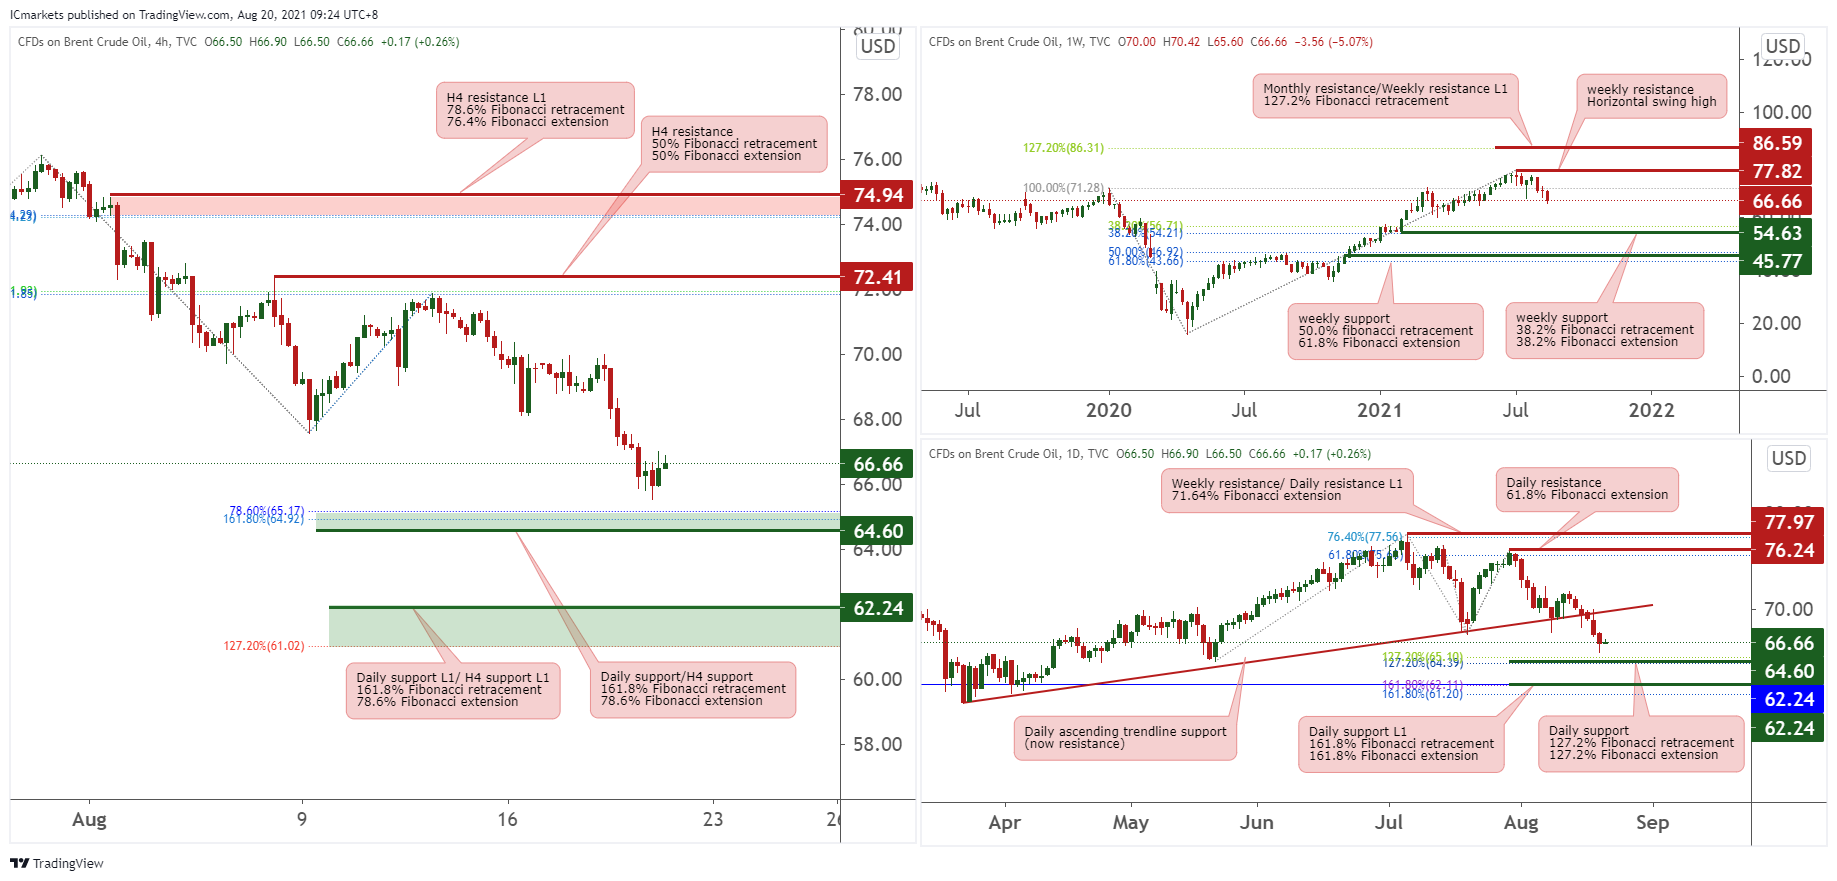
OIL:
On Weekly timeframe, we can see price has reversed from weekly resistance from horizontal swing high at 77.82, price may continue its bearish momentum, may find support at 54.63 in line with 38.2% Fibonacci retracement and 38.2% Fibonacci extension. However, if price breaks above 77.82 which is weekly resistance at horizontal swing high, it may swing up towards the Weekly resistance L1 at 86.59 in line with 127.2% Fibonacci retracement.
On the Daily timeframe, we are seeing a similar bearish pressure as price breakthroughs the ascending trendline support (now resistance) and may find Daily support at 64.6 which is in line with 127.2% Fibonacci retracement and 127.2% Fibonacci extension. Otherwise, price may move towards the Daily resistance at 76.24 in line with 61.8% Fibonacci extension.
Lastly, on the H4 timeframe, price may continue to bearish below the H4 resistance at 72.41 in line with 50% Fibonacci retracement and 50% Fibonacci extension and may head towards the H4 support at 64.6 in line with 161.8% Fibonacci retracement and 78.6% Fibonacci extension and may continue to its bearish momentum towards the H4 support L1 at 62.24 in line with 161.8% Fibonacci retracement and 78.6% Fibonacci extension. Otherwise price may move towards the H4 resistance at 72.41 in line 50% Fibonacci retracement and 50% Fibonacci extension.
Areas of consideration:
- 41 resistance level on the H4 timeframe
- 6 support level on the H4 timeframe
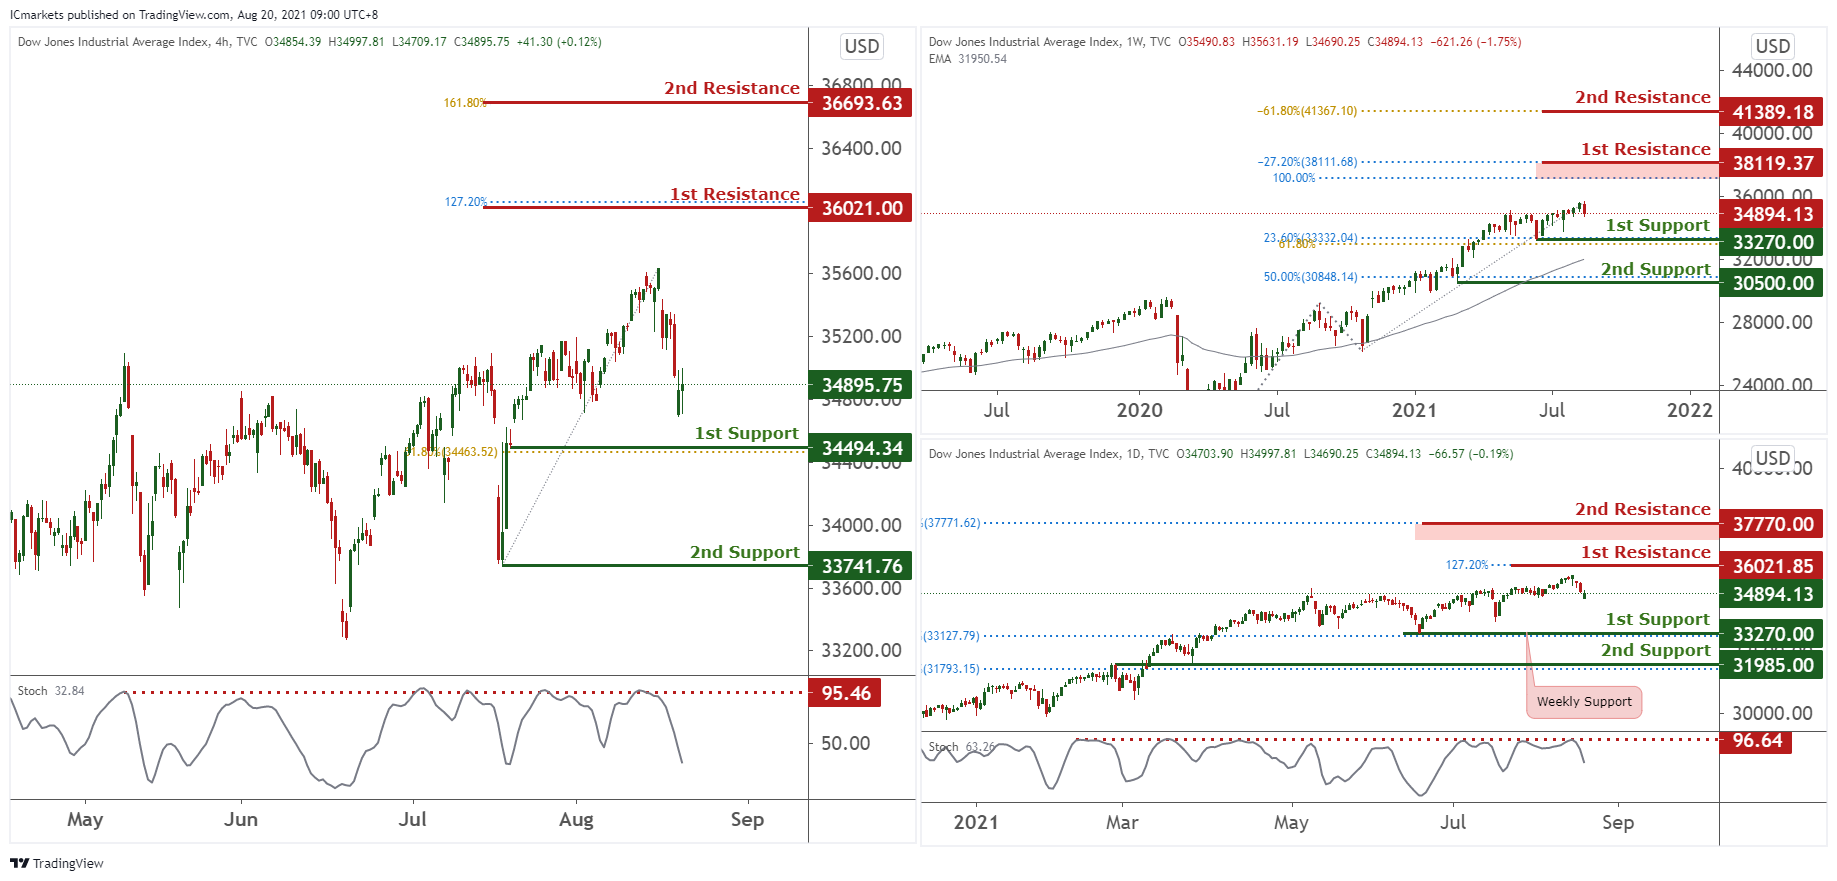
Dow Jones Industrial Average:
On the weekly chart, price is trading sideways holding between 33270 support and 38119.37 resistance. With price holding above long term moving average, we see a possibility of price facing further bullish pressure.
On the Daily chart, price is still testing and holding below resistance at 36021. With stochastic still holding below resistance where price dropped in the past, we see price facing possible bearish pressure.
On the H4, price is below resistance at 36021 in line with 127.2% Fibonacci extension. With stochastics below the resistance, we might continue to see a bearish scenario where sellers may enter and push price lower towards 1st support at 34494.34 in line with 61.8% Fibonacci retracement. Otherwise, price may swing towards 1st resistance at 36021 instead.
Areas of consideration:
- 36021 resistance level on the H4 timeframe
- 34494 support level on the H4 timeframe
The accuracy, completeness and timeliness of the information contained on this site cannot be guaranteed. IC Markets does not warranty, guarantee or make any representations, or assume any liability regarding financial results based on the use of the information in the site.
News, views, opinions, recommendations and other information obtained from sources outside of www.icmarkets.com.au, used in this site are believed to be reliable, but we cannot guarantee their accuracy or completeness. All such information is subject to change at any time without notice. IC Markets assumes no responsibility for the content of any linked site.
The fact that such links may exist does not indicate approval or endorsement of any material contained on any linked site. IC Markets is not liable for any harm caused by the transmission, through accessing the services or information on this site, of a computer virus, or other computer code or programming device that might be used to access, delete, damage, disable, disrupt or otherwise impede in any manner, the operation of the site or of any user’s software, hardware, data or property.


