
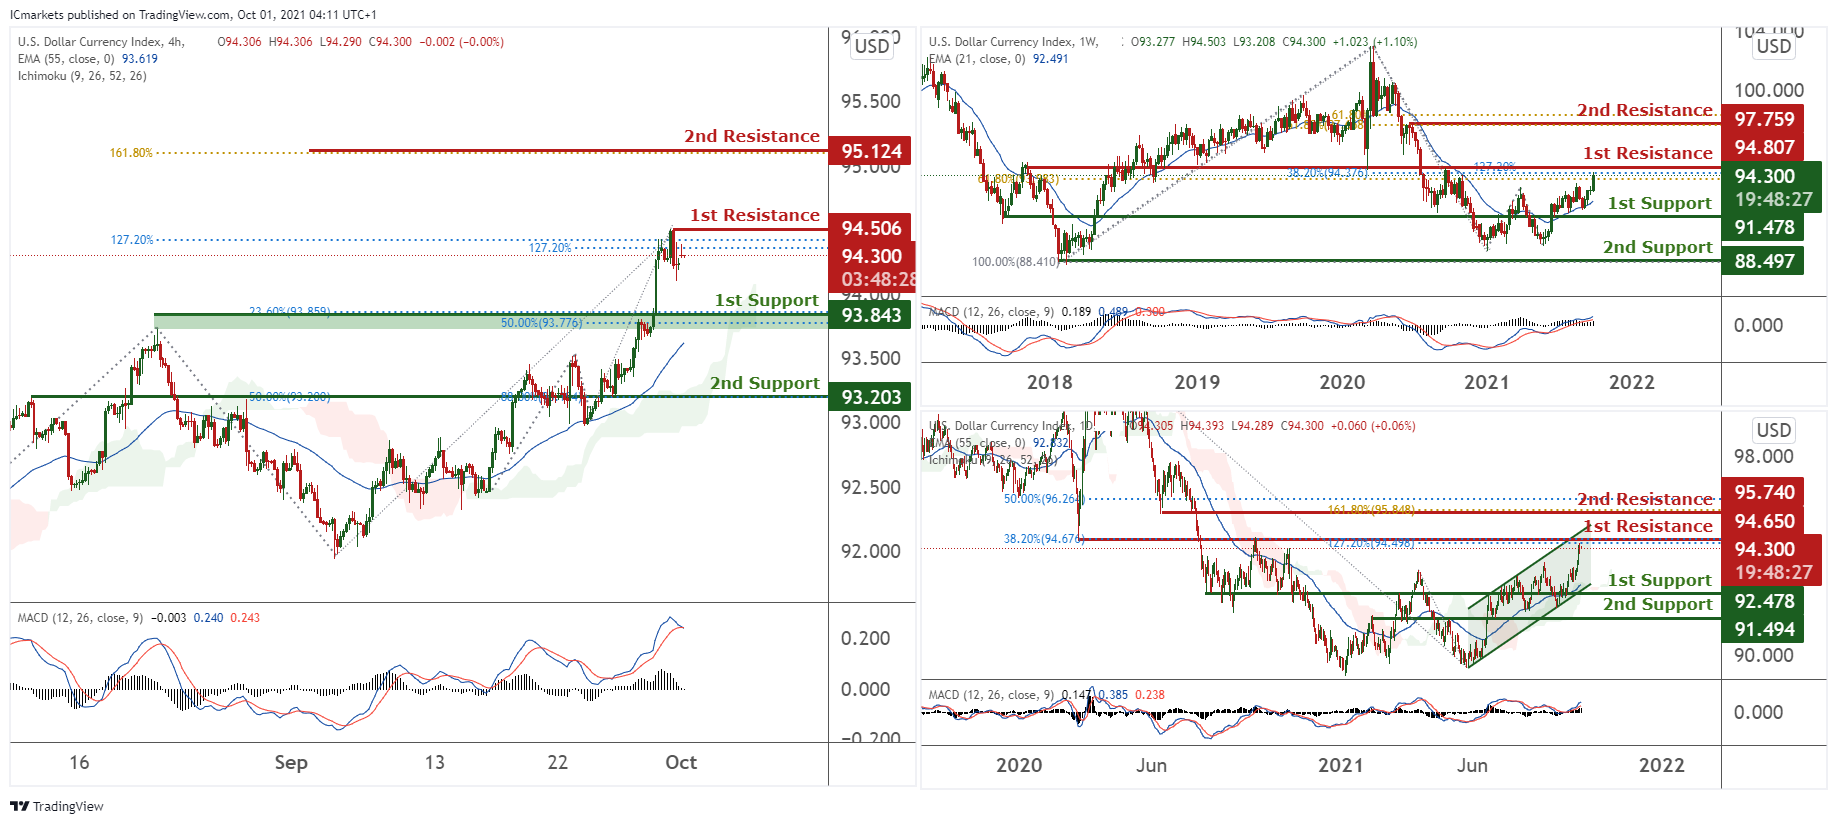
DXY:
Looking at the Weekly chart price has recently bounced off our 1st support at 91.478 and is climbing to our 1st resistance at 94.807 in line with 61.8% and 38.2% Fibonacci retracement and 127.2% Fibonacci extension. Prices have the potential to climb higher towards our 2nd resistance at 97.759 in line with 61.8% Fibonacci retracement and extension. Technical indicators are showing bullish momentum.
On the Daily timeframe, it is consolidating in an upward channel and has recently tested our 1st resistance at 94.650 in line with 127.2% extension and 38.2% Fibonacci retracement. We see a potential for further upside before a pullback towards our 1st support at 92.478 in line with our channel and graphical overlay. Technical indicators are showing bullish momentum.
On the H4 timeframe, prices have recently tested our 1st resistance at 94.506 in line with 127.2% Fibonacci retracement and Fibonacci extension. We see a potential of prices climbing higher towards our 2nd resistance at 95.124 in line with 161.8% Fibonacci retracement. Technical indicators are showing bullish momentum. Alternatively, prices may dip towards our 1st support at 83.843 in line with 23.6% and 50% Fibonacci retracement.
Areas of consideration:
- H4 time frame, 1st resistance of 94.506
- H4 time frame, 1st support of 93.843
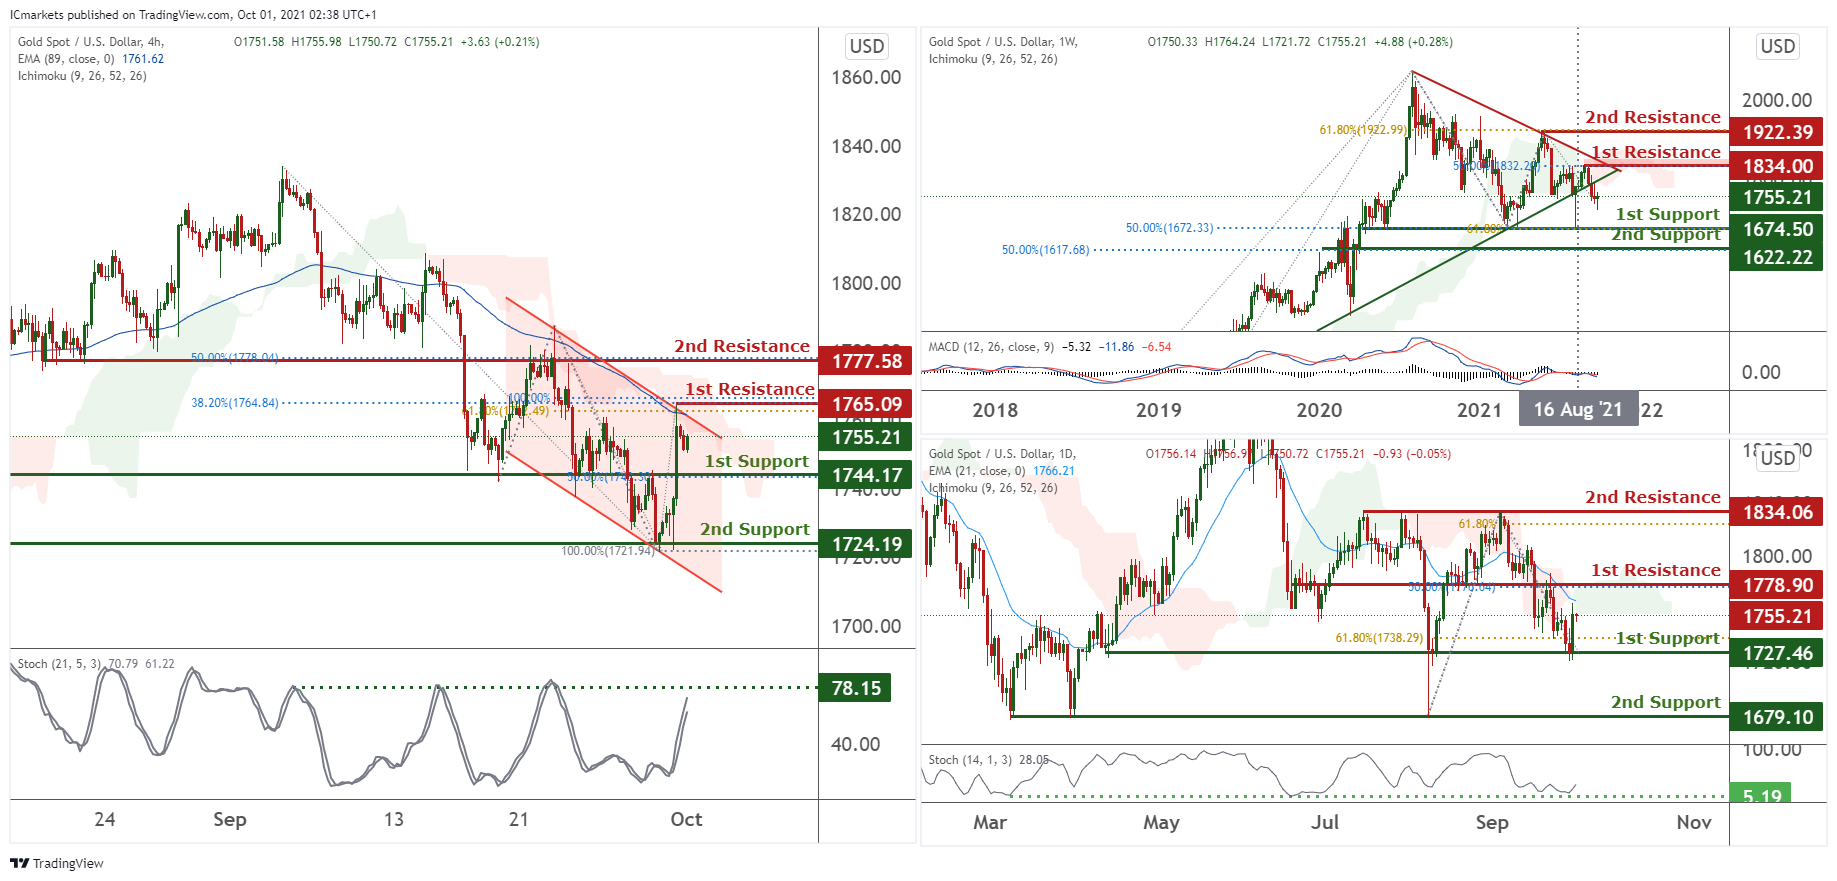
XAU/USD (GOLD):
On the weekly timeframe, price has recently broken below our ascending trendline support and might be dipping further towards 1st support at 1674.5, 61,8% Fibonacci extension and 50% Fibonacci retracement. Long term buyers could look to short the market as indicators are showing bearish momentum. Breaking the 1st support will see prices dipping further to our 2nd area of support at 1623.01 in line with 50% Fibonacci retracement. Alternatively, we might see price rebound to our 1st resistance at 1834 in line with 50% Fibonacci retracement and bearish trendline before dipping further.
On the Daily chart, price has recently rebounded towards our 20 EMA line and has recently bounced off our 1st support at 1727.46. in line with 61.8% Fibonacci retracement. We see the possibility of bullish reversal towards 1st resistance at 1778.9 in line with 50% Fibonacci retracement. Technical indicators are forecasting potential trend reversal.
On the H4 chart, price has recently experienced a bounce and is consolidating in a bearish parallel channel. We foresee a possible pullback in prices towards our 1st support at 1744.17 in line with 50% Fibonacci retracement and graphical overlay. Technical indicators are also showing bearish momentum. Alternatively, price may climb towards 1st resistance at 1765.09 in line with 38.2% and 61.8% Fibonacci retracement, 100% Fibonacci extension and parallel channel. Breaking the channel may find prices swing higher towards our 2nd resistance at 1757.18 in line with 50% Fibonacci retracement and Ichimoku cloud resistance.
Areas of consideration:
- 4h 1st support at 1744.17
- 4h 1st resistance 1765.09
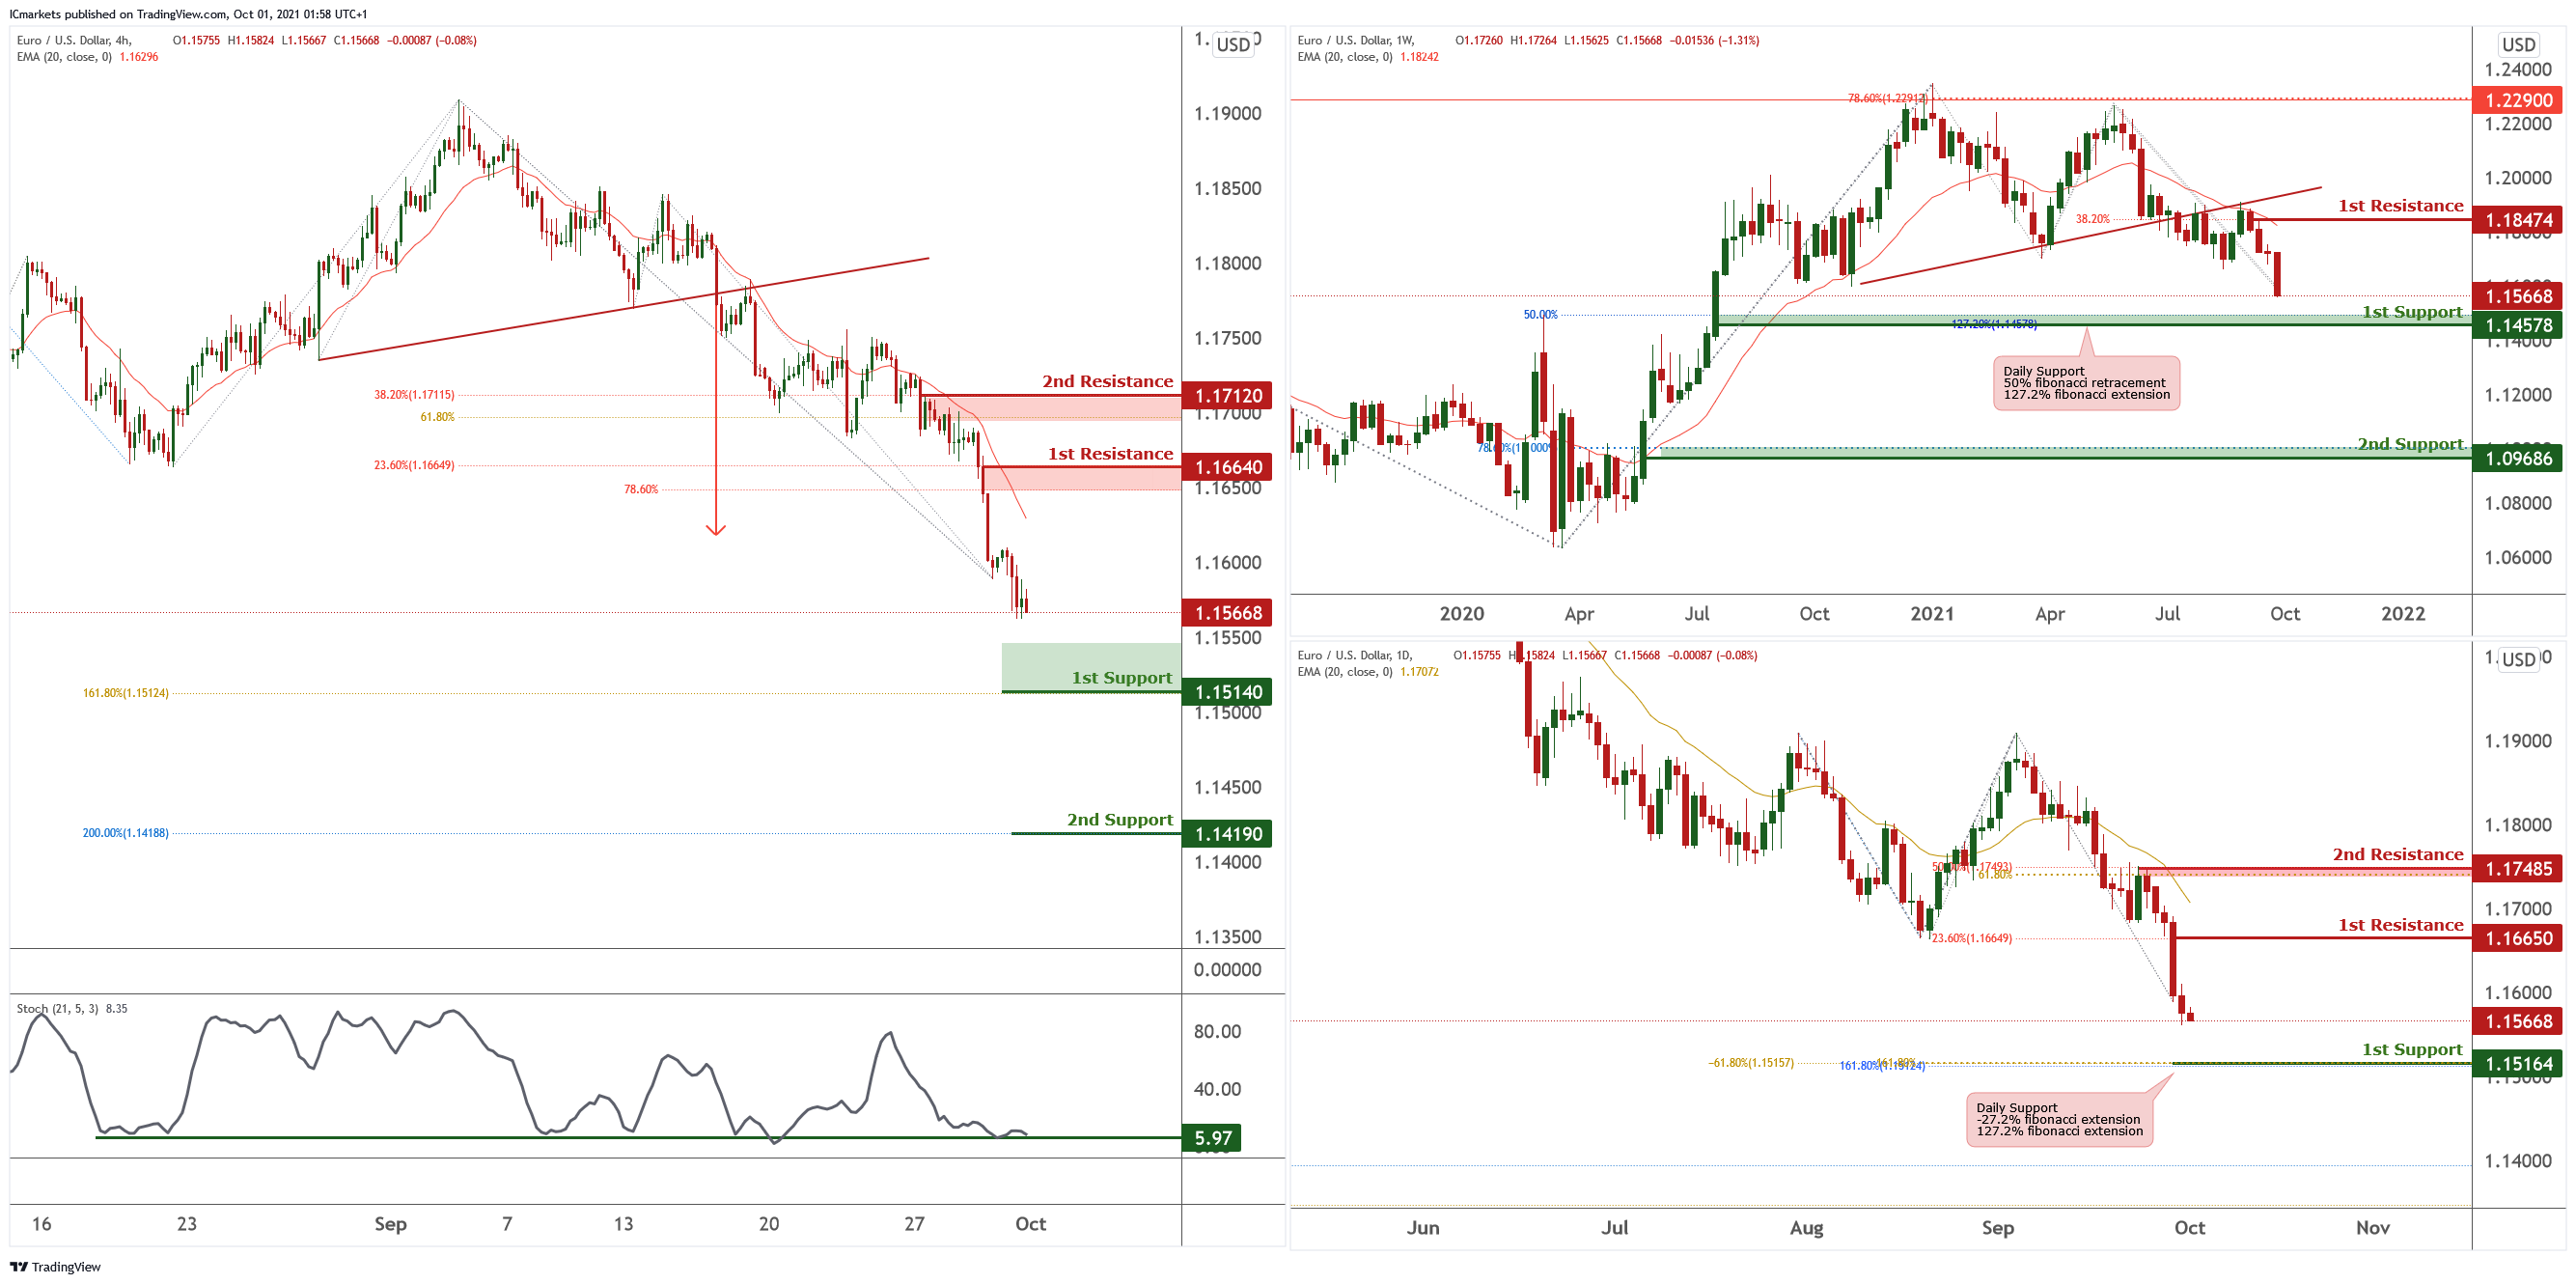
EUR/USD:
Looking at the weekly time frame price has attempted to break the 1st resistance area of 1.18474 but has failed and is heading towards its first support level of 1.14578 in line with Fibonacci retracement level of 50% and Fibonacci extension level of 127.2%. If price breaks its first first support, it might head towards the 2nd support of 1.09686 which is in line with Fibonacci level of 78.6%.
On the daily chart, Price has bounced off its recent support if 1.16650 which is in line with Fibonacci level of 23.6% and is heading towards the 1st support of 1.15164 which is in line with the Fibonacci Retracement level of 161.8% and Fibonacci extension level of 161.8%. Price may be in free fall if it is to break its first support.
On the H4 chart, Price has dip from its first resistance level and is heading towards its first support of 1.15140 which is in line with Fibonacci Retracement level of 161.8%. If price were to break its first support it will head towards its second support of 1.14190 which is in line with Fibonacci Extension level of 200%. Stochastic is currently at its support level of 5.97 which shows that there might be a potential for price to bounce before a quick dip back to its first support. Price is also currently trading under its 20EMA which further suggest price might continue to dip.
Areas of consideration:
- H4 time frame, support level at 1.15140 and 1.14190
- H4 time frame, resistance level at 1.16640 and 1.17120
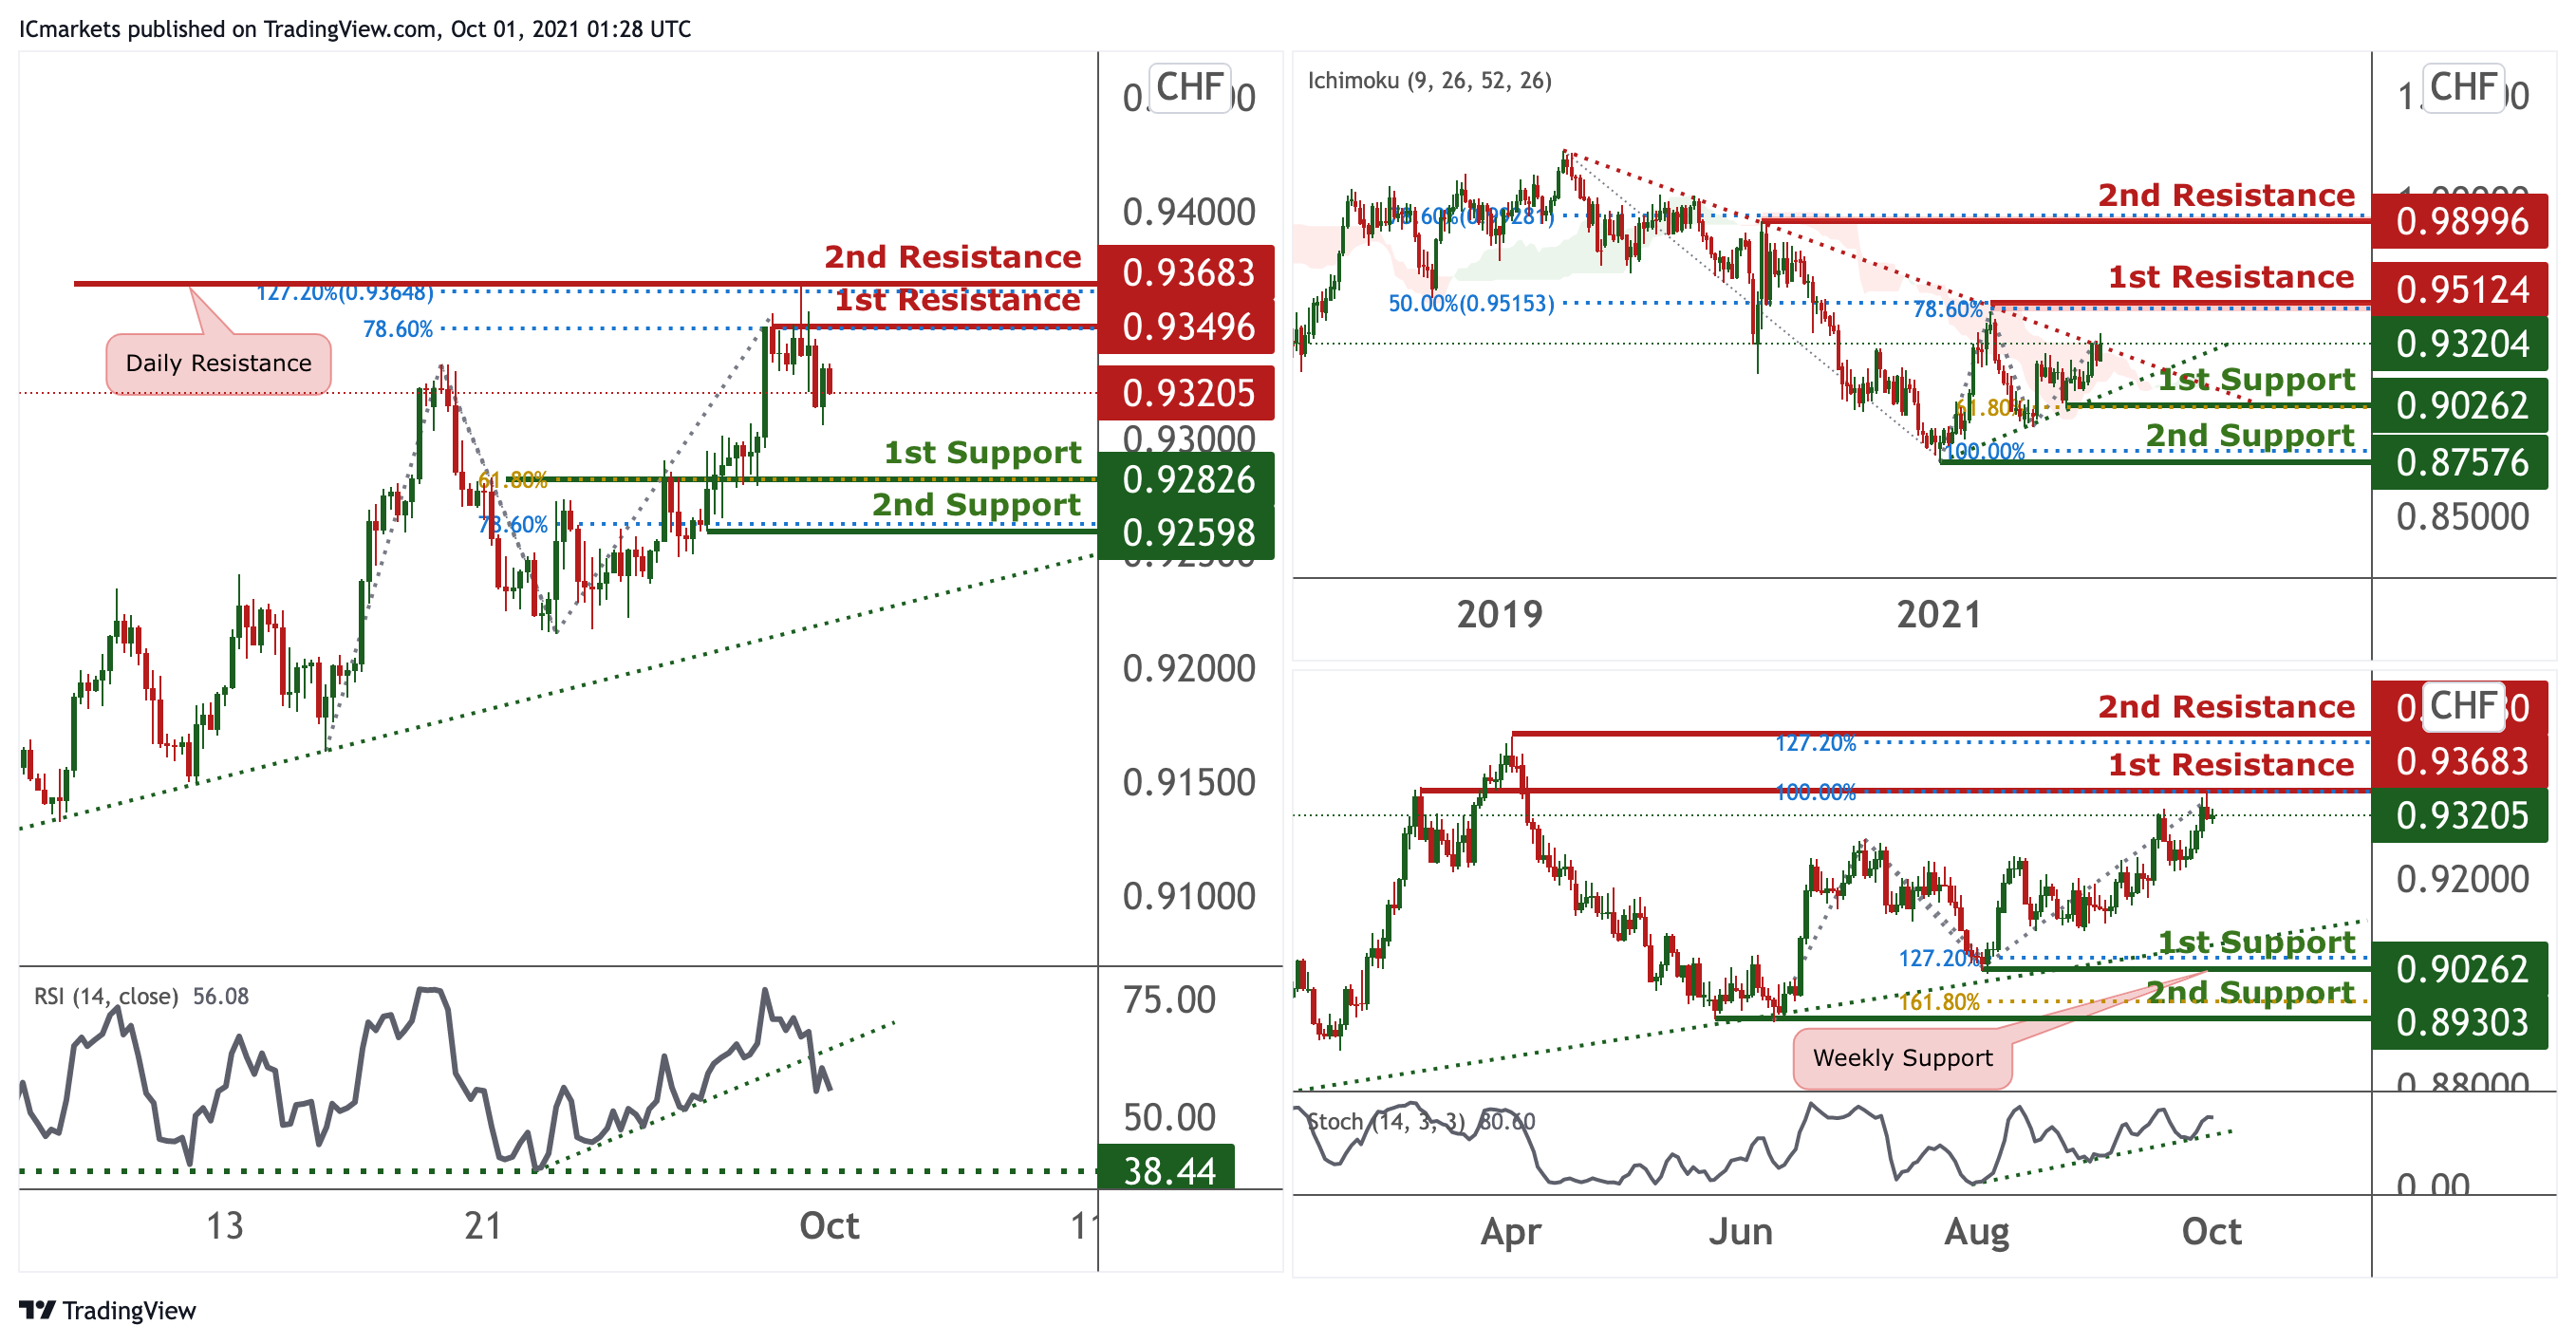
USD/CHF:
On the weekly, price is holding above ascending trendline support however, it is also at the descending trendline resistance, price might reverse back down and drop towards the ascending trendline support as there is also a strong Ichimoku cloud that might prevent the breakthrough of the resistance. Price is also between 1st resistance at 0.95124 and 1st support at 0.90262. Traders should watch these levels closely for a break to see prices swing higher or drop lower. On the Daily, price is seen to have a bullish momentum abiding to the daily ascending trendline. We can expect the price to move towards the 1st resistance at 0.93683. With stochastics abiding to the ascending trendline, we can see that there is potential continuation of the bullish movement.
On the H4, price is seen to be reacting in between 1st Resistance 0.93496 and 1st Support 0.92826 and holding above the ascending trendline support,however, price failed to break through the 1st Resistance and hence, we can expect a short-term bearish drop towards the 1st support in line with 61.8% Fibonacci Projection. Our short-term bearish bias is further supported by the RSI indicator where it broke off the ascending trendline support.
Areas of consideration:
- Watch 1st Support at 0.92826
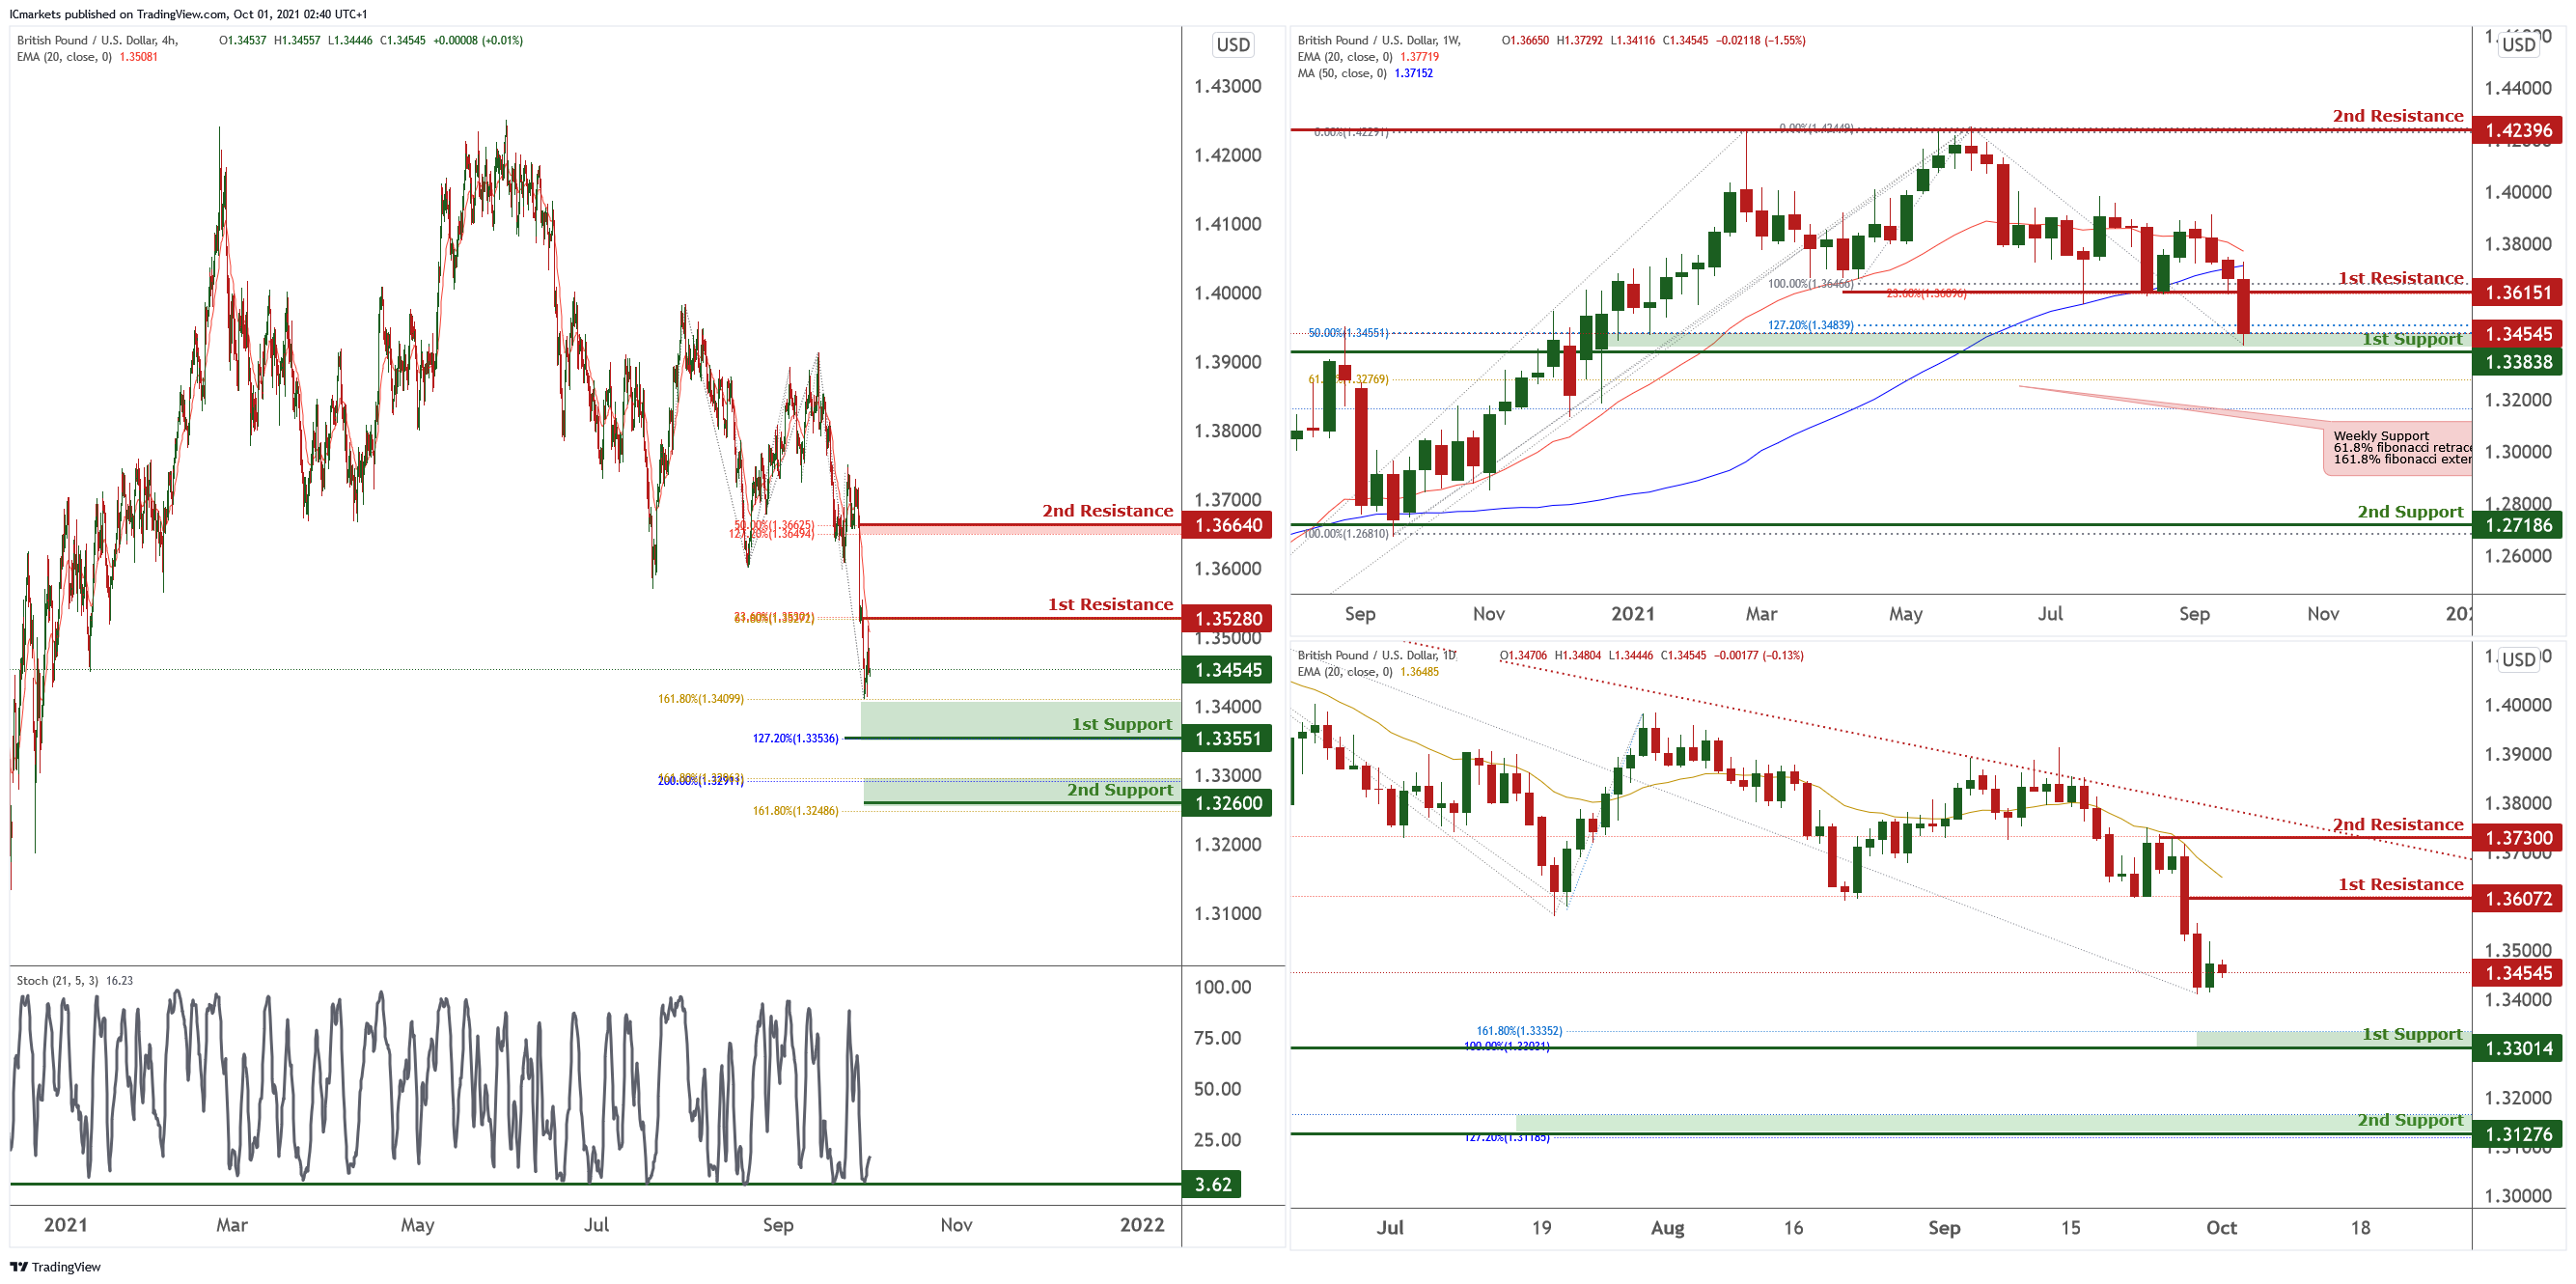
GBP/USD:
Looking at the weekly chart, the price broke below support at 1.34630, in-line with 50% Fibonacci retracement and 127.2% Fibonacci extension. On the Daily time frame, price dropped to support at 1.34435, in-line with 38.2% Fibonacci retracement and 78.6% Fibonacci extension. Price could potentially drop to next support at 1.33000, in-line with 161.8% Fibonacci retracement and 100% Fibonacci extension.
On the H4 timeframe price dropped and found support at 1.34527, in-line with 127.2% Fibonacci retracement and 100% Fibonacci extension. We could potentially see a short-term bounce to first resistance at 1.35280, in-line with 23.6% Fibonacci retracement and 61.8% Fibonacci extension. Stochastic is also at support where previous bounces occurred. The next potential resistance could be at 1.36640, in-line with 50% Fibonacci retracement and 127.2% Fibonacci extension.
If price drops, it could potentially drop to first support at 1.33651, in-line with 161.8% Fibonacci retracement and 127.2% Fibonacci extension. The next potential support could be at 1.32600, in-line with 161.8% Fibonacci retracement and 161.8% Fibonacci extension.
Areas of consideration:
- H4 time frame, 33650 and 1.32600 support level
- H4 time frame, 1.35280 and 1.36640 resistance level
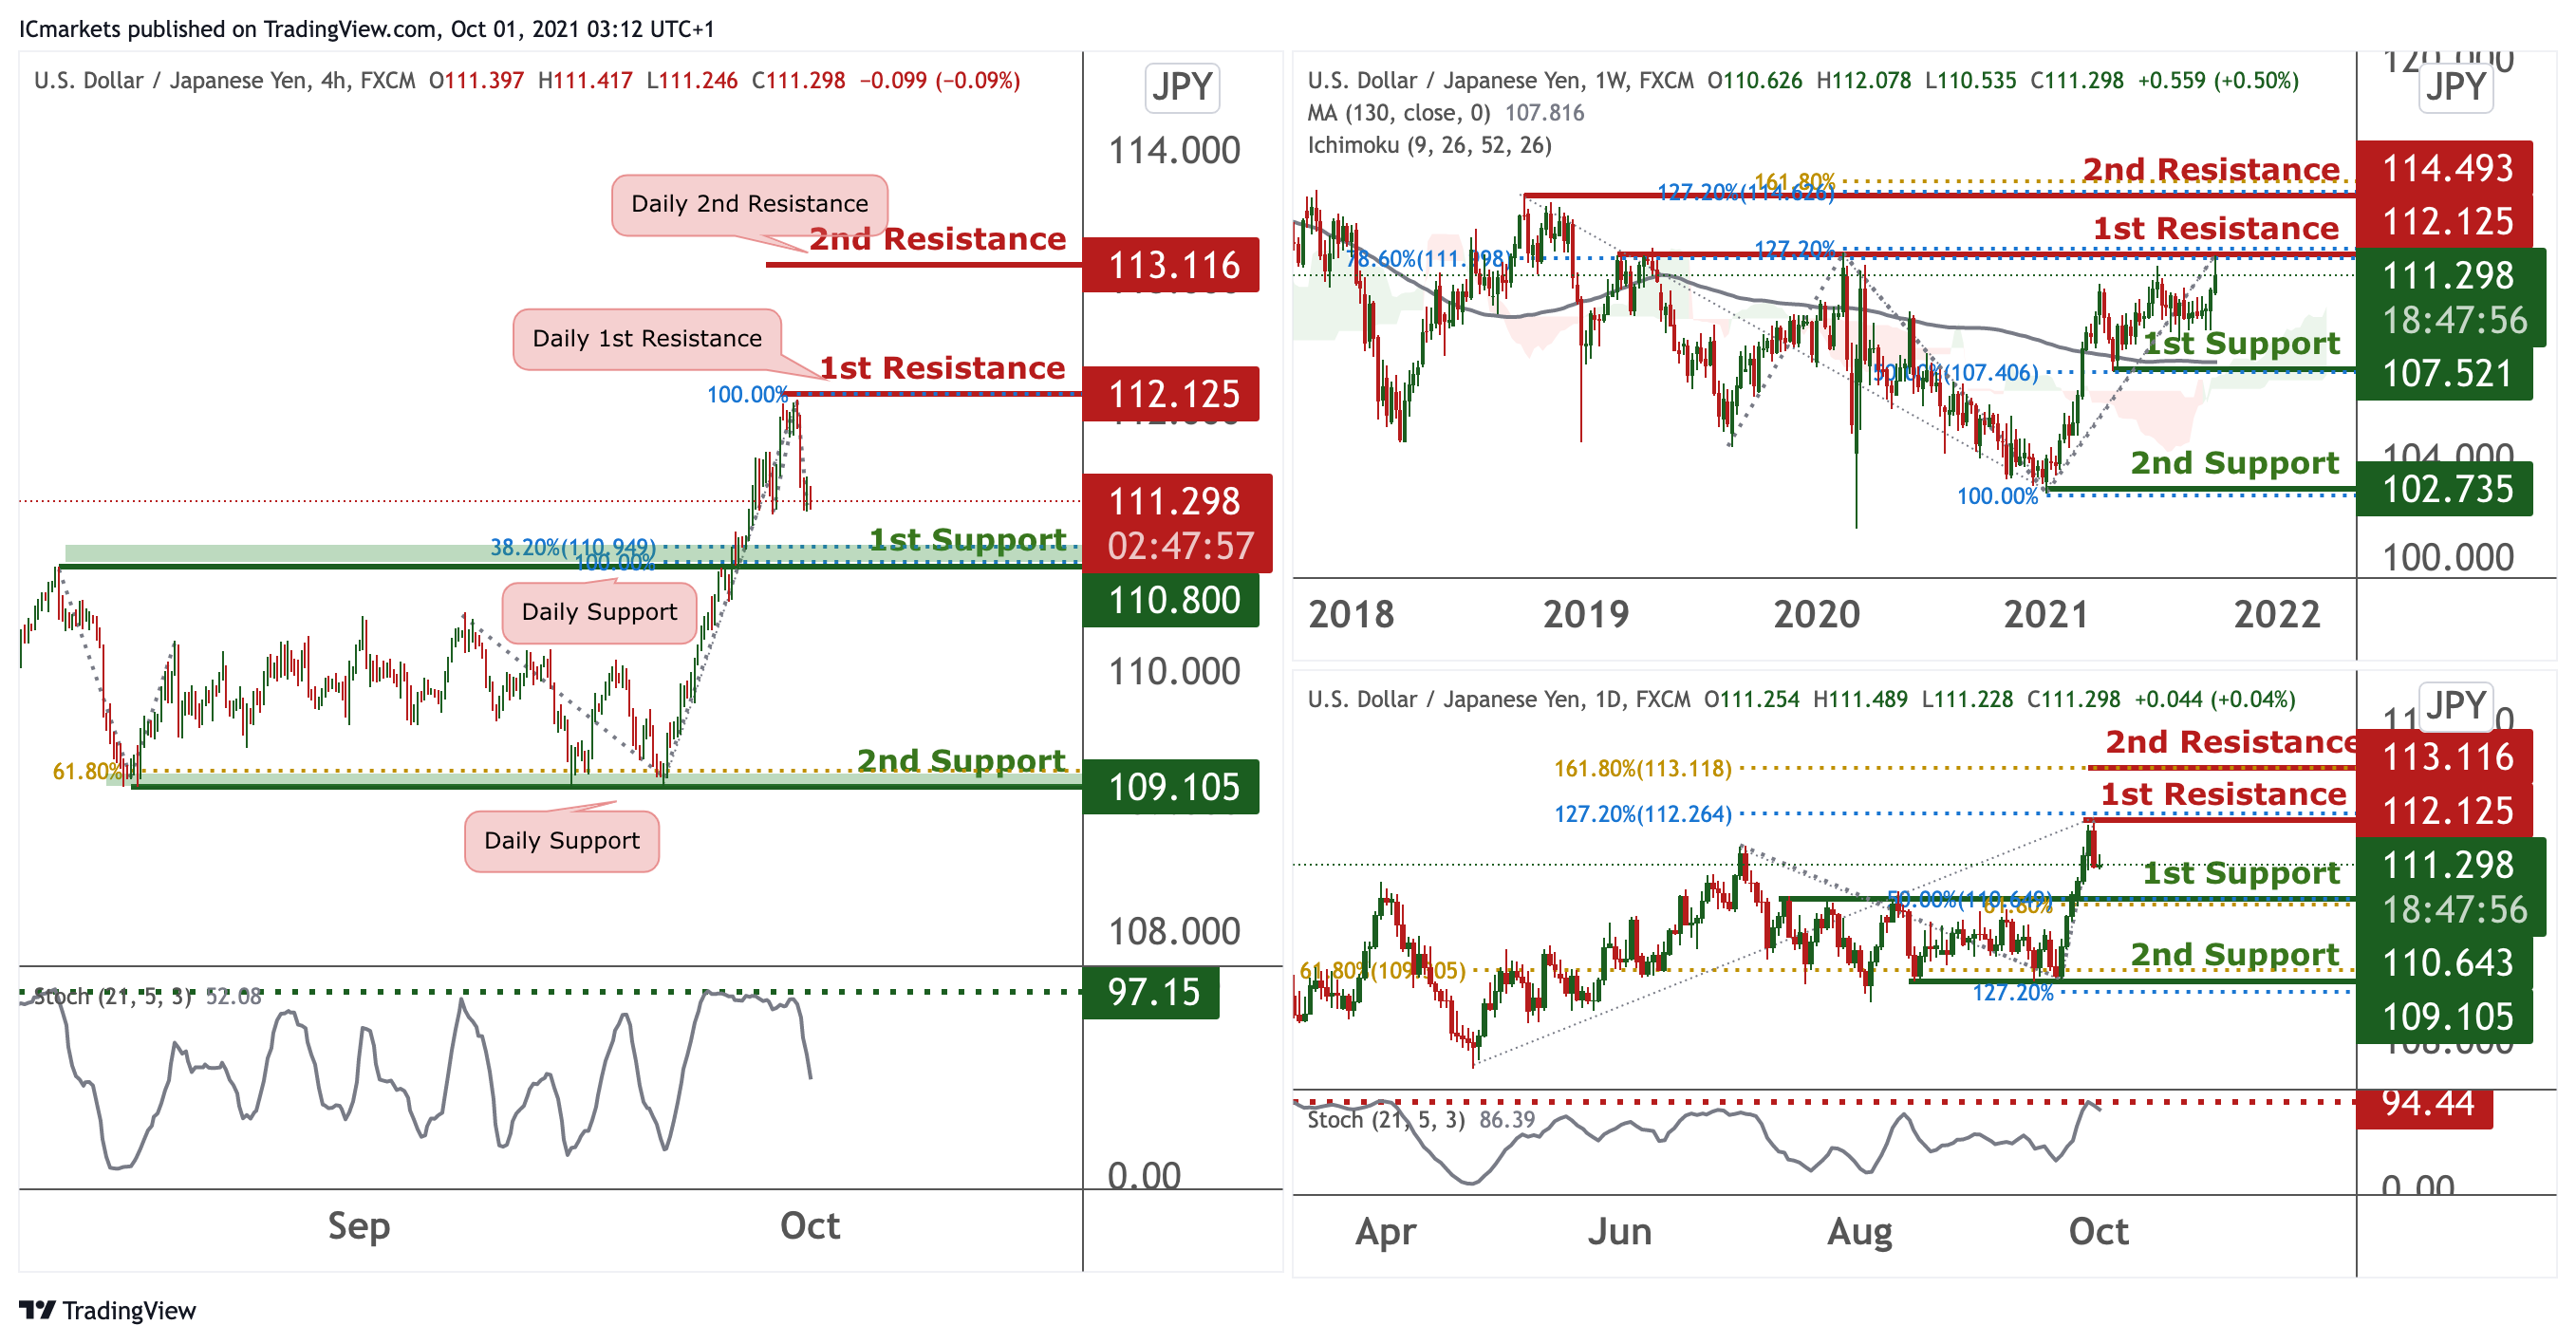
USD/JPY
On the Weekly timeframe, we can see that price is reacting at the 1st resistance in line with horizontal swing highs and 127.2% FIbonacci Projection and 78.6% Fibonacci Retracement. We can expect price to have a further bullish movement if it breaks through the first resistance, which would potentially move up towards the 2nd Resistance in line with 161.8% Fibonacci Projection and 127.2% Fibonacci Retracement. Price is currently holding above the 130period MA and the Ichimoku cloud is acting as a good support hence, in the short-term our bias is bullish if the price breaks through 1st Resistance. On the Daily timeframe, we can see a short term bearish momentum as price failed to push past the 1st Resistance, and is seen the reverse back down. We can expect the price to reverse back down to 1st support in line with 50% Fibonacci retracement and 61.8% FIbonacci Projection. Our short-term bearish bias is further supported by the stochastic indicator where the %K line touched the resistance awaiting for a drop.
On the H4 timeframe, price has just dropped from the 1st Resistance level and hence we can expect a continuation of the short -term bearish trend. We can expect price to reach the 1st support level in line with 38.2% Fibonacci retracement and 100% Fibonacci projection. Our short-term bearish bias is further supported by the stochastic indicator where the %K line dropped from the resistance level.
Areas of consideration:
- H4 time frame, 1st support of 110.800
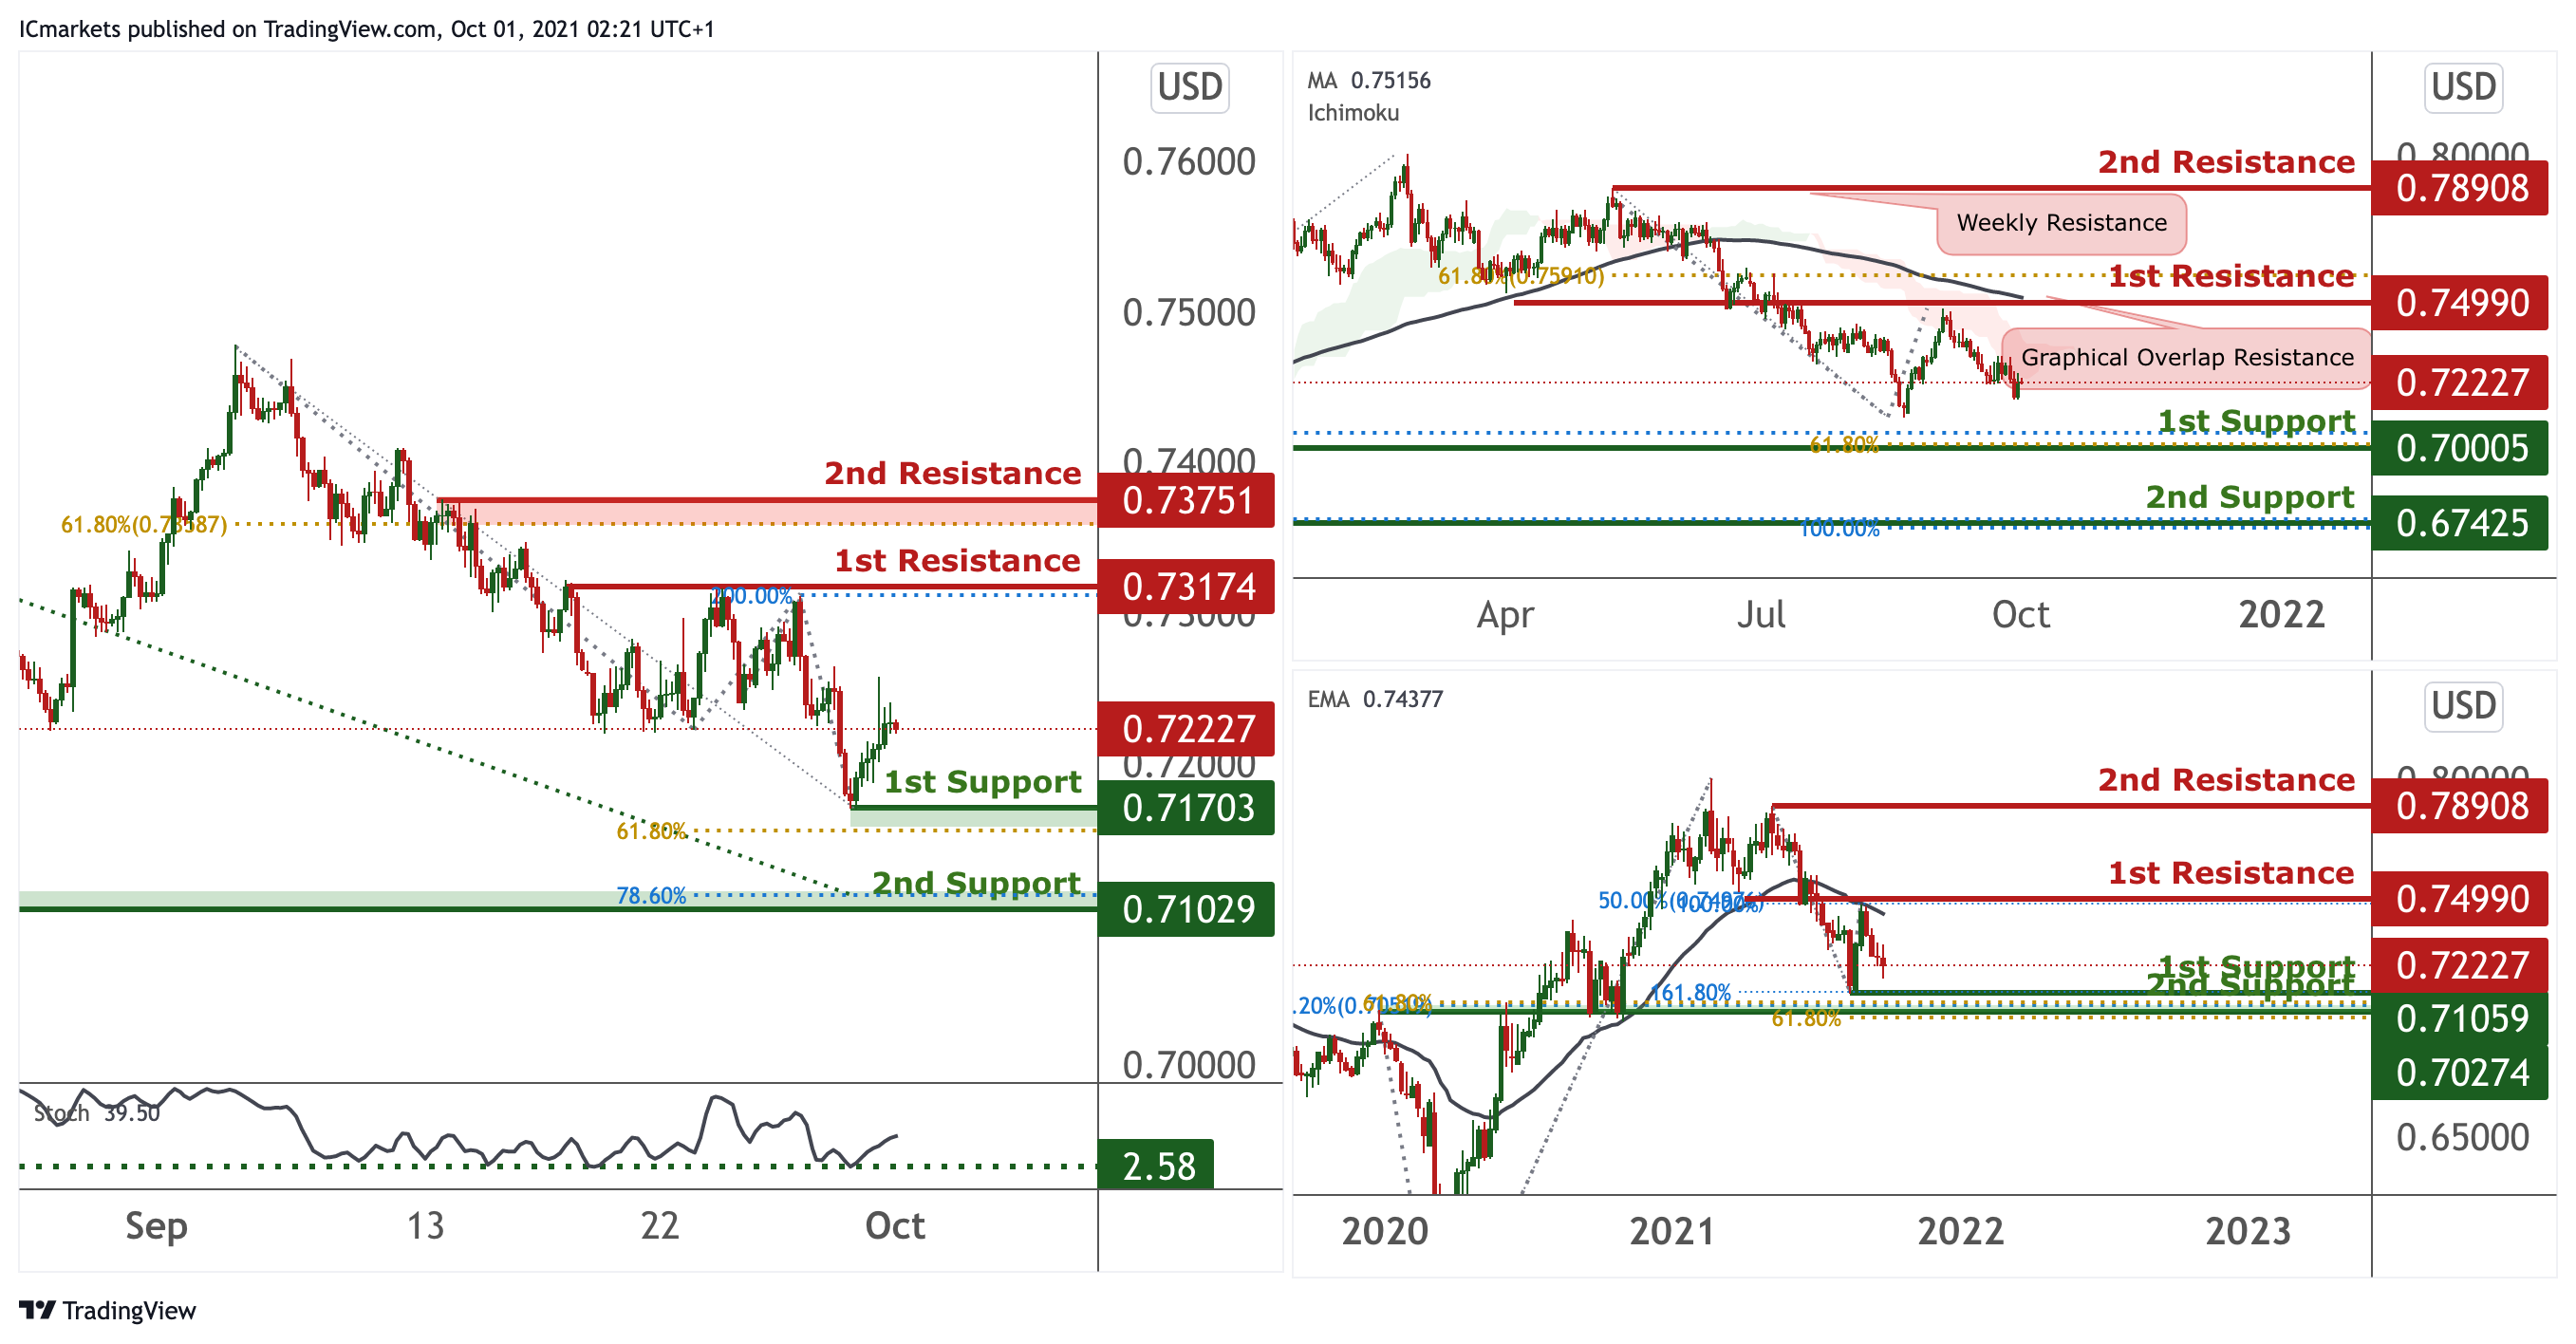
AUD/USD:
On the weekly, price is holding below the MA 130 showing bearish momentum, price is expected to push towards the first support in line with the 161.8% Fibonacci Projection level and previous swing low. On the Daily, the price is holding below EMA 34 showing a potential bearish momentum, price bounced off from the 1st support previously in line with the 161.8% Fibonacci projection and now looking for a pull back, back to the 1st Support level. Our bearish bias is further supported by the price holding below the Ichimoku cloud.
On the H4, price is seen to have broken off the descending trendline resistance turned support. Price has bounced on the 1st support, we are expecting price to be bullish and hence, push to the 1st Resistance level in line with 200% Fibonacci projection. Our short term bullish bias is further supported by the stochastic indicator %K line where it bounces off the support .
Areas of consideration:
- H4 1st resistance level 0.73174
- H4 1st support level 0.71703
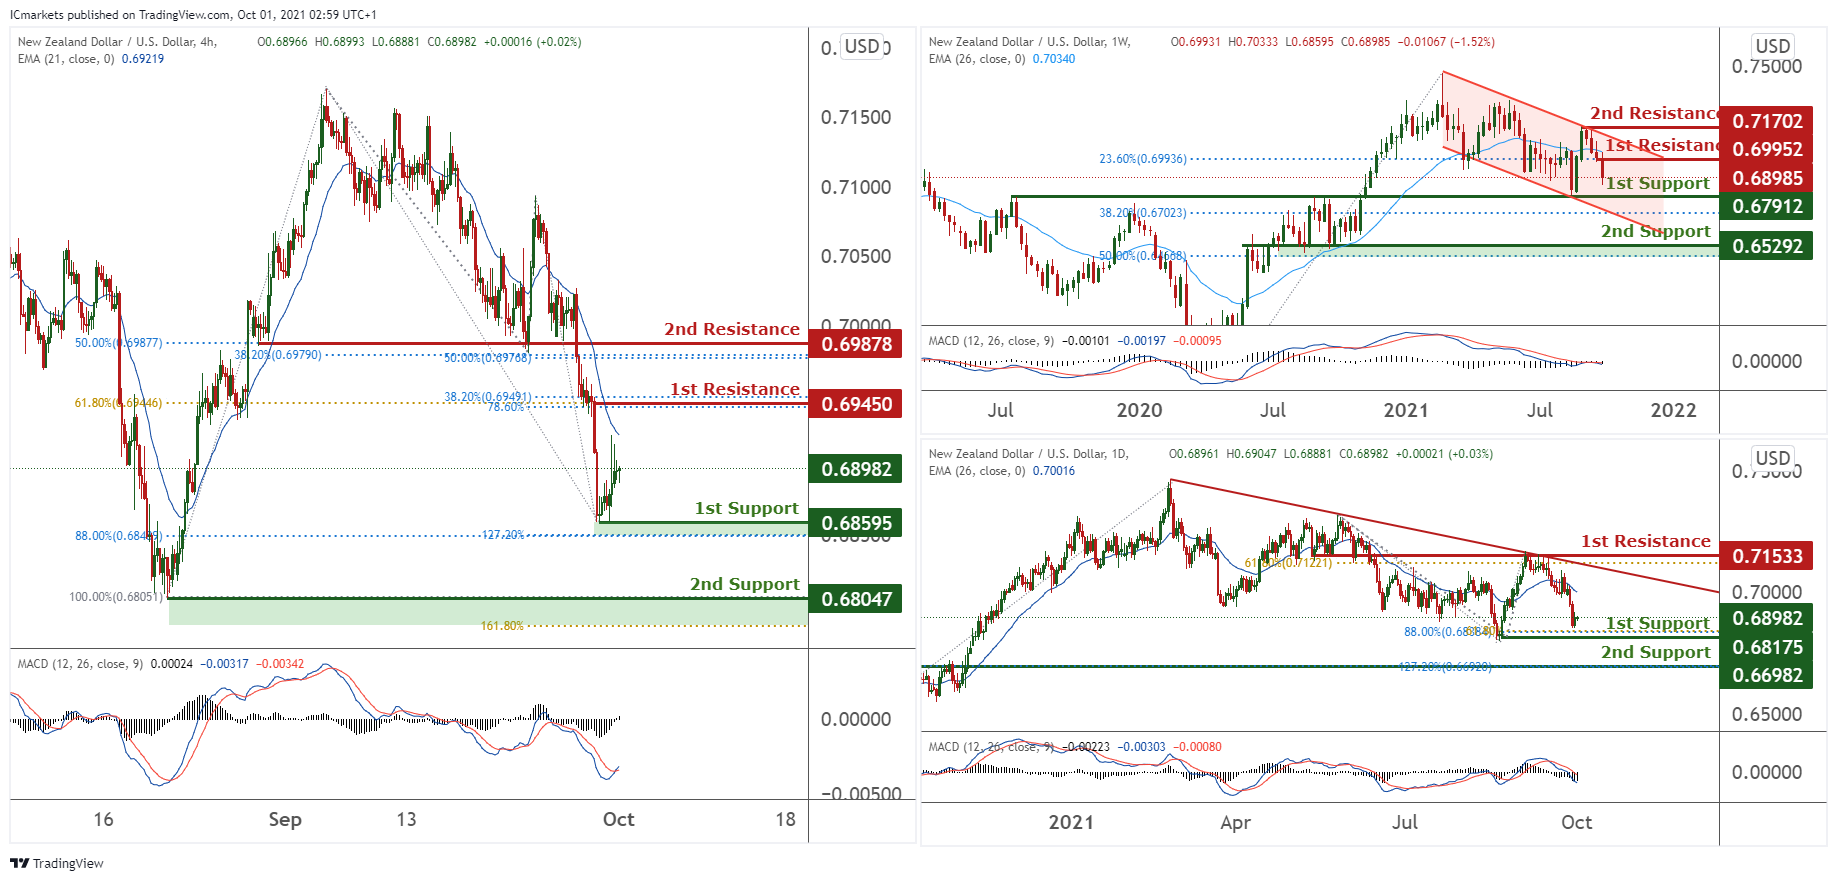
NZD/USD:
On the weekly, price is on a bearish momentum and is dipping towards 1st support at 0.68000 in line with 100% Fibonacci extension. Swing traders may potentially enter with shorts as we see potentially a bearish momentum in line with the descending trendline. MacD is also showing potential bearish momentum. Alternatively, price may climb towards our 1st resistance at 0.71760, in-line with 50% Fibonacci retracement, 100% Fibonacci extension, and descending trendline.
On the Daily chart, price is experiencing bearish momentum and is likely to dip toward our 1st support at 0.68175 in line with 88% Fibonacci retracement and 61.8% Fibonacci extension. Technical indicators are showing bearish momentum. Breaking our 1st support will find prices dipping further towards our 2nd support at 0.66982 in line with 127.2% Fibonacci extension and 38.2% Fibonacci retracement.
On the H4 timeframe, price has recently bounced off our 1st support at 0.68595 in line with 88.0% Fibonacci retracement and 127.2% Fibonacci extension. We foresee the potential of prices climbing towards our 1st resistance at 0.69450 in line with 61.8%, 38.2% and 78.6% Fibonacci retracement. Technical indicators are showing potential for trend reversal. Alternatively, prices could retest our 1st support again.
Areas of consideration:
- H4 time frame, 1st resistance at 69450
- H4 time frame, 1st support at 0.68595
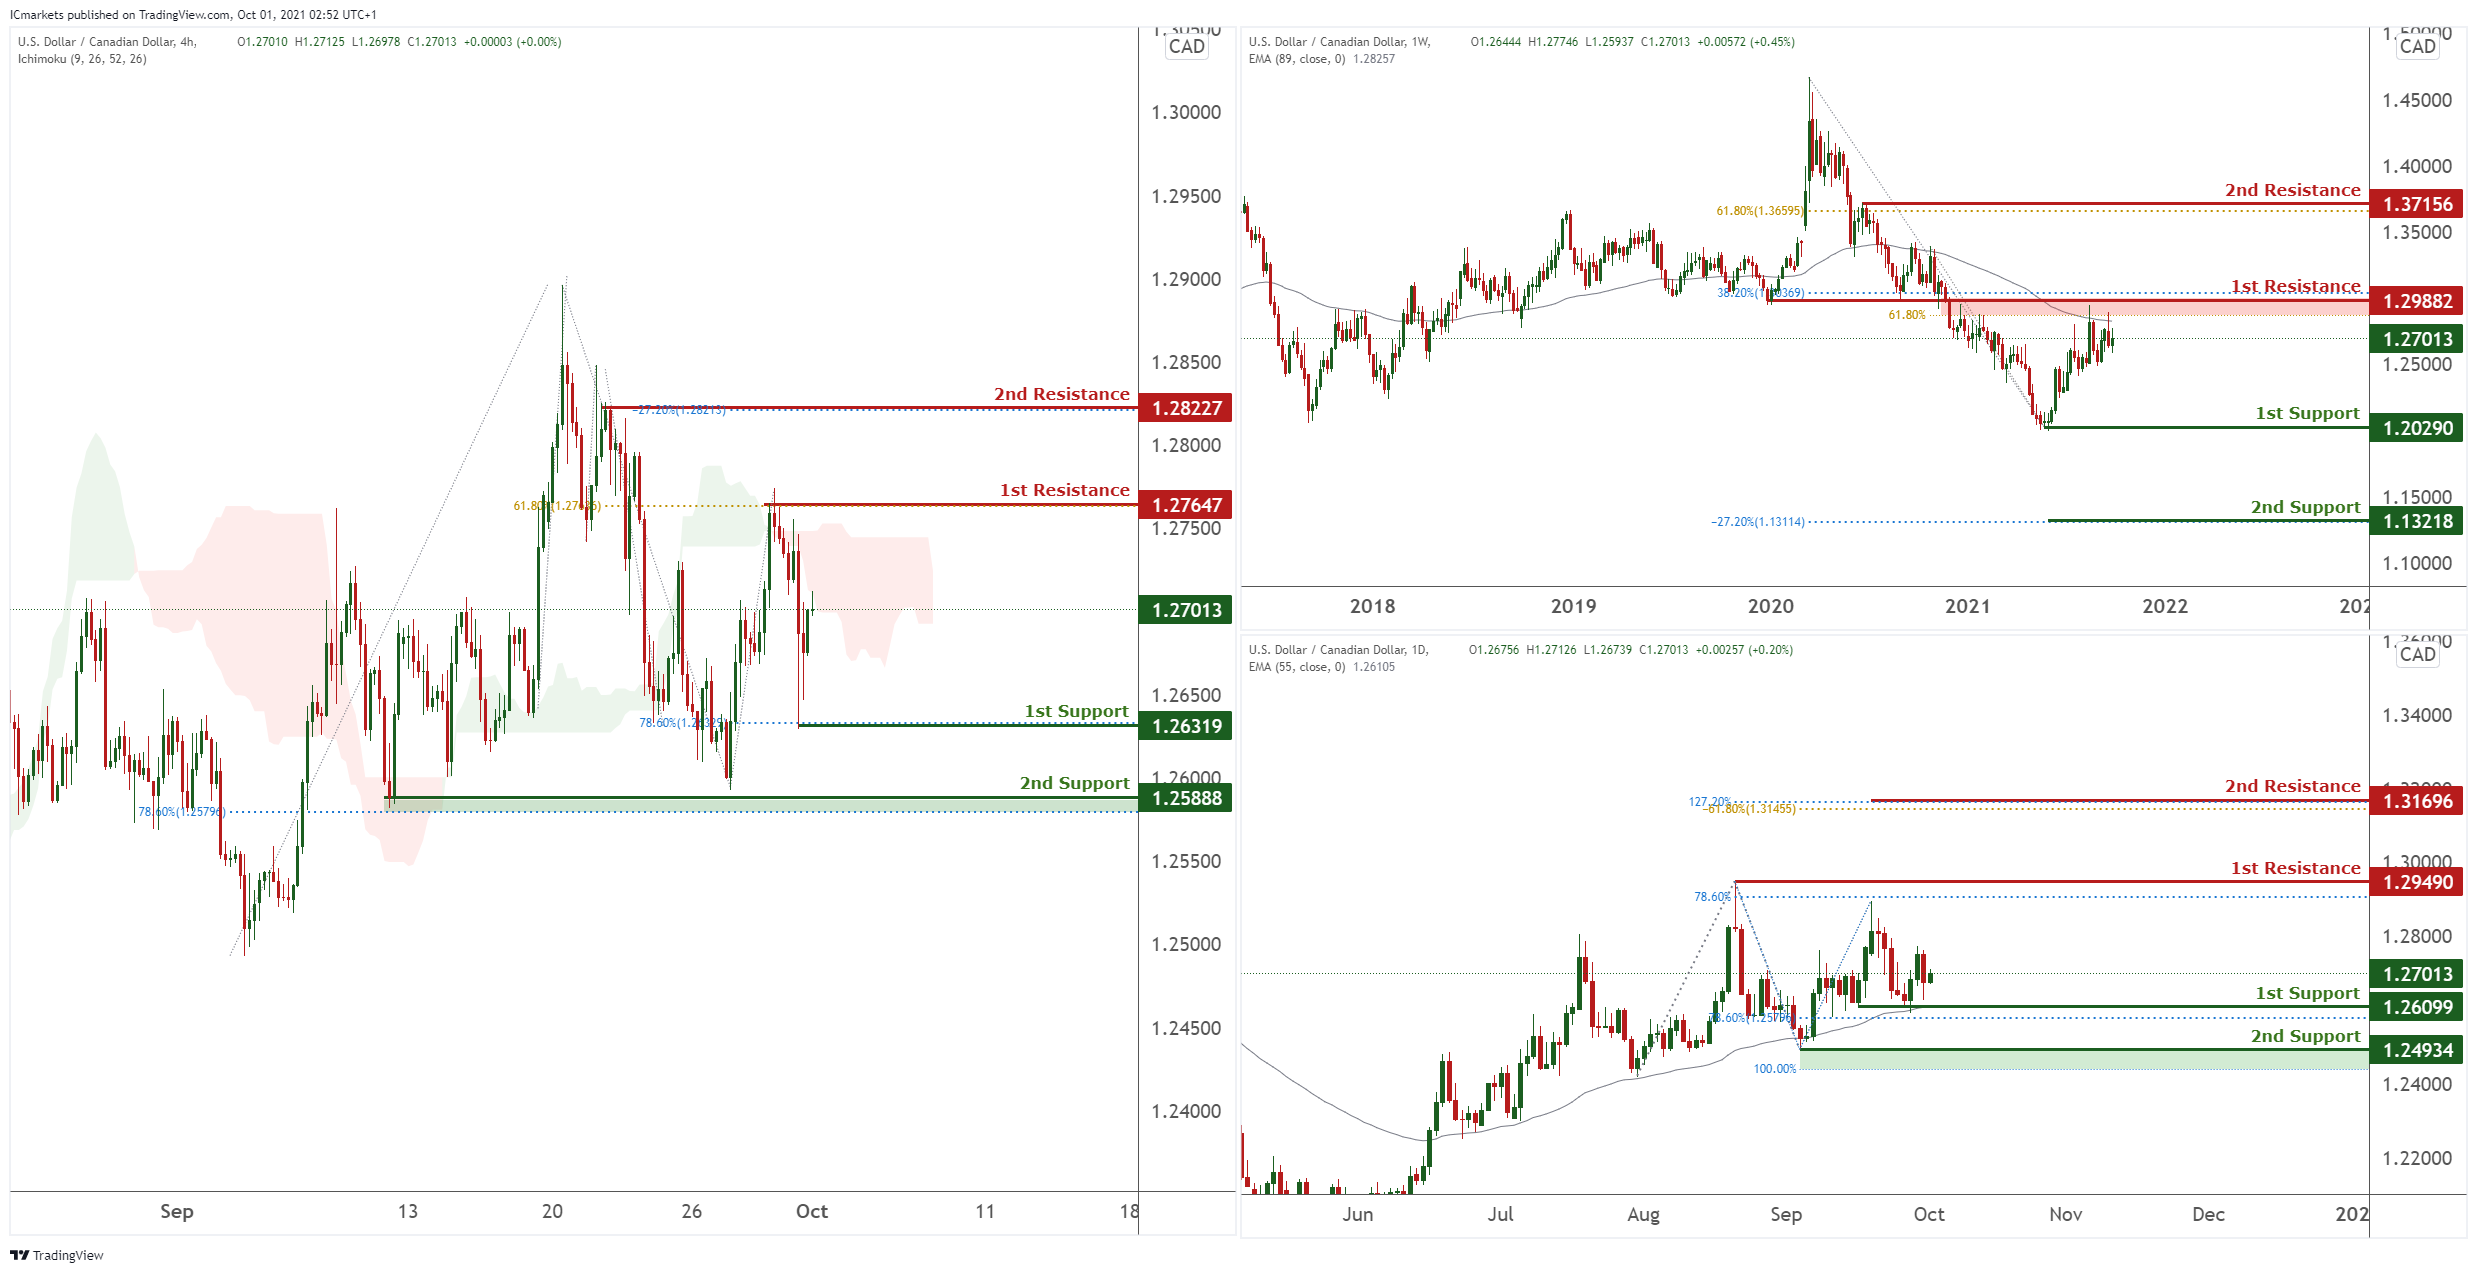
USD/CAD:
On the Weekly timeframe, price tested and reacted below long term moving average and also both 38.2% and 61.8% Fibonacci retracement level at 1.29882. As long as the price is holding below this level, we could potentially see the price facing further bearish pressure in the long term or at least to 1st support at 1.2029.
On the Daily, price bounced nicely above 1st Support at 1.26099 where further bullish momentum could be possible. With price holding above moving average, a possibility of renewed bullish pressure should price break higher than 1st resistance. Otherwise, price may push lower towards 2nd support at 1.24934.
On the H4, with stochastic testing resistance where price dropped in the past along with the current price’s respect of the trend line, a second retest and short term drop towards 1st support at 1.26319 and possibly even breaking structure to 2nd support at 1.25888 could be possible. Otherwise, breaking above 1st resistance will see price rise higher towards 2nd resistance at 1.27647.
Areas of consideration:
- H4 time frame, support at 1.26319
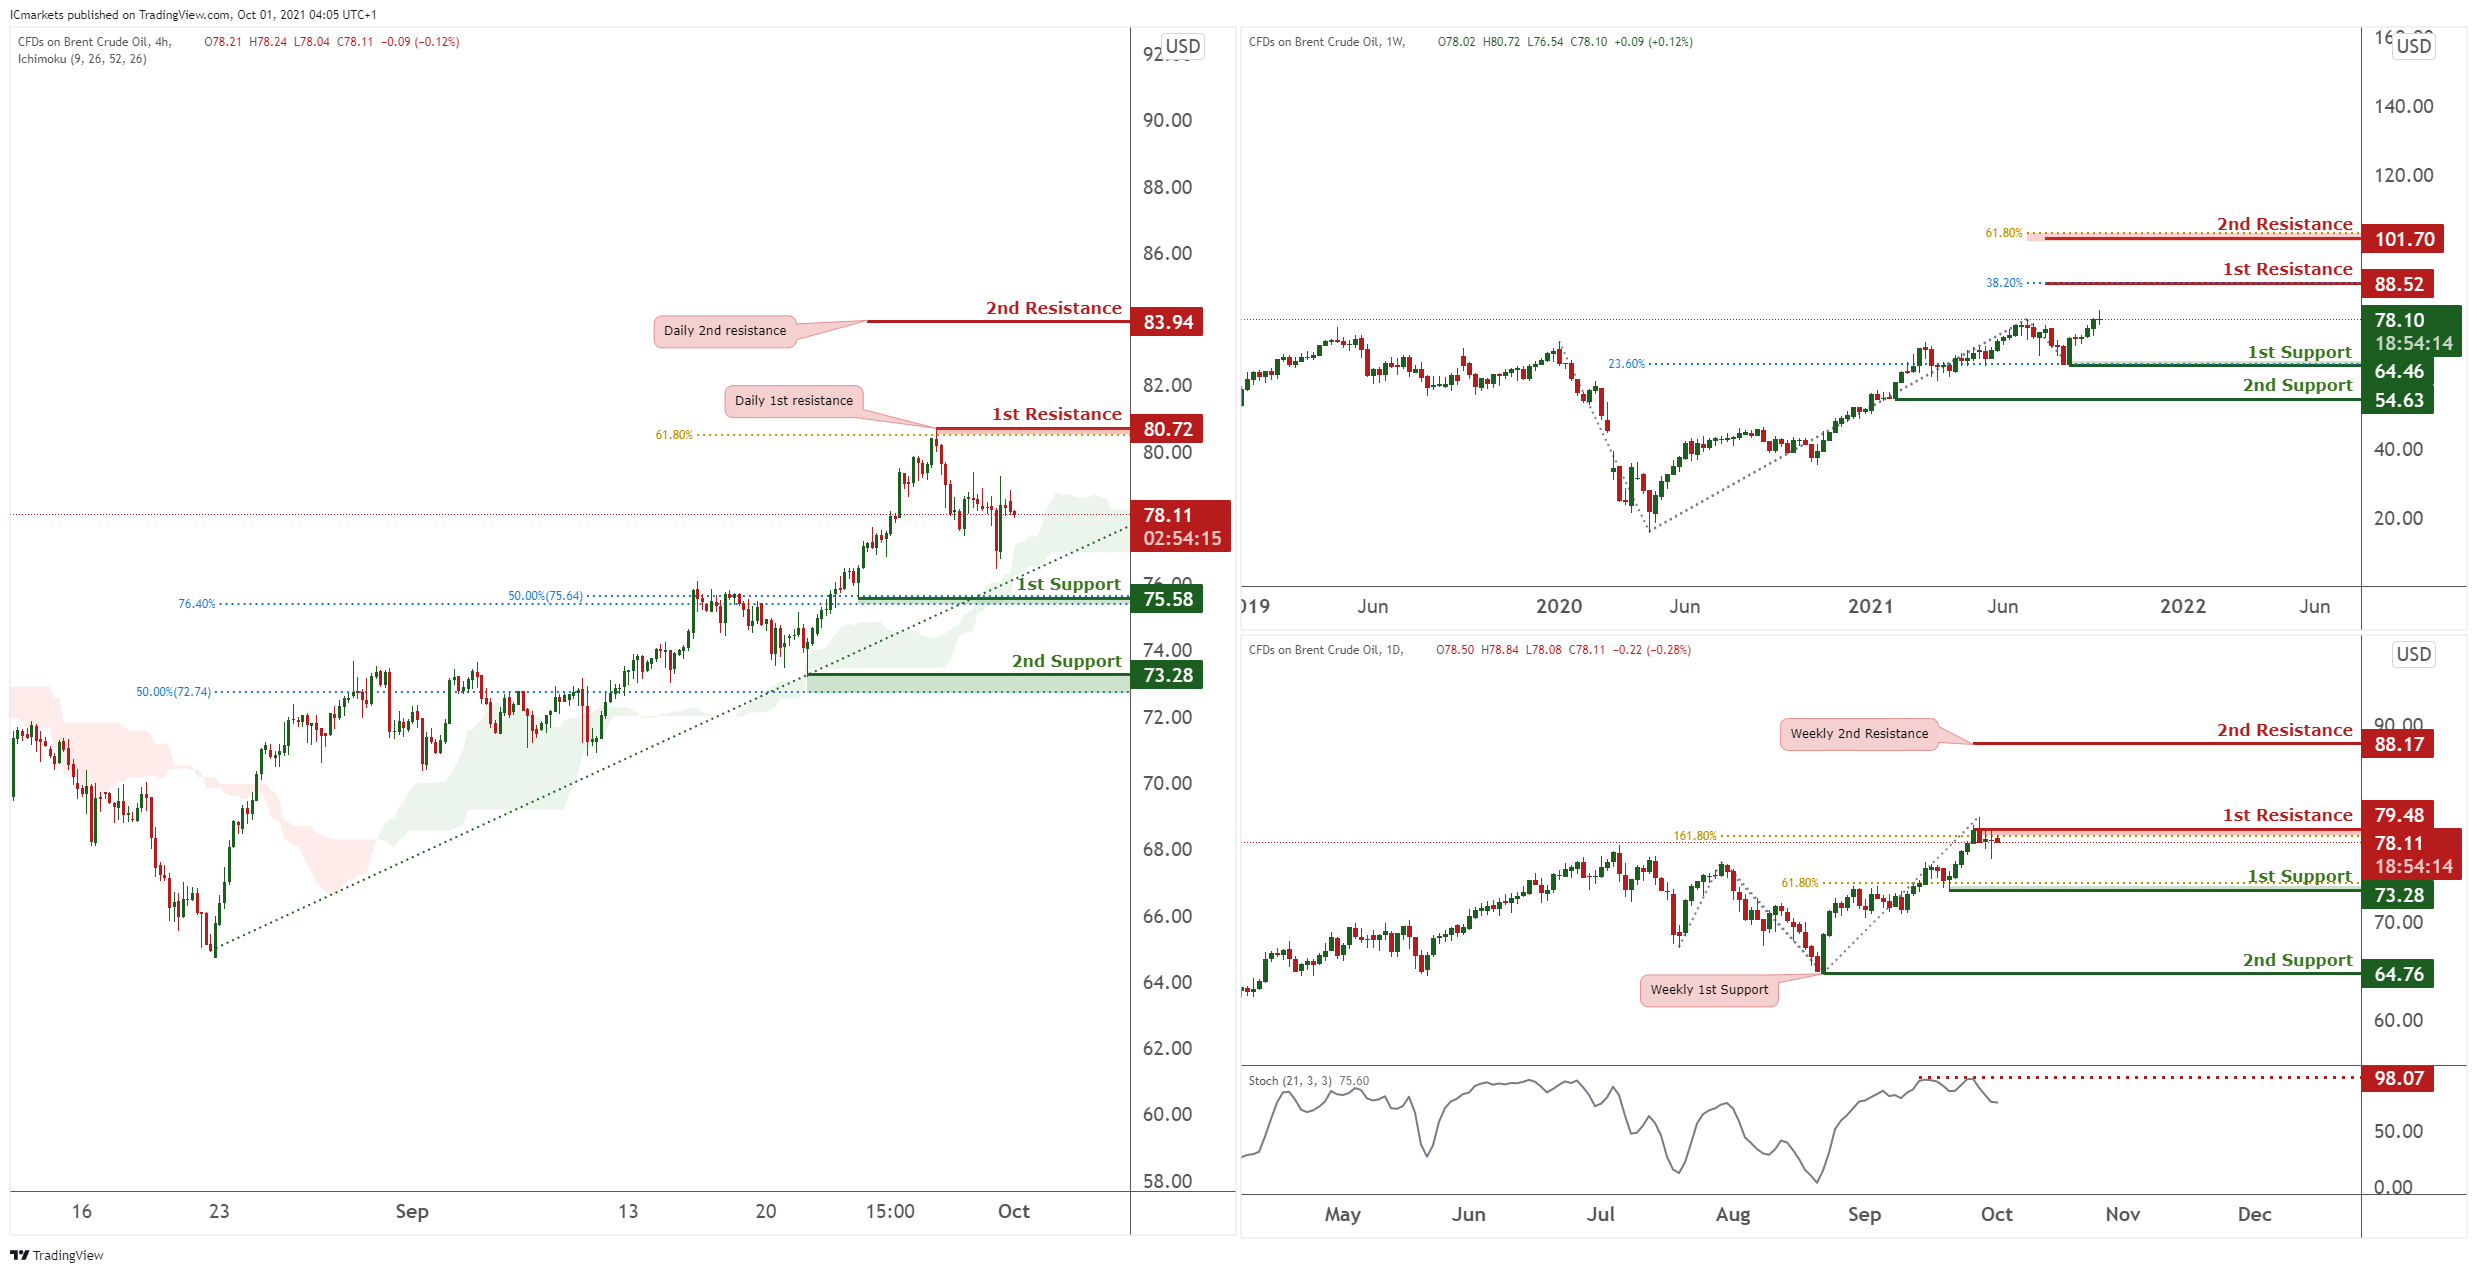
OIL:
On Weekly timeframe, we see that price is below the 1st resistance at 88.52 in line with Horizontal swing high and 38.2% Fibonacci extension and may brearish towards the 1st support at 64.46 in line with 61.8% fibonacci retracement and 23.6% fibonacci extension. Our bearish bias is further supported by RSI approaching resistance where price dropped in the past. Otherwise price may bullish towards 1st resistance at 88.52 in line with Horizontal swing high and 38.2% Fibonacci extension.
On the Daily timeframe, price is below 1st resistance at 80.72 in line with horizontal swing high and 161.8% fibonacci extension and may bearish to 1st support at 73.28 in line with 38.2% Fibonacci retracement and 61.8% fibonacci extension. Our bearish view is further supported by how Stochastic is testing resistance where price dropped in the past. Otherwise price may bullish towards the 2nd resistance at 84.95 in line with -27.2% Fibonacci retracement and 200% Fibonacci extension.
Lastly, on the H4 timeframe, with the ichimok indicating further bullish movement, price may be headed to 1st resistance at 80.72 in line with our Daily 1st resistance and may break structure and head for the 2nd resistance at 83.94 which is also the 2nd resistance for the daily chart. Otherwise, pport at 75.58 in line 50% Fibonacci retracement and 76.4% Fibonacci extension. Our bearish view is further supported by MACD is showing a bearish signal with the signal line is above the MACD line. Otherwise price may bullish towards 2nd resistance at 83.94 in line with -27.2% Fibonacci retracement and 100% Fibonacci extension.
Areas of consideration:
- H4 time frame, 1st resistance of 80.72
- H4 time frame, 1st support of 75.58
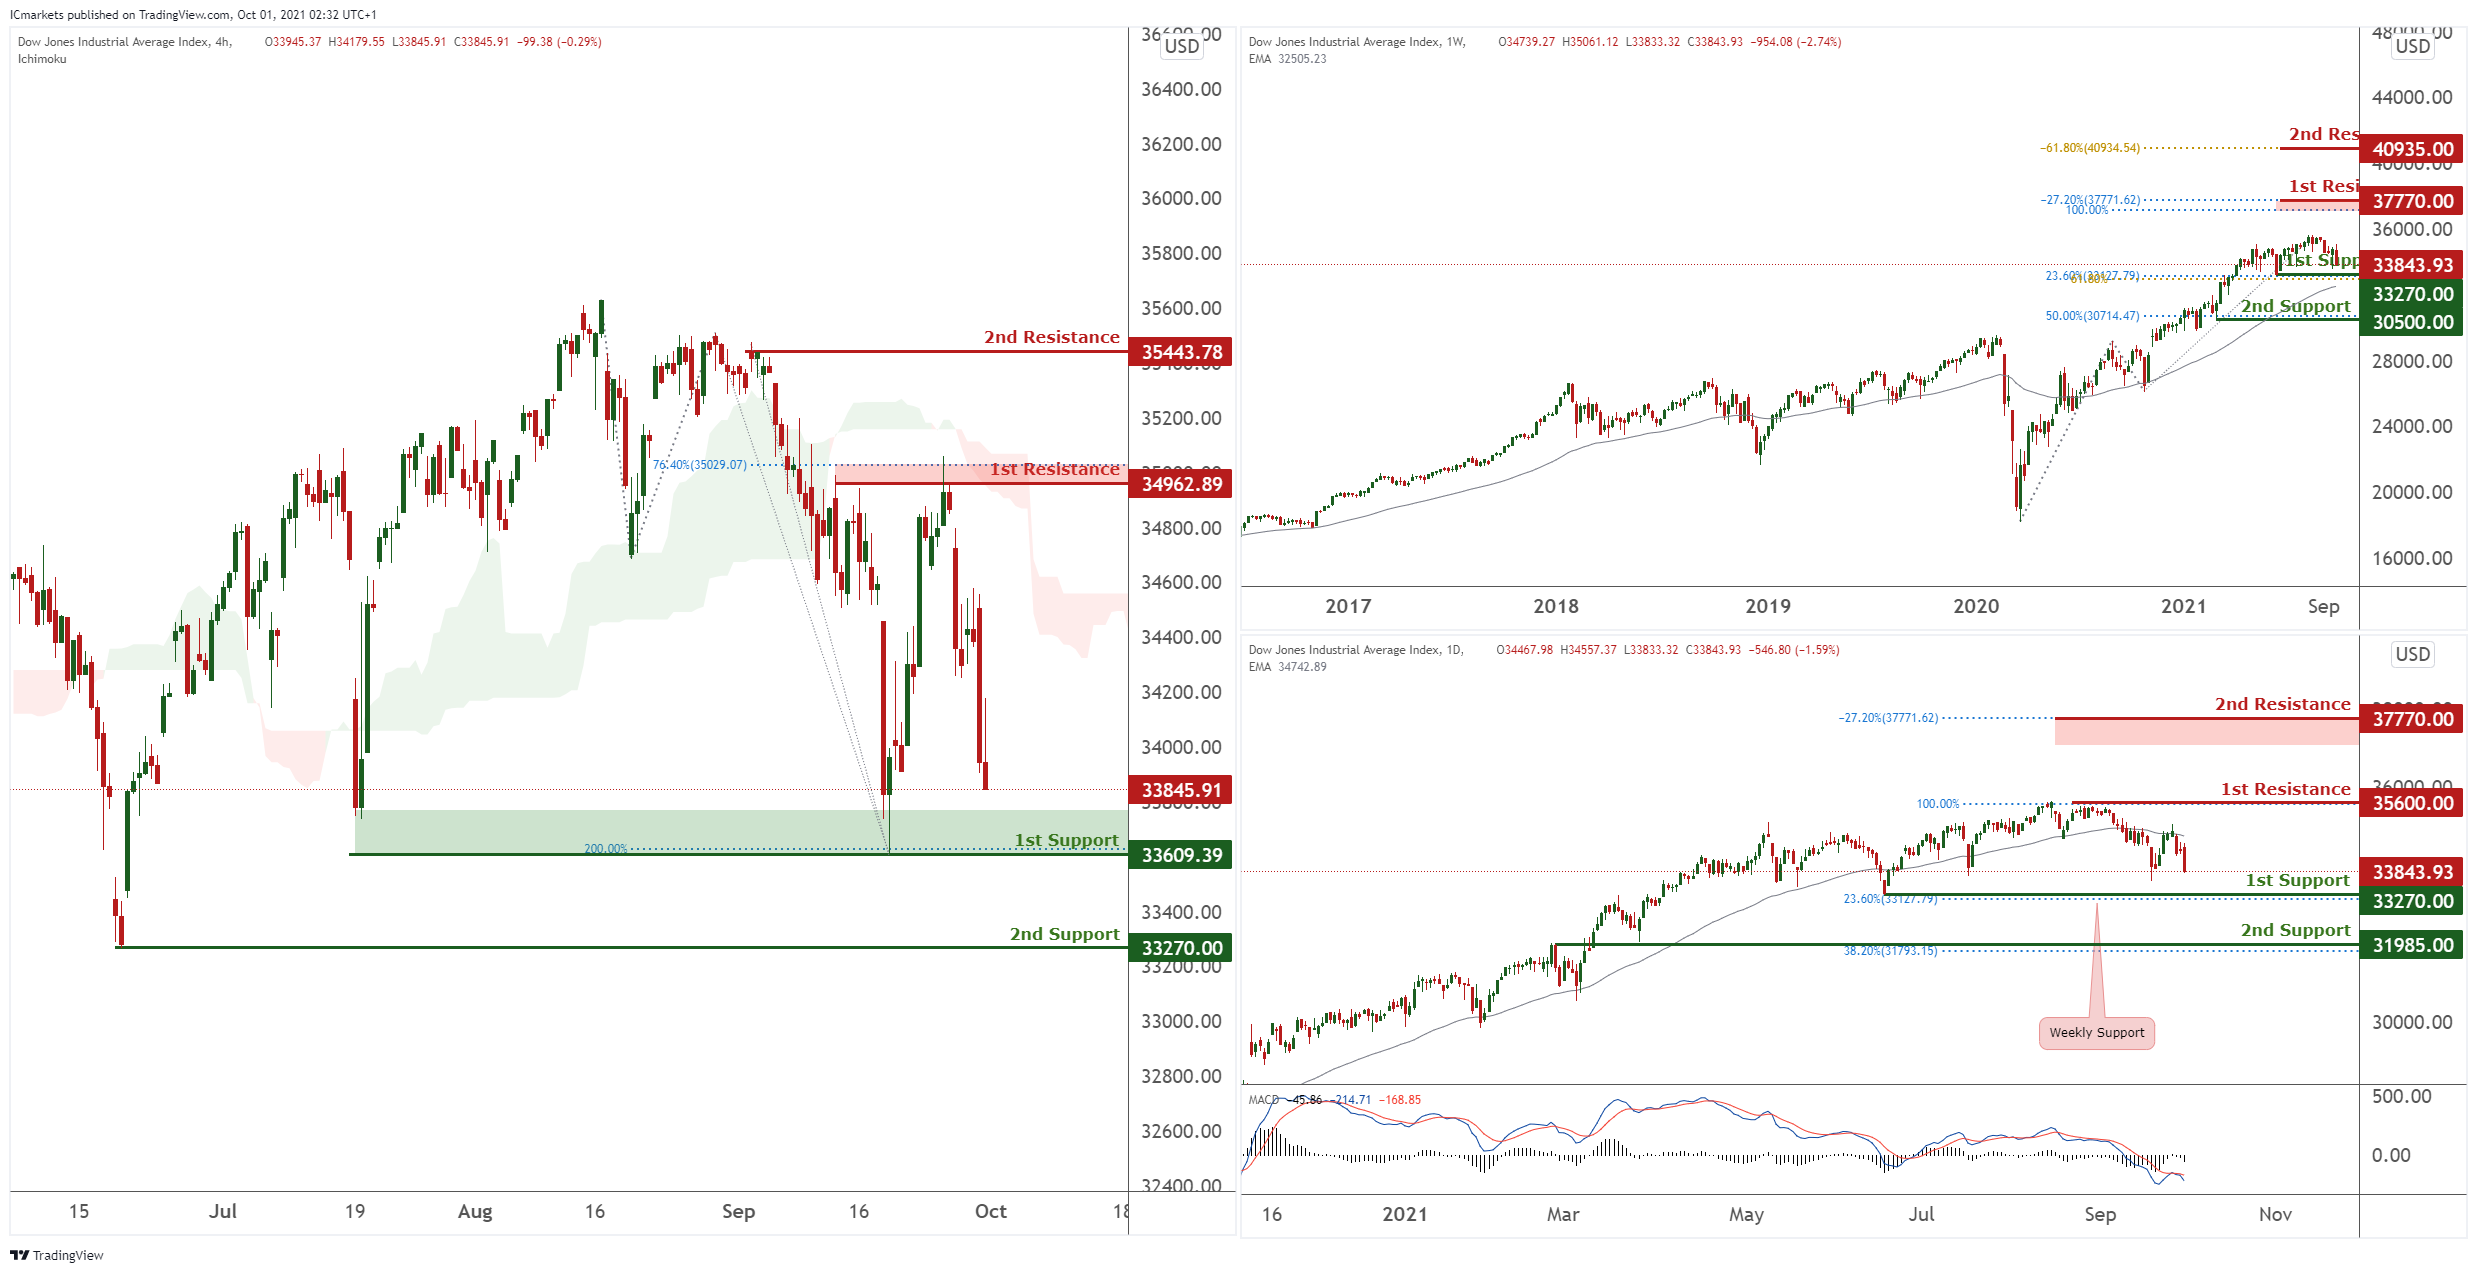
Dow Jones Industrial Average:
On the Weekly, price has been trading sideways between our 1st resistance at 37770 and 1st support at 35610.57. As there are no good risk reward levels, we prefer to remain neutral at this current juncture.
On the Daily chart, similar to the weekly, price is now trading between 1st resistance at 35600 and 1st support at 33270. With technical indicators showing room for further bearish momentum, a limited drop towards 1st support could be likely. Price may even break 1st support and drop towards 2nd support at 31985. Otherwise, breaking above 1st resistance will see price rise further towards 2nd resistance at 37770.
On the H4, with the ichimoku indicating further bearish movements, price pulled lower and is now reapproaching key 200% Fibonacci level at 1st support of 23609 where a second bounce reaction could be possible, with buyers looking at 1st resistance at 34962 as a potential upside target. Otherwise, breaking 1st resistance will see price drop lower towards 2nd support at 35443.
Areas of consideration:
- 4H support at 33609
The accuracy, completeness and timeliness of the information contained on this site cannot be guaranteed. IC Markets does not warranty, guarantee or make any representations, or assume any liability regarding financial results based on the use of the information in the site.
News, views, opinions, recommendations and other information obtained from sources outside of www.icmarkets.com.au, used in this site are believed to be reliable, but we cannot guarantee their accuracy or completeness. All such information is subject to change at any time without notice. IC Markets assumes no responsibility for the content of any linked site.
The fact that such links may exist does not indicate approval or endorsement of any material contained on any linked site. IC Markets is not liable for any harm caused by the transmission, through accessing the services or information on this site, of a computer virus, or other computer code or programming device that might be used to access, delete, damage, disable, disrupt or otherwise impede in any manner, the operation of the site or of any user’s software, hardware, data or property.


