
Key risk events today:
US ISM Manufacturing PMI.
(Previous analysis as well as outside sources – italics).
EUR/USD:
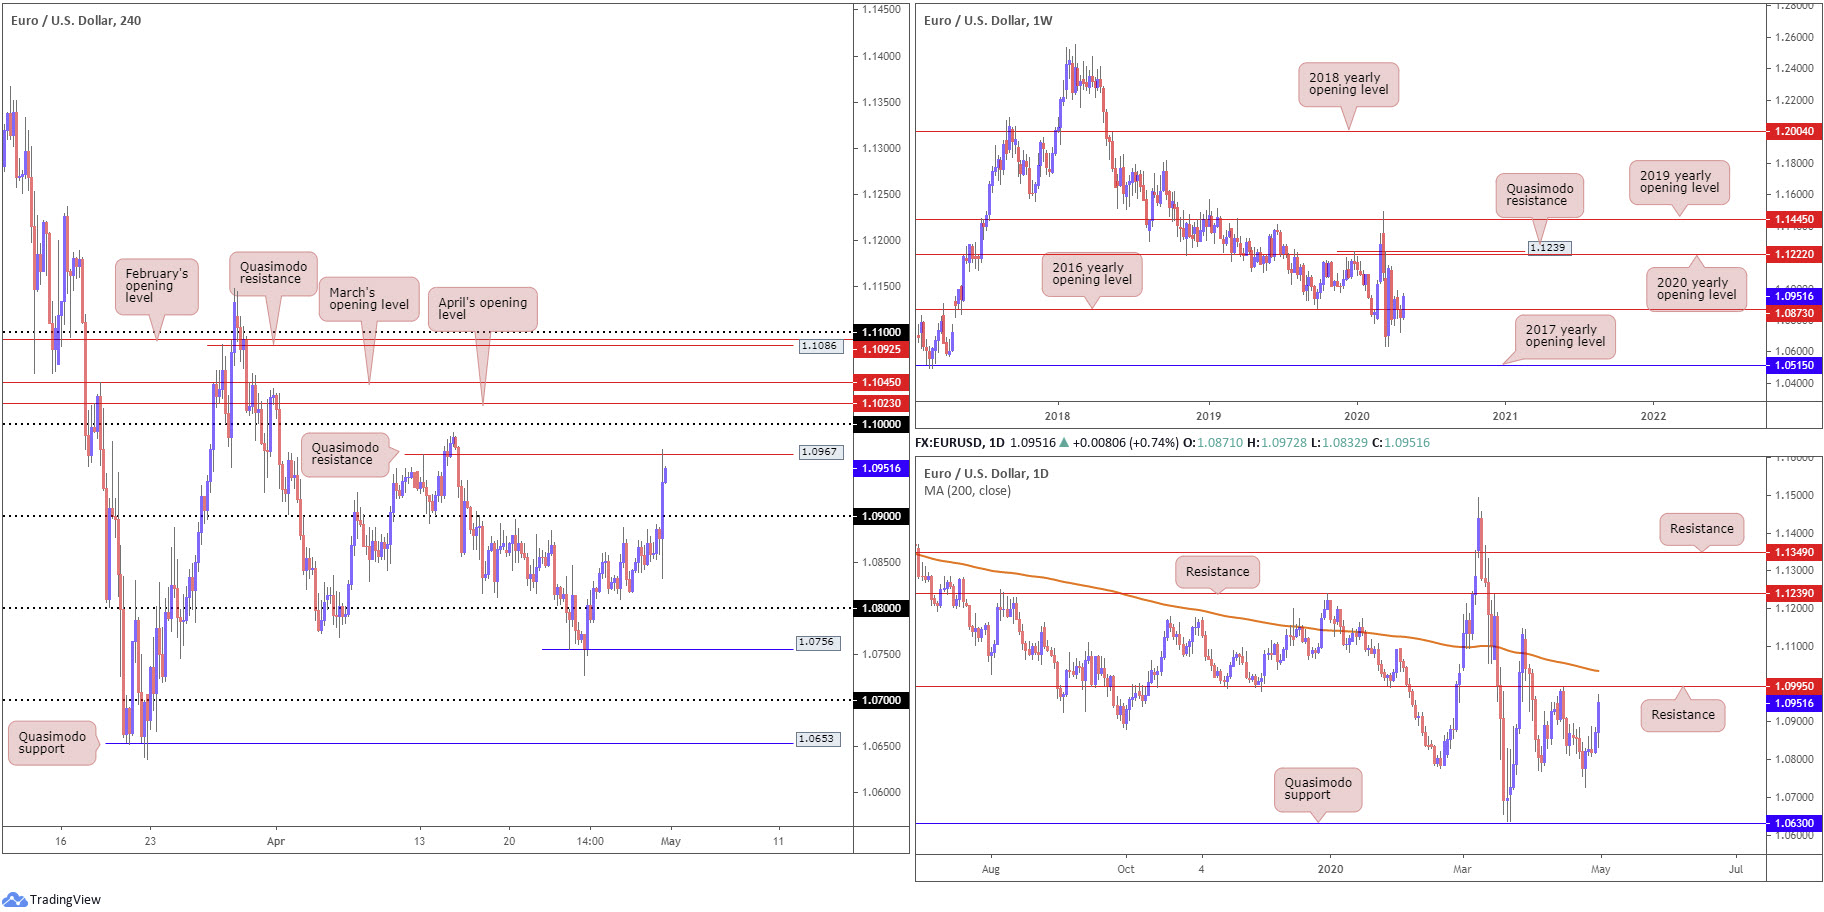
Despite a knee-jerk reaction to lows at 1.0833, after the ECB fell on the dovish side of the fence, EUR/USD swiftly reclaimed 1.09+ status, tackling H4 Quasimodo resistance at 1.0967 into the closing stages of Thursday’s session.
In addition to the ECB, more weak data out of the US was observed in the form of unemployment claims and disturbing survey news: Chicago PMI. The US Federal Reserve also announced it is expanding the scope and eligibility for the Main Street Lending Program[1].
As of writing, EUR/USD trades 0.70% in the green. H4 Quasimodo resistance mentioned above at 1.0967 is currently in play, with a break revealing the key figure 1.10, followed by April’s opening level at 1.1023 and March’s opening level at 1.1045.
Across the page on the weekly timeframe, the 2016 yearly opening level at 1.0873 came under fire. As a result of this, upside targets now fall in at the 2017 yearly opening level from 1.1222 and a Quasimodo resistance at 1.1239. Daily flow, on the other hand, is seen closing in on resistance drawn from 1.0995, closely tailed by the 200-day SMA (orange – 1.1035).
Areas of consideration:
Although the H4 Quasimodo at 1.0967 holds firm, it’s unlikely we’re heading back to 1.09 from here, according to chart studies. 1.10 will likely act as a magnet to price, even more so knowing it joins closely with daily resistance formed at 1.0995.
As round numbers often attract whipsaws, a fakeout through 1.10 to March/April’s opening levels at 1.1045 and 1.1023, respectively, could also be in the offing. Note also these monthly opening levels merge with the 200-day SMA, therefore short sellers off 1.10 may look to locate protective stop-loss orders above 1.1045.
A decisive rotation off 1.10 could see 1.09 brought back into the fold, though do remain aware weekly price suggests we could eventually be heading for higher levels in this market.
GBP/USD:
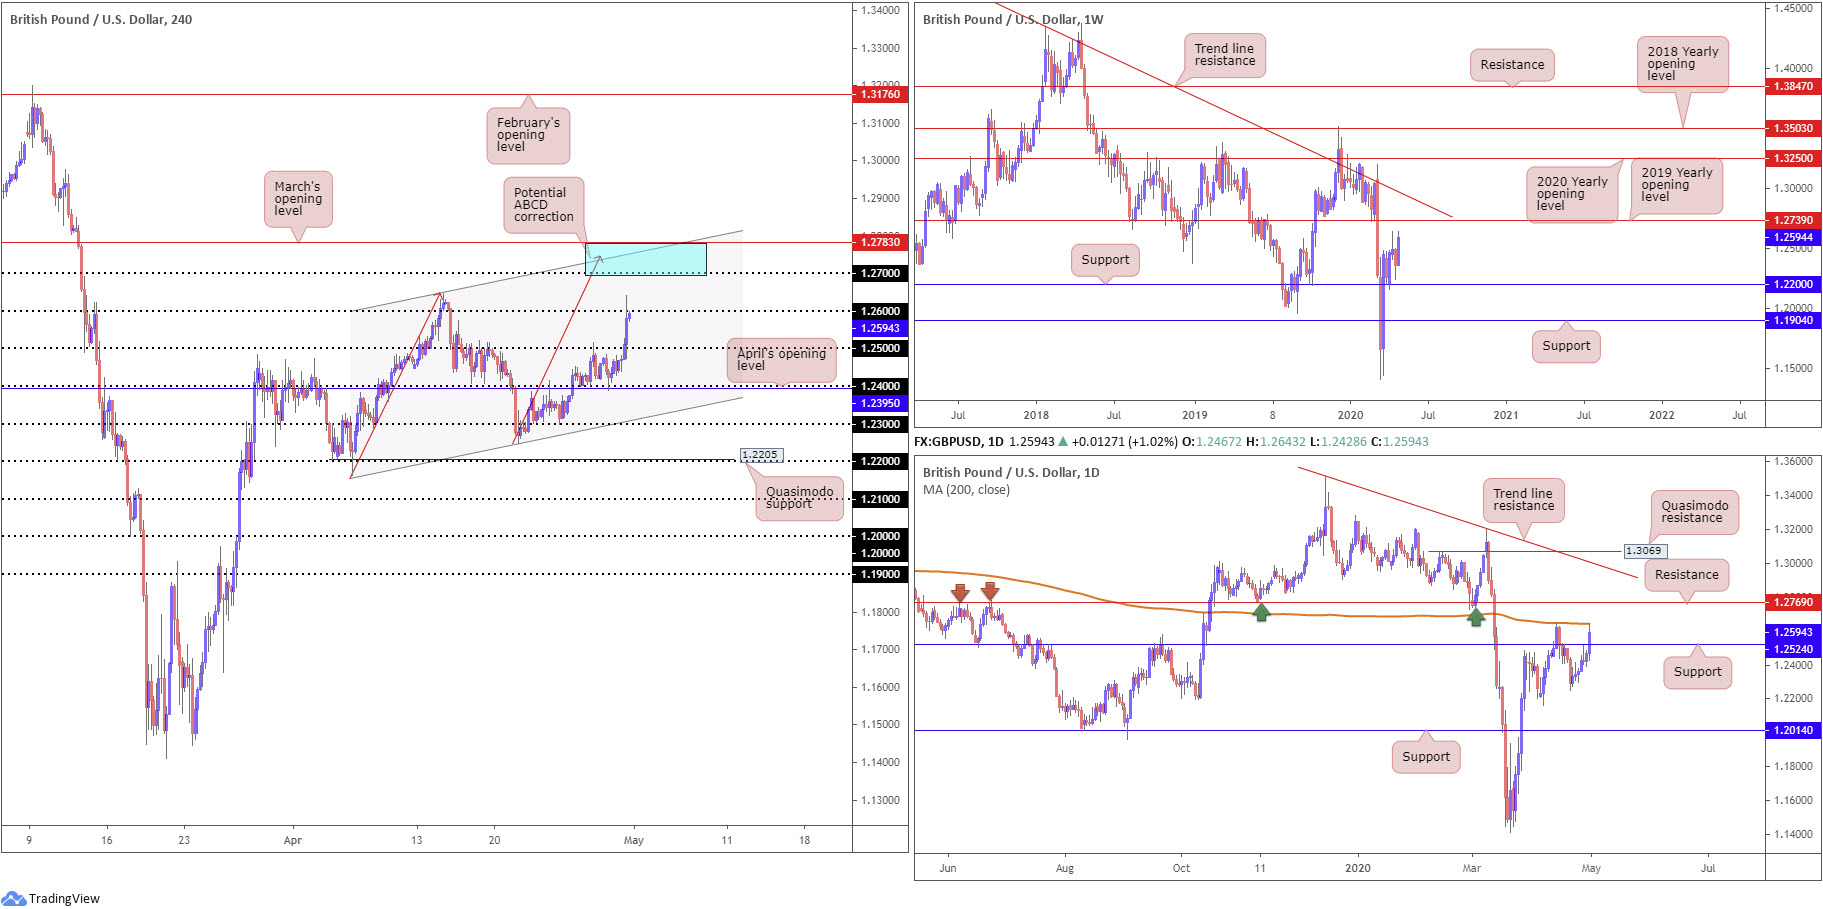
Following a string of downbeat data out of the US Thursday, sterling added more than 120 points. Price movement, based on the H4 timeframe, easily cleared the 1.25 handle, with the unit feeding into orders at 1.26 at the tail end of the session. Aside from the 1.2647 April 14 peak, the next port of call resides around 1.27, closely shadowed by a channel resistance, taken from the high 1.2647, and a potential ABCD correction (red arrows) at 1.2745.
Against the backdrop of intraday flow, price action on the daily timeframe drilled through resistance at 1.2524 (now a serving support) and came within two pips of connecting with the 200-day SMA (orange – 1.2644). Directly north of this value, traders may also want to acknowledge notable resistance coming in from 1.2769.
Chart studies on the weekly timeframe reveals the possibility of continued buying until reaching the 2019 yearly opening level at 1.2739, with a break exposing a long-standing trend line resistance, taken from the high 1.5930.
Areas of consideration:
The 200-day SMA value at 1.2644 may hamper further upside attempts, which may ignite selling off 1.26 on the H4 timeframe. This is, of course, one scenario.
A H4 close above 1.26, however, is interesting. Not only would this prompt breakout buying towards 1.27, the area marked in blue between 1.2783/1.27 (blue) also emphasises a strong reversal zone for potential shorting opportunities (comprised of March’s opening level at 1.2783, H4 channel resistance, a H4 ABCD formation, the 1.27 handle, weekly resistance [2019 yearly opening level] at 1.2739 and daily resistance from 1.2769).
AUD/USD:
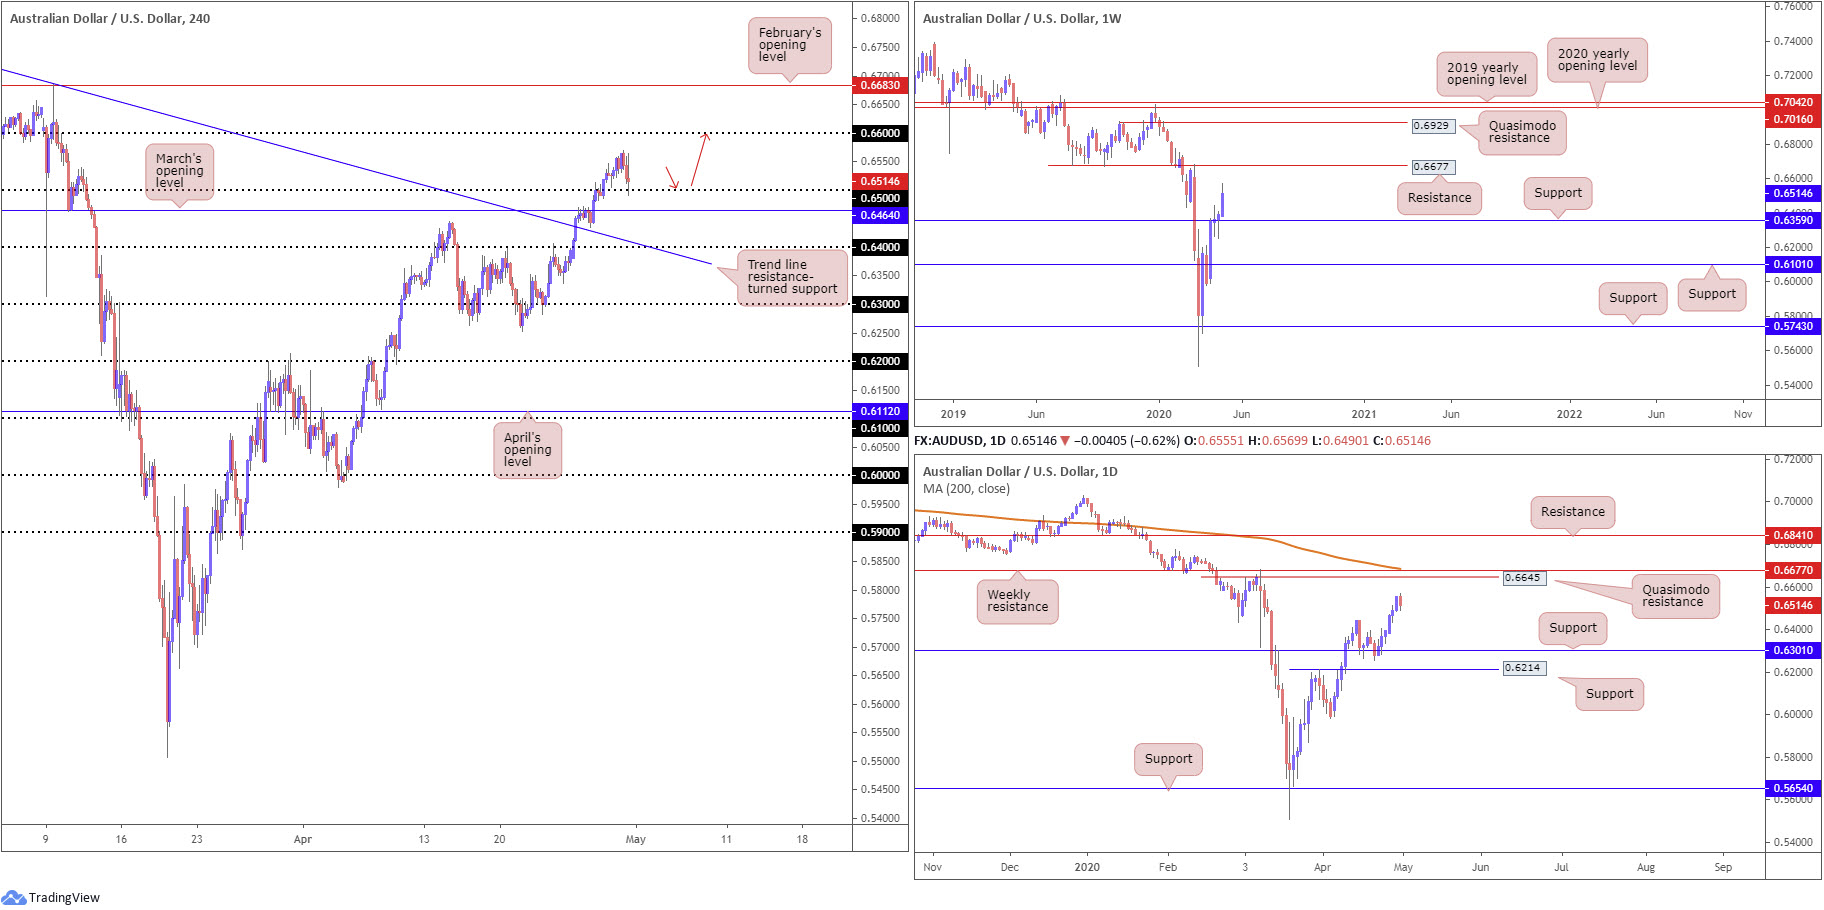
The Australian dollar snapped a six-day bullish phase against the buck Thursday, fading seven-week tops and revisiting 0.65 into the closing stages of the day. Aside from the possibility of resistance emerging off yesterday’s highs at 0.6569, the next upside target off 0.65 falls in at 0.66. South of 0.65, nevertheless, we have March’s opening level close by at 0.6464, followed by trend line resistance-turned support, extended from the high 0.7031.
Weekly support is seen at 0.6359 and remains a dominant fixture in this market, with scope to approach resistance based at 0.6677. Similarly, daily action remains on firm footing north of support at 0.6301, also displaying room to navigate higher ground to at least Quasimodo resistance at 0.6645, parked just ahead of the weekly resistance level mentioned above at 0.6677 and the 200-day SMA (orange – 0.6685).
Areas of consideration:
For those who read Thursday’s technical briefing you may recall the following piece (italics):
With 0.65 out of the picture as resistance, breakout buyers may already be long this market. However, conservative traders are still likely sitting on their hands waiting for a retest that may never come (unless of course you drilled down to the lower timeframes and caught the small M15 move).
As evident from the H4 timeframe this morning, 0.65 was retested in recent hours and is currently holding as support. A positive H4 close off this figure may entice buyers into the market today, with expectations of reaching 0.66, and quite possibly the higher timeframe resistances highlighted above.
USD/JPY:
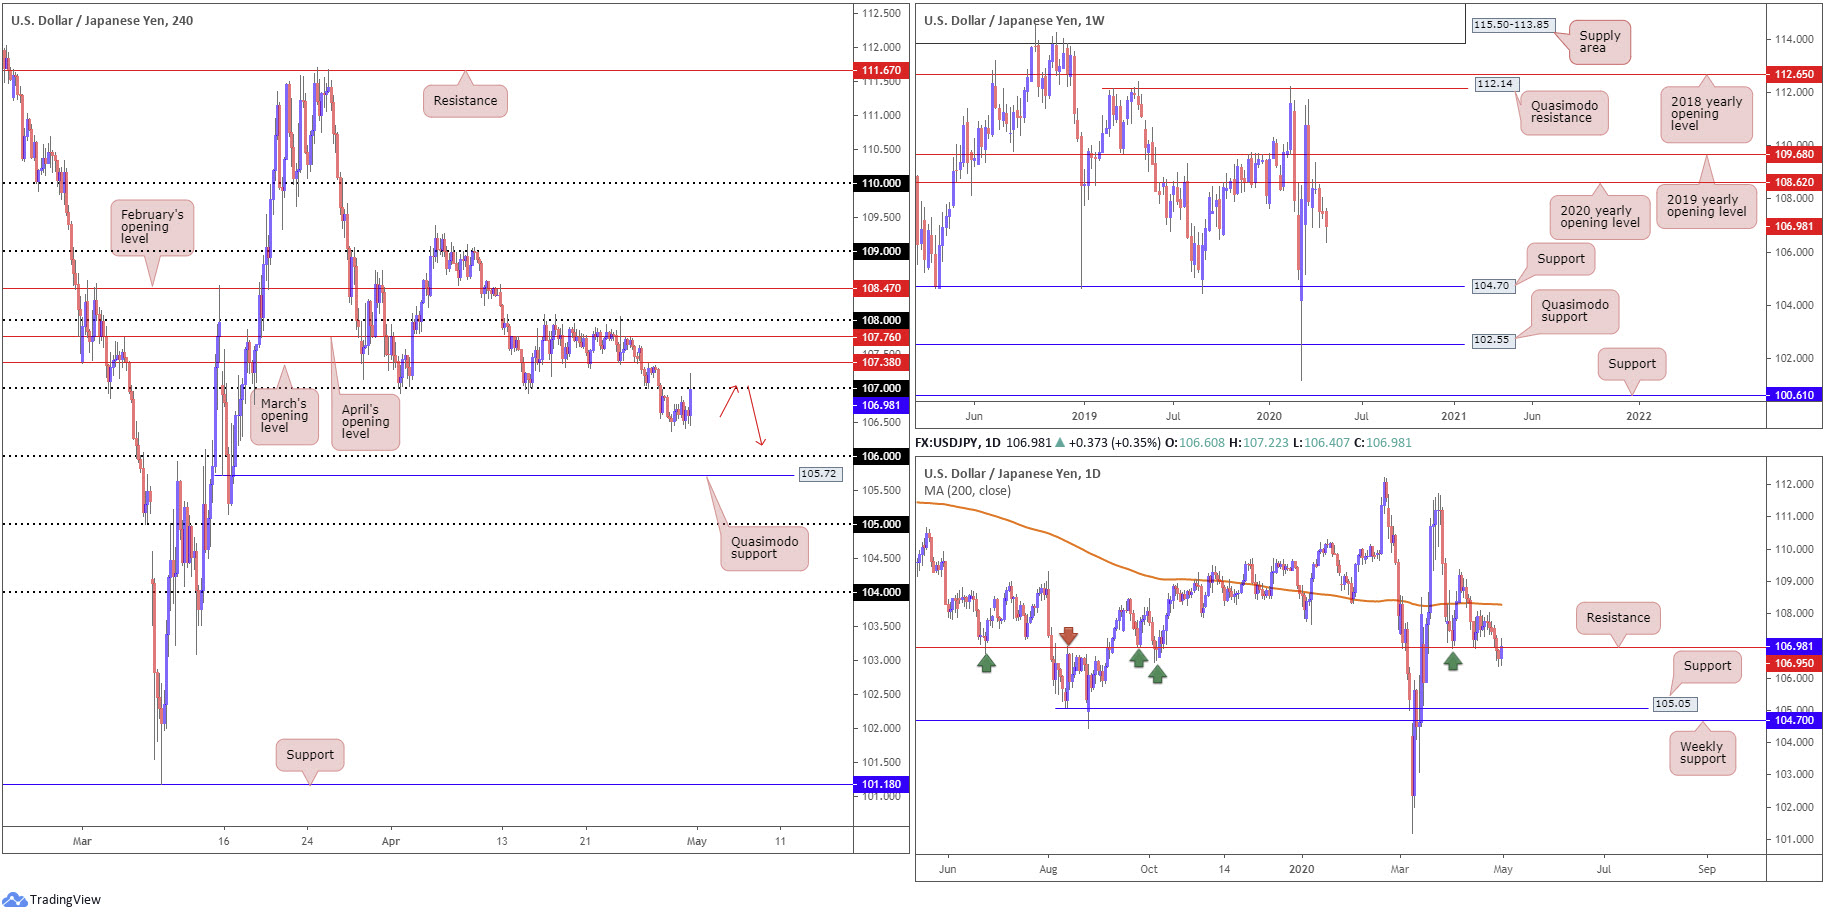
The US dollar advanced against the Japanese yen into the closing stages of the session Thursday, marginally surpassing the 107 handle and clocking highs at 107.21.
Daily support at 106.95, a level that was noted as perhaps a fragile base, ceded ground in recent movement and is, alongside the 107 handle on the H4, currently being retested as resistance. South of 106.95 could see an approach form to support at 105.05.
In terms of the weekly timeframe, nevertheless, the chart continues to emphasise a bearish tone. Price action recently produced a clear-cut shooting star candlestick configuration off the 2020 yearly opening level at 108.62, with a strong follow-through move to the downside to lows of 106.92 seen thereafter. This week, as you can see, is extending space sub 108.62, with support not expected to emerge until reaching 104.70.
Areas of consideration:
Room to explore lower ground on the weekly chart, along with daily price retesting 106.95, underscores a bearish theme off 107 today. Conservative traders may elect to wait and see if H4/H1 price forms a bearish candlestick signal before committing. Not only does this help identify seller intent, it provides structure to base entry/risk levels from.
Downside targets from 107 fall in at 106 and then H4 Quasimodo support at 105.72.
USD/CAD:
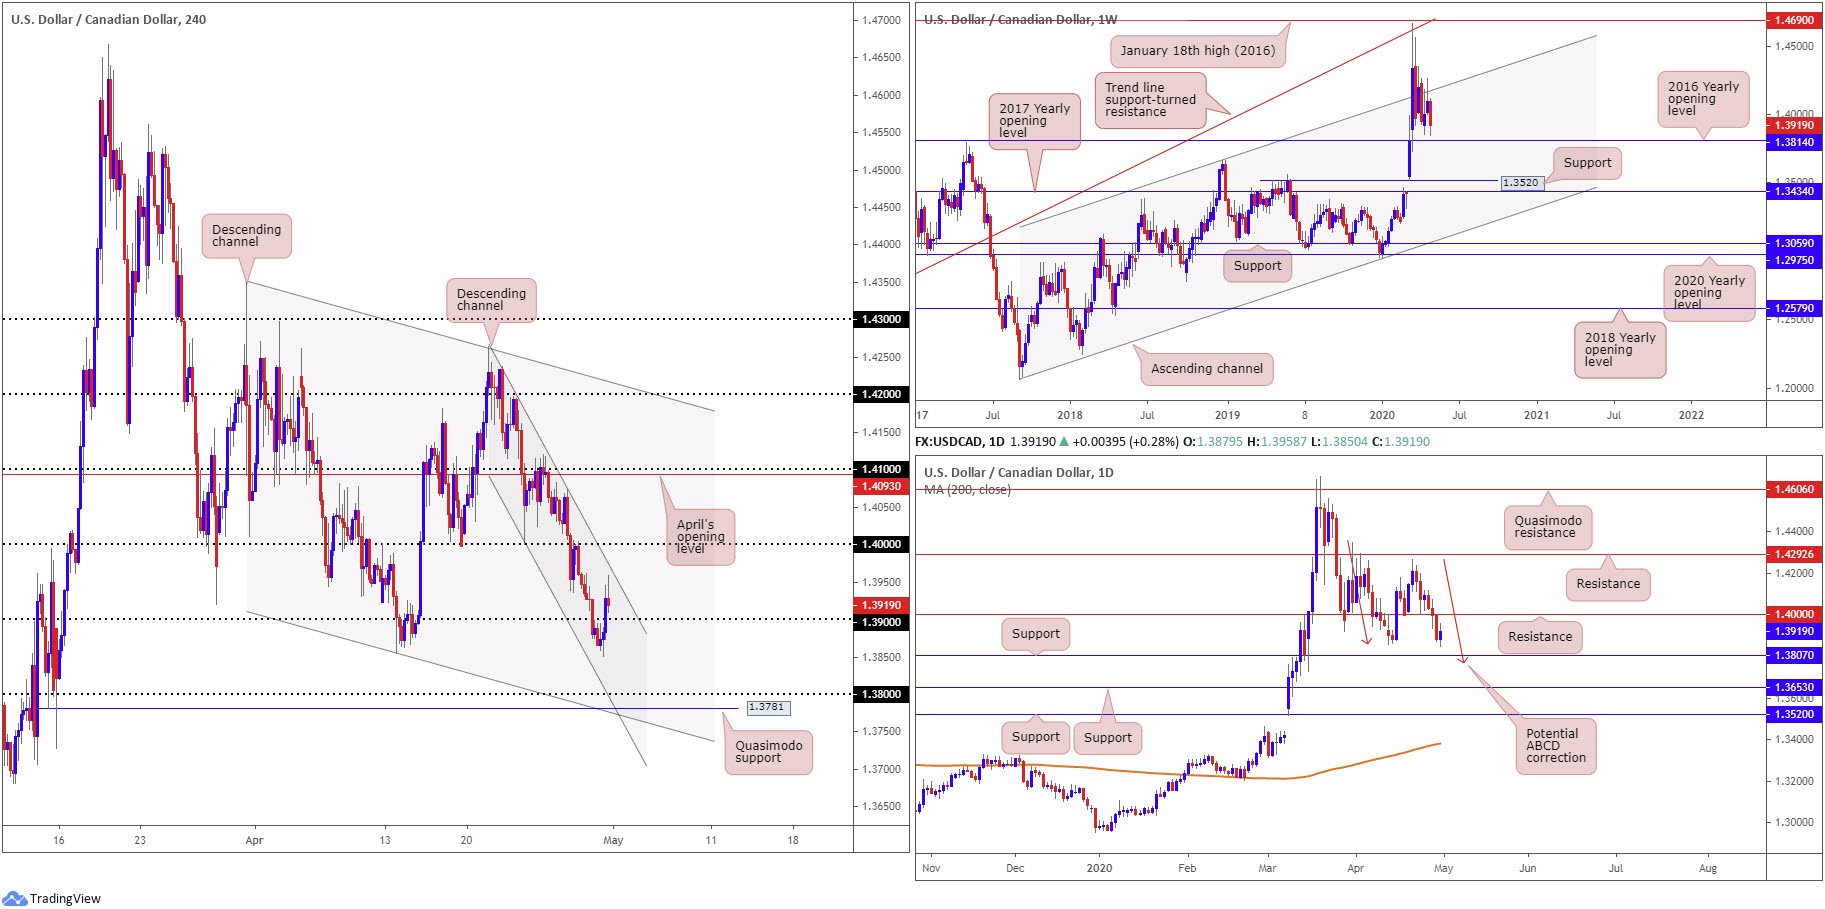
USD/CAD declined to levels not seen since March on Thursday, though staged an impressive comeback and regained 1.39+ status into the close. WTI continued to extend recovery gains, while the US dollar index welcomed 99.00 in strong fashion during US hours. Technically, the H4 candles on USD/CAD are compressing within a local descending channel formation between 1.4265/1.4000, with the pair poised to retest 1.39 as support.
South of 1.39, support is unlikely to emerge until shaking hands with the 1.38 handle, located close by large channel support, taken from the low 1.3855, and Quasimodo support at 1.3781.
Elsewhere, on the weekly timeframe longer-term traders will note the unit recently crossed swords with channel resistance, extended from the high 1.3661. The retest, shaped by way of a shooting star candlestick pattern, along with recent downside, has placed price action within reasonably close proximity to 1.3814, the 2016 yearly opening level. From the daily timeframe, support at 1.4000 was recently overrun (now a serving resistance level), consequently shifting the spotlight to support coming in at 1.3807.
Areas of consideration:
Despite yesterday’s recovery, one that snapped a three-day bearish phase, sellers still appear to have the upper hand. Weekly price shows room to reach 1.3814, as does daily price to 1.3807. As such, entering long on any retest seen at 1.39 as support may unsettle some traders. A H4 close sub 1.39, on the other hand, is likely sufficient enough to encourage sellers towards the 1.38ish region, though do remain cognisant that higher-timeframe support exists at 1.3814.
USD/CHF:
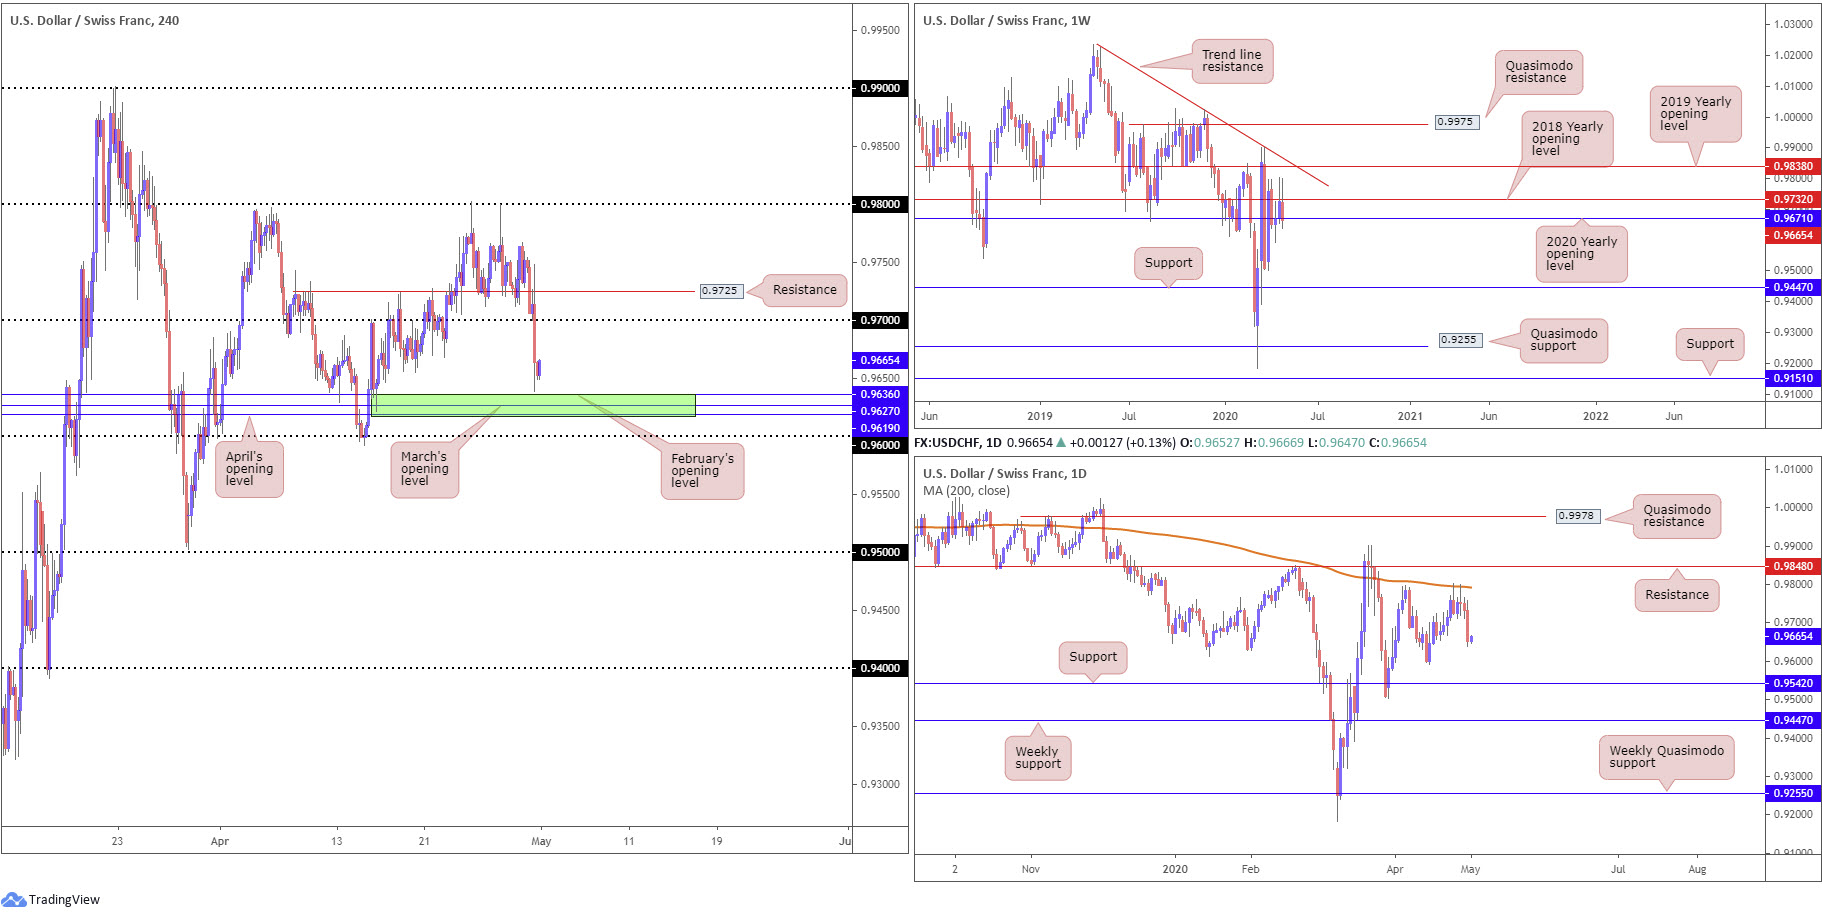
The US dollar concluded strongly lower against the Swiss franc Thursday, shedding 80 pips, or 0.83%. This cleared H4 support at 0.9725 (now a serving resistance), together with the 0.97 handle, to levels just ahead of an interesting area of support between 0.9619/0.9636 (green), a zone made up of April, March and February’s opening levels. South of the base, traders may also wish to acknowledge the 0.96 handle lurks close by.
Further out on the weekly timeframe we can see price has essentially failed to overrun the 2018 yearly opening level at 0.9732 and now trades at the 2020 yearly opening level at 0.9671, which may offer potential support.
Price action on the daily timeframe, however, shows the 200-day SMA (orange – 0.9792) remained a steadfast resistance, withstanding two upside attempts in recent trading. Aside from the 0.9592 April 15 low, we have support priced in at 0.9542, situated just ahead of weekly support at 0.9447.
Areas of consideration:
0.9619/0.9636 (green) offers reasonably well-grounded support. To test this area, however, would involve whipsawing through the 2020 yearly opening level at 0.9671 on the weekly timeframe. Another cautionary point to be aware of is the possibility of a fakeout through 0.9619/0.9636 to 0.96.
Clearing 0.96 is another scenario worth taking into account. This could unlock the door for bearish scenarios; beneath this base we see limited support until reaching daily support at 0.9542.
Dow Jones Industrial Average:
Global equities concluded mostly lower Thursday amid a cocktail of mixed earnings. The Dow Jones Industrial Average erased 288.14 points, or 1.17%; the S&P 500 lost 27.08 points, or 0.92%, while the tech-heavy Nasdaq 100 concluded higher by 17.75 points, or 0.20%.
For those who read Thursday’s technical briefing you may recall the following piece (italics):
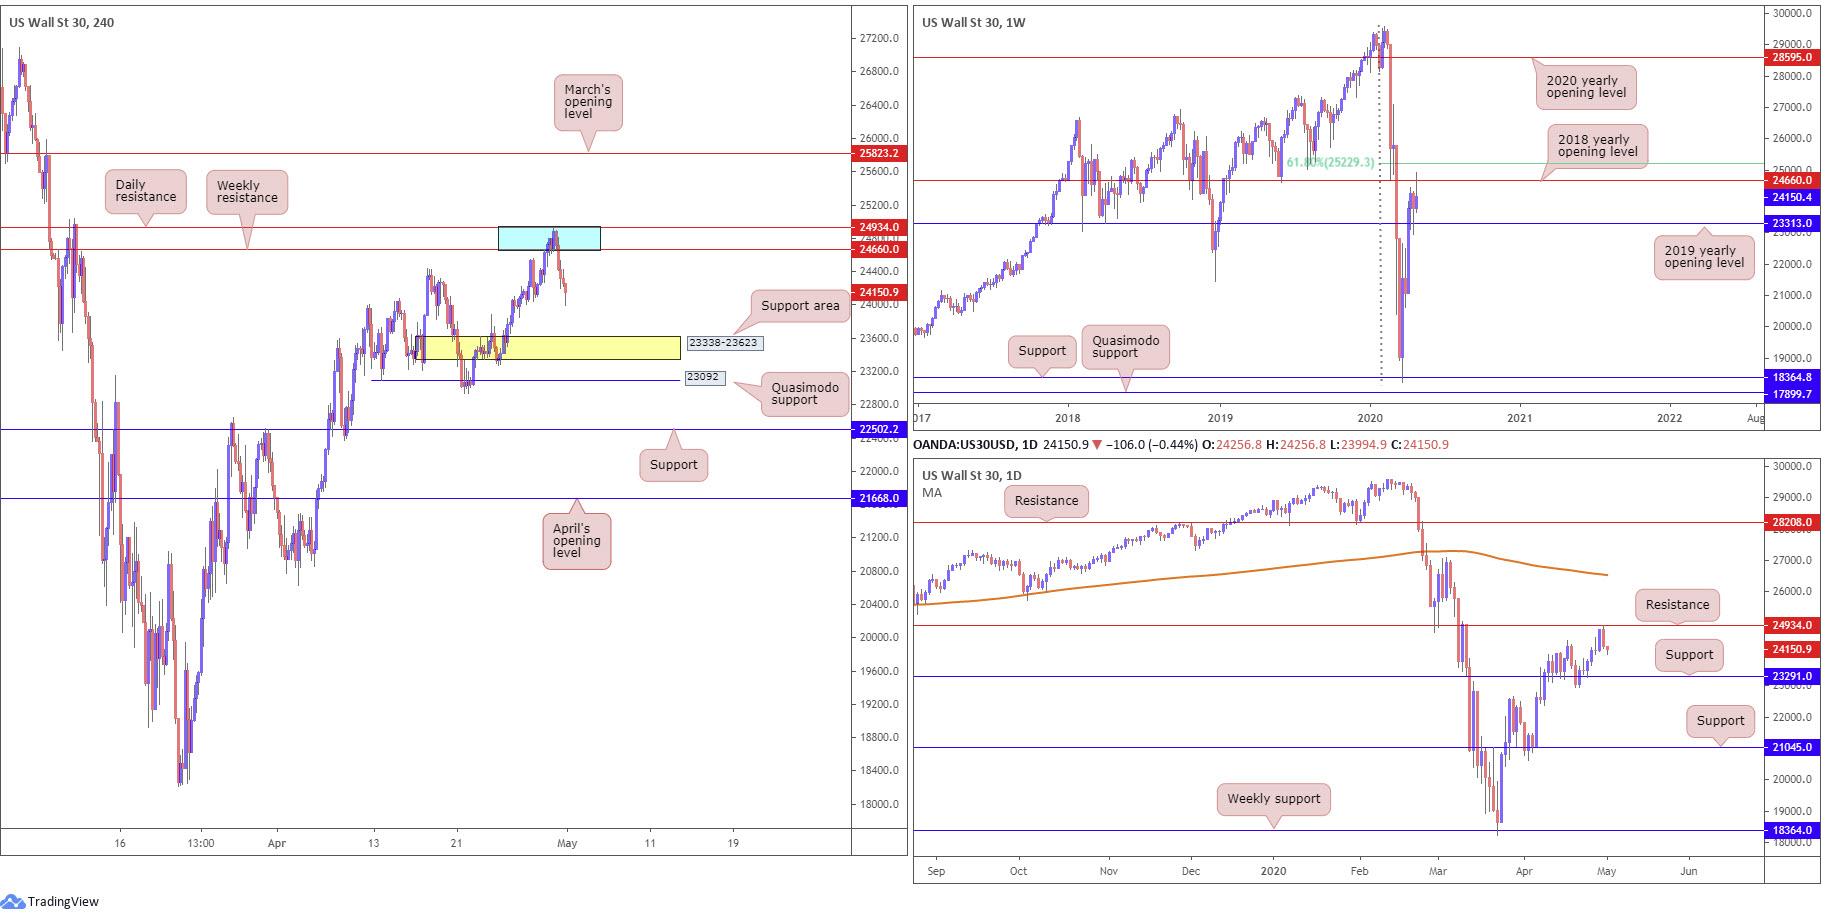
Technical action observed H4 candles drive into a potential resistance area, made up of daily resistance coming in at 24934 and weekly resistance from 24660 (blue). Breaking through this zone sets the stage for an approach to the 61.8% Fibonacci retracement ratio at 25229 on the weekly timeframe, followed by March’s opening level at 25823 on the H4 scale. Downside from 24934/24660 could have H4 price drive as far south as a support area (yellow) at 23338-23623.
Areas of consideration:
As can be seen from the H4 timeframe this morning, in the shape of a bearish inside candlestick pattern, 24934/24660 contained upside on Thursday, sliding to lows of 23994.
Those short this market will have likely reduced risk to breakeven at this point, with eyes perhaps on the H4 support area underlined above at 23338-23623 as an initial take-profit target.
XAU/USD (GOLD):
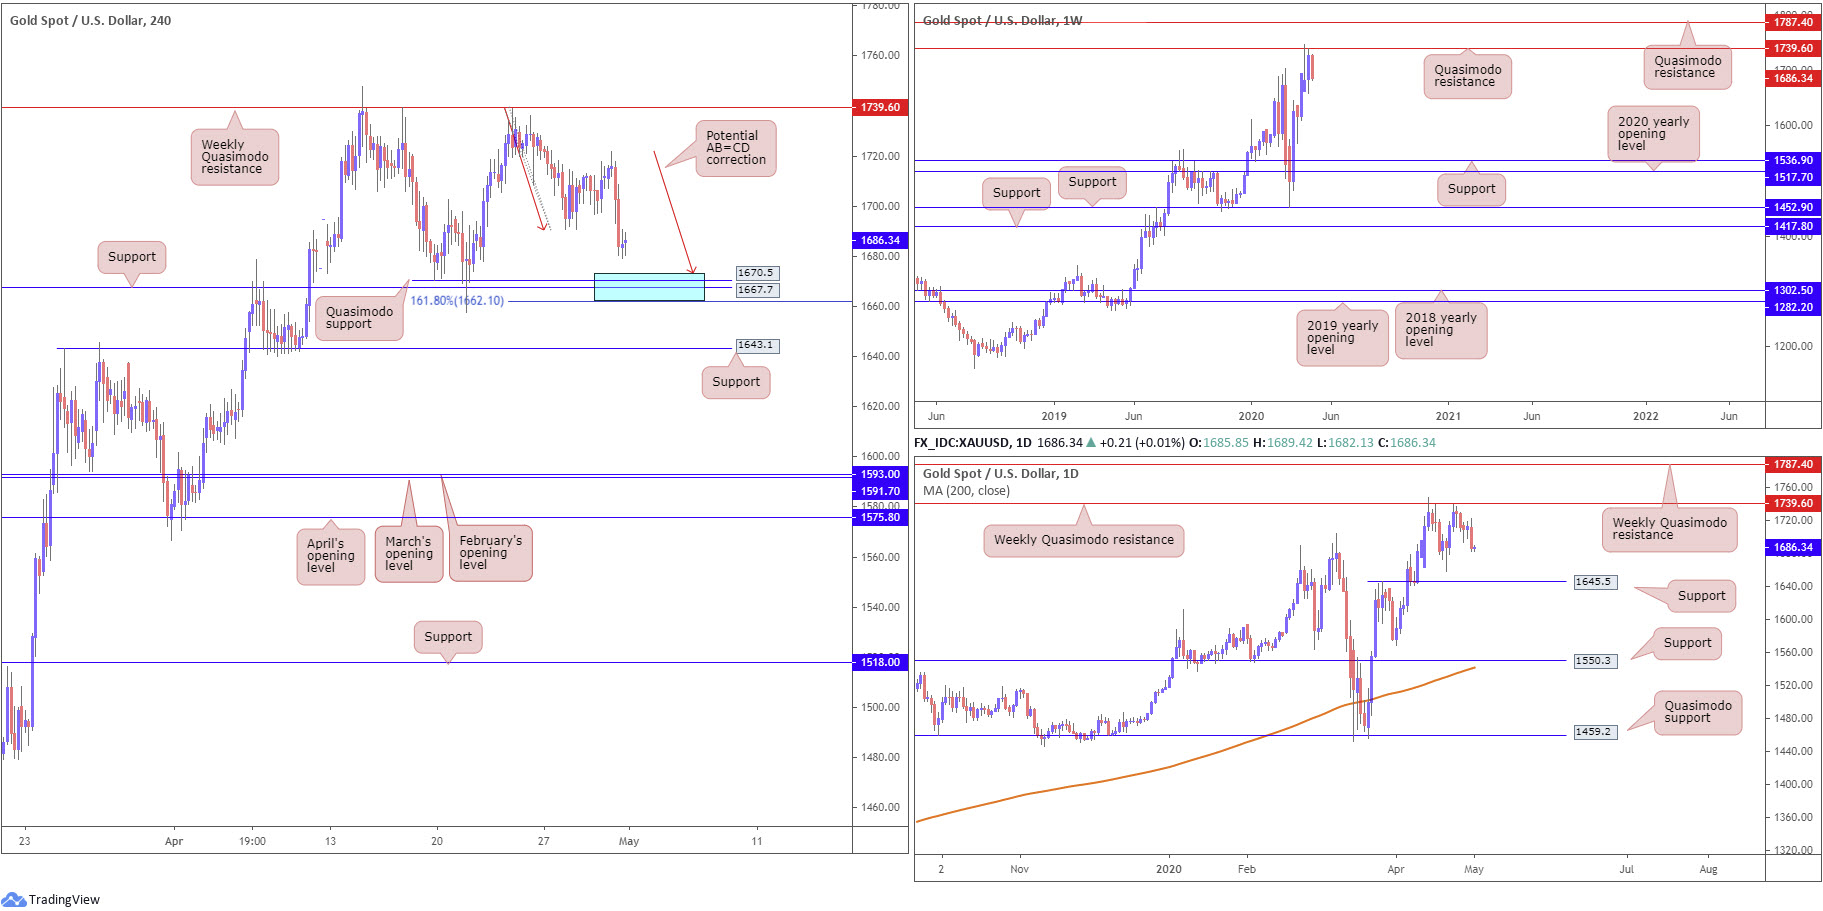
By way of a bearish outside day, the price of gold finished lower by 1.50% vs. the dollar Thursday. Despite the back-to-back H4 indecision candles, recent movement positioned H4 within striking distance of a particularly interesting base of support between 1662.1/1673.1 (comprised of a 161.8% Fibonacci extension point at 1662.1, H4 support at 1667.7, Quasimodo support at 1670.5 and an AB=CD correction at 1673.1 [red arrows]).
Although H4 price is nearing a possible reversal zone, traders are still urged to take into account where we’re coming from: a weekly Quasimodo resistance at 1739.6. This is not to say a rebound from 1662.1/1673.1 will not occur, it’s just a cautionary point to be aware of. Beneath the said H4 support zone, we have daily support at 1645.5, shadowed closely by H4 support (a prior Quasimodo resistance) at 1643.1.
Areas of consideration:
In the event of a rebound from 1662.1/1673.1 today, traders may consider using the AB=CD take-profit targets, derived from the 38.2% and 61.8% Fibonacci retracement ratios of legs A-D.
While breakout selling south of 1662.1 may also be tempting, knowing we’re departing from a weekly Quasimodo resistance, remember daily support resides close by at 1645.5.
The accuracy, completeness and timeliness of the information contained on this site cannot be guaranteed. IC Markets does not warranty, guarantee or make any representations, or assume any liability regarding financial results based on the use of the information in the site.
News, views, opinions, recommendations and other information obtained from sources outside of www.icmarkets.com.au, used in this site are believed to be reliable, but we cannot guarantee their accuracy or completeness. All such information is subject to change at any time without notice. IC Markets assumes no responsibility for the content of any linked site.
The fact that such links may exist does not indicate approval or endorsement of any material contained on any linked site. IC Markets is not liable for any harm caused by the transmission, through accessing the services or information on this site, of a computer virus, or other computer code or programming device that might be used to access, delete, damage, disable, disrupt or otherwise impede in any manner, the operation of the site or of any user’s software, hardware, data or property.
[1] https://www.federalreserve.gov/newsevents/pressreleases/monetary20200430a.htm


