
Key risk events today:
UK Public Sector Net Borrowing; Canadian Core Retail Sales m/m and Retail Sales m/m; US Prelim UoM Consumer Sentiment; FOMC Members Bullard Rosengren Speak.
EUR/USD:
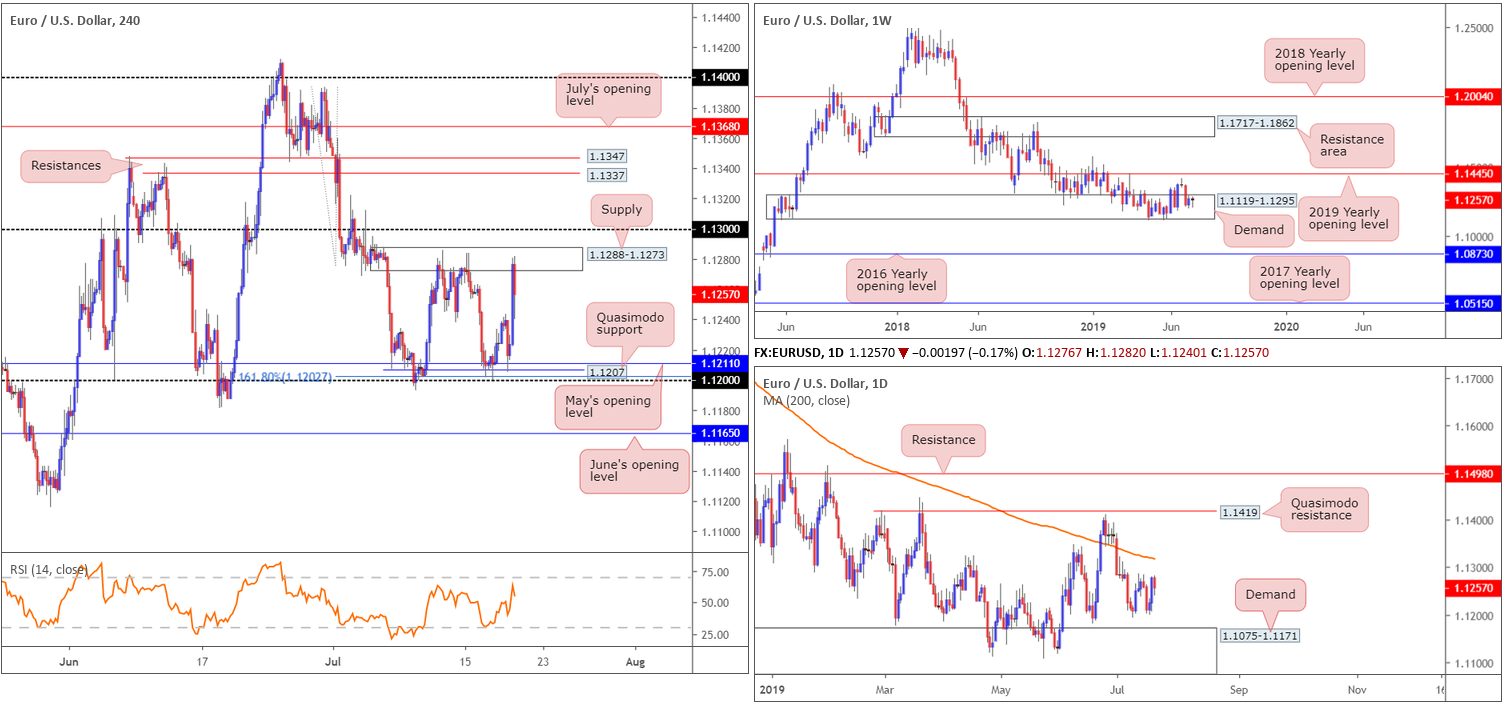
Federal Reserve member Williams surprised markets Thursday with an extra dovish rendition, stating its better to take preventative measures on rates than to wait for a disaster to unfold. This sent Europe’s single currency higher and the US dollar lower, extending EUR/USD gains towards notable H4 supply at 1.1288-1.1273, which as evident from the chart, is holding firm.
Technically speaking on the H4 timeframe, the candles have been carving out a range between 1.12 and the noted H4 supply since early July. Note 1.12 brings with it a 161.8% Fibonacci ext. point at 1.1202, a Quasimodo support at 1.1207 and May’s opening level at 1.1211. It might also be worth noting the 1.13 handle positions itself just north of the current supply zone.
Against the backdrop of medium-term flow, weekly action remains positioned within the walls of long-standing demand at 1.1119-1.1295. As highlighted in previous reports, upside momentum continues to emphasise a brittle tone here unfortunately, with the unit unable to dethrone resistance by way of the 2019 yearly opening level at 1.1445. According to the daily timeframe, further buying is a possibility until crossing swords with the 200-day SMA (orange – 1.1318). Beyond here, we have Quasimodo resistance in sight at 1.1419.
Areas of consideration:
Having seen the H4 candles form a range between supply at 1.1288-1.1273 and the 1.12 handle, traders may find the range limits of use. Trading within a range is certainly possible, if the area is large enough to secure reasonable risk/reward. Protective stop-loss orders are generally located a couple of points beyond the range extreme, targeting the opposing range limit.
In the event the upper edge of the current range is taken out, selling opportunities exist between the 200-day SMA on the daily timeframe at 1.1318 and the 1.13 handle on the H4. One can only imagine the number of protective stop-loss orders placed above the current H4 supply. This, coupled with sellers from 1.1318/1.13 and buy stops to sell into, is likely enough to entice sellers back into the market. Entry around 1.13 is potentially eyed, with a protective stop-loss order positioned above the 200-day SMA.
GBP/USD:
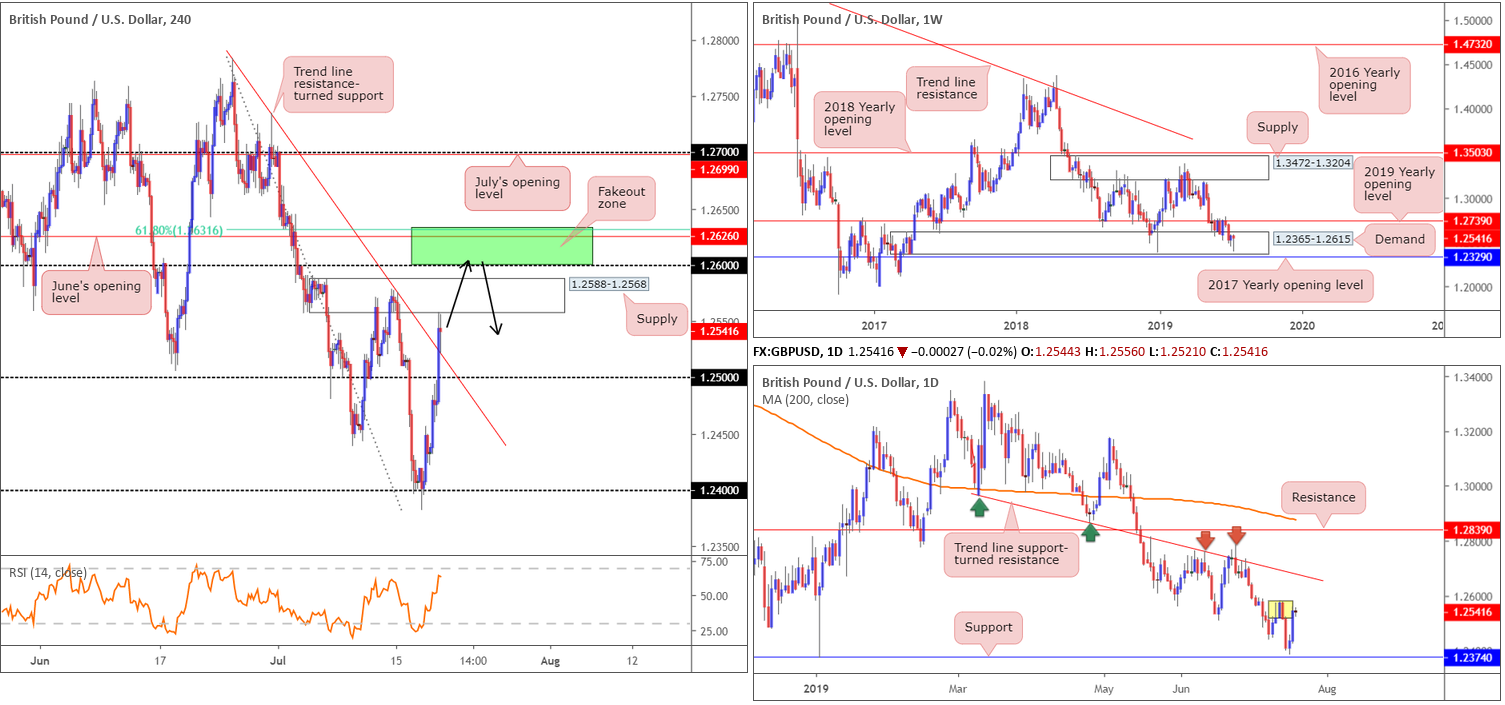
The British pound was a clear outperformer Thursday, swelling amid a combination of a waning greenback and increased optimism UK parliament would be able to act to prevent a no-deal Brexit. Up 0.90% on the day, the GBP/USD H4 candles snapped back above 1.25 and brushed aside trend line resistance (extended from the high 1.2783), before mildly paring gains into the close off supply at 1.2588-1.2568. Note the recently broken trend line resistance is currently serving as support. Indicator-based traders may also find use in noting the RSI indicator is seen nearing overbought territory.
With respect to higher-timeframe structure, the research team notes buying activity within the walls of weekly demand at 1.2365-1.2615. While many traders consider this a positive for longs, do remain cognizant of nearby resistance at 1.2739 by way of the 2019 yearly opening level. Things on the daily timeframe, however, could turn bearish from supply marked in yellow at 1.2578-1.2519. Beyond here, the path appears clear for an approach to trend line support-turned resistance taken from the low 1.2960.
Areas of consideration:
The green H4 zone between the 61.8 Fibonacci retracement at 1.2631, June’s opening level at 1.2626 and the round number 1.26, located above the H4 supply at 1.2588-1.2568, has ‘fakeout to me’ written all over it. Buy stops above the current H4 supply provide liquidity to sell into.
While this setup boasts limited higher-timeframe convergence, it is certainly worthy of a bounce should we push for higher ground today. Entry anywhere within the green zone is valid, with protective stop-loss orders positioned a couple of points above 1.2631. Conservative traders may, however, opt to wait for additional candlestick confirmation to form before pulling the trigger. This helps identify seller intent and provides entry and risk levels to work with.
AUD/USD:
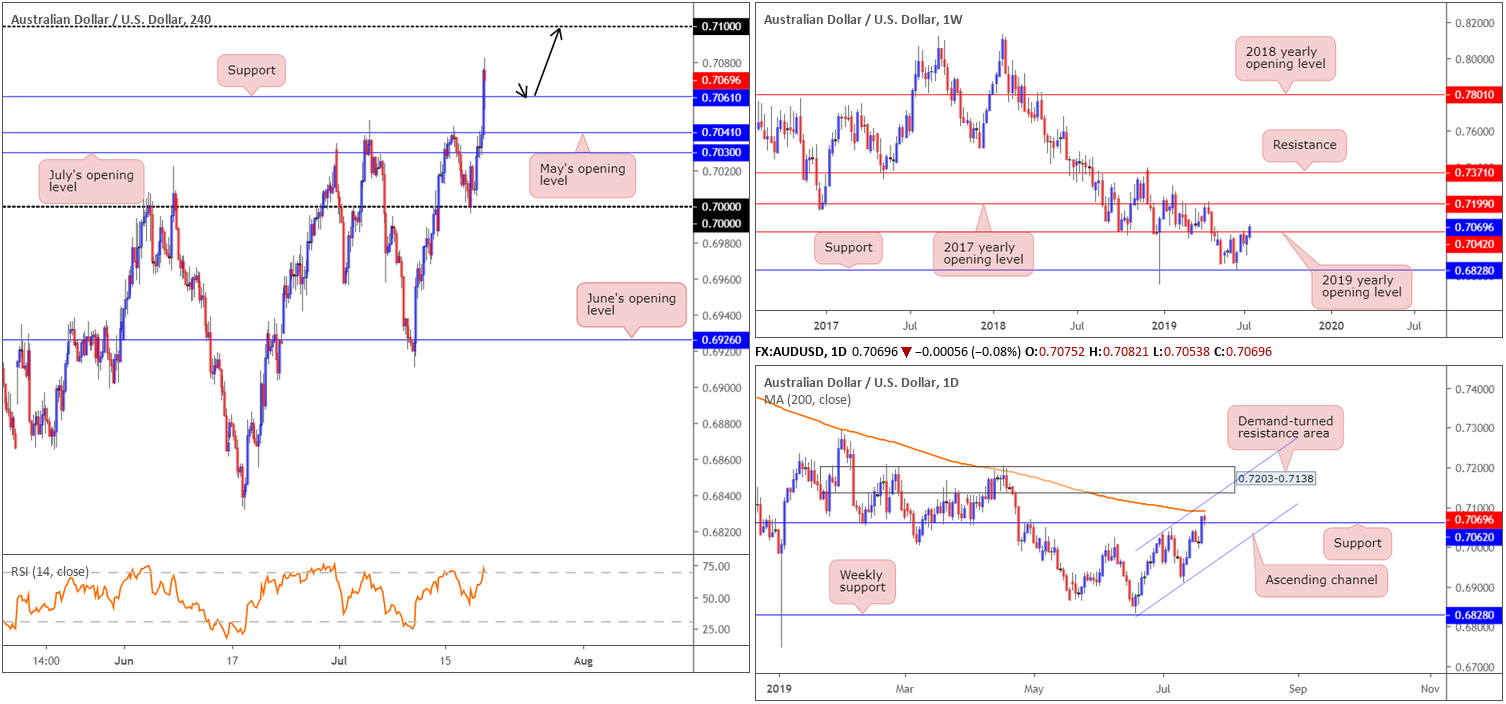
Finding local support on the back of Aussie employment data and Federal Reserve member Williams surprising markets with an extra dovish rendition, the Australian dollar surged higher vs. its US counterpart Thursday (up 0.94%), clocking a multi-month high of 0.7076.
According to the weekly timeframe, price action recently crossed above its 2019 yearly opening level at 0.7042. Assuming bids remain defensive, further upside towards the 2017 yearly opening level at 0.7199 may be in store. The story on the daily timeframe also witnessed price action overthrow resistance at 0.7062 yesterday (now serving as support), though faces possible resistance from the 200-day SMA currently circulating around 0.7091. Beyond here, the research team has eyes on a demand-turned resistance area at 0.7203-0.7138.
A closer reading of price action on the H4 timeframe has the candles meandering above a resistance-turned support at 0.7061, with a reasonably clear path north seen to the 0.71 handle. Indicator-based traders may also wish to note the RSI is seen treading water within overbought terrain.
Areas of consideration:
Keeping things Simple Simon this morning, a retest motion at 0.7061 H4 support could be something to watch out for today (black arrows), targeting the 200-day SMA at 0.7091, closely shadowed by 0.71. Ideally, the retesting H4 candle should close in the form of a bullish candlestick (Japanese) configuration before traders consider pulling the trigger (entry and risk levels can be determined according to the candlestick structure).
USD/JPY:
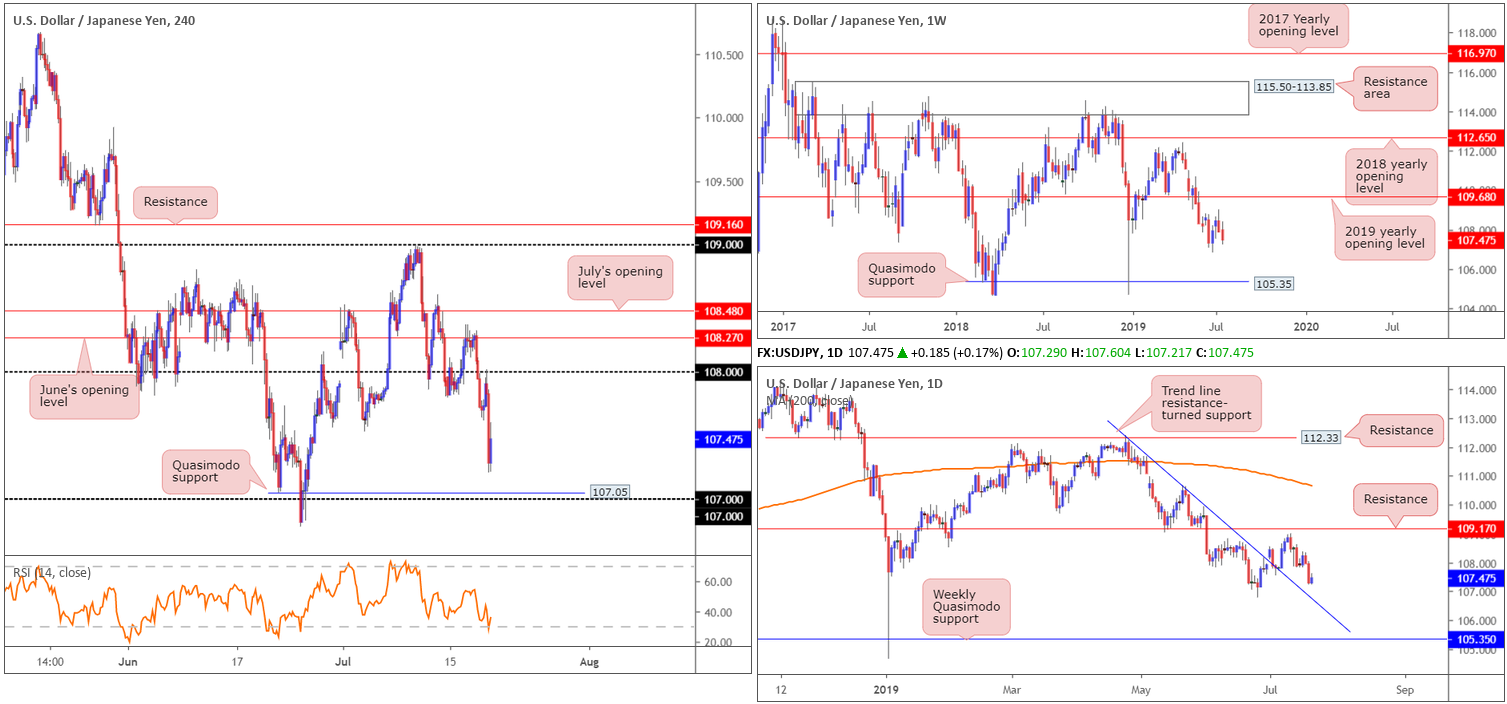
Broad-based dollar selling, influenced largely on the back of dovish comments from Federal Reserve member Williams, filtered through the market Thursday. Down 0.61%, the USD/JPY rotated lower after retesting the underside of 108 on the H4 timeframe. For traders who read Thursday’s briefing you may recall selling 108 was a noted setup to keep eyes open for, so well done to any of our readers who managed to seal a position here.
According to the H4 timeframe, further selling is likely on the cards towards Quasimodo support at 107.05, closely shadowed by the 107 handle. In terms of where we stand on the bigger picture, the technical studies on the weekly timeframe remains unchanged:
Breaking a two-week bullish phase, the US dollar rotated lower against the Japanese yen last week, engulfing the preceding candlestick’s body and erasing more than 55 points. According to technical structure, resistance is set by way of the 2019 yearly opening level at 109.68 and support is not expected to emerge until reaching a Quasimodo formation at 105.35.
With respect to the daily timeframe, buying is expected to enter the fray off trend line resistance-turned support extended from the high 112.40. Note this descending line is positioned beneath 107 on the H4 timeframe.
Areas of consideration:
As highlighted above. The H4 Quasimodo support at 107.05 is seen as the next downside target for shorts from 108. While a reaction is expected to form here, sellers may want to consider leaving a portion of their short position running in case we break through 107 and head for the daily trend line resistance-turned support mentioned above.
USD/CAD:
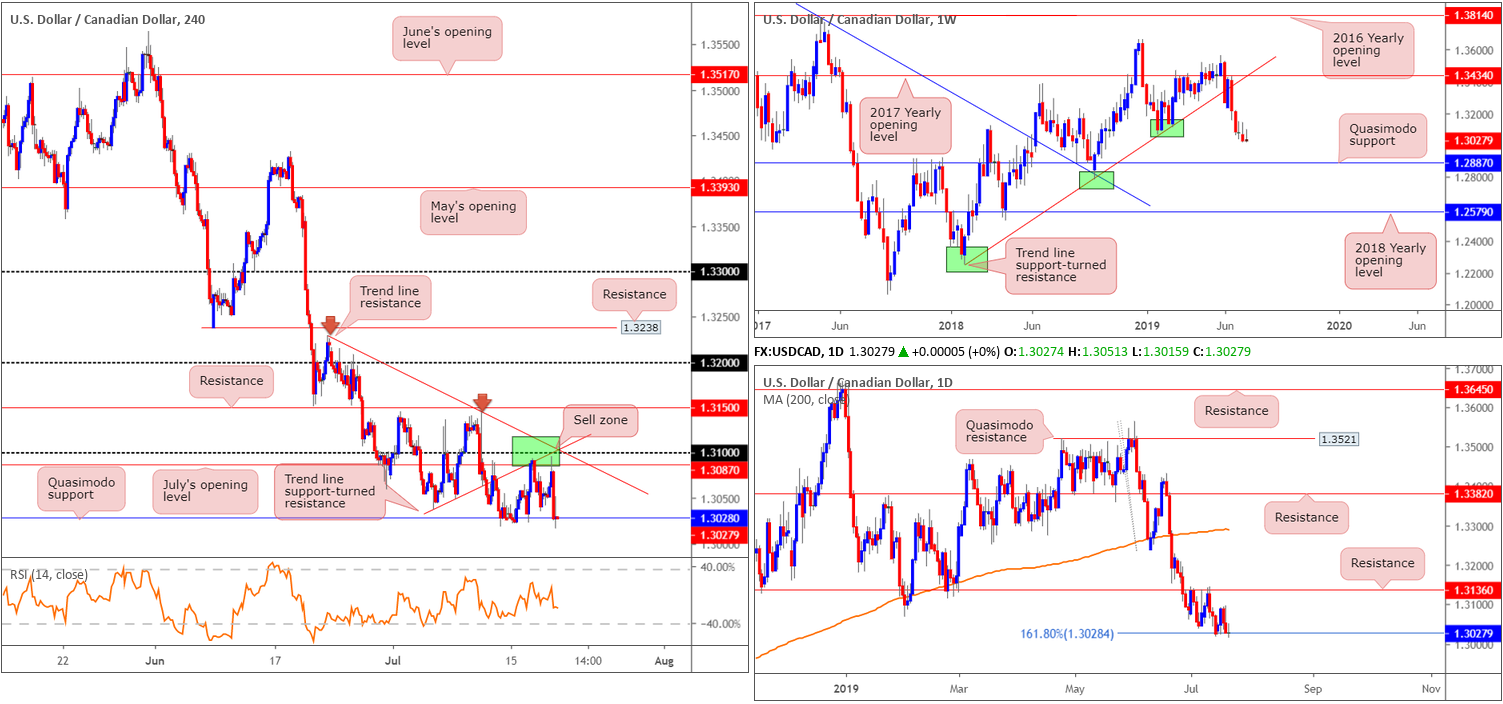
In previous reports, the research team highlighted the range between trend line resistance (1.3229) and July’s opening level at 1.3087 on the H4 timeframe (green) as a potential sell zone. Included within this area is the round number 1.31 and a trend line support-turned resistance taken from the low 1.3037.
As can be seen from the H4 chart this morning, the area remains in the fold though so does Quasimodo support at 1.3028, which happens to align with a 161.8% Fibonacci ext. point on the daily timeframe.
Well done to any of our readers who remain short this market, as further selling is suggested on the weekly timeframe with support not visible until connecting with Quasimodo support at 1.2887.
Areas of consideration:
Outlook remains unchanged.
Ultimately, the research team still have eyes on a move beneath the H4 Quasimodo support underlined above at 1.3028, with a final downside target set at the weekly Quasimodo support drawn from 1.2887. So, aside from the shorts currently in play from the H4 sell zone discussed above in green, a decisive H4 close beneath 1.3028 is eyed. A H4 close beneath here that’s followed up with a successful retest will likely be enough to encourage further downside. As for entry, traders have the option of basing entry and risk levels on the rejecting candle’s structure – of course this would be ideal if the rejecting candle formed by way of a Japanese candlestick formation.
USD/CHF:
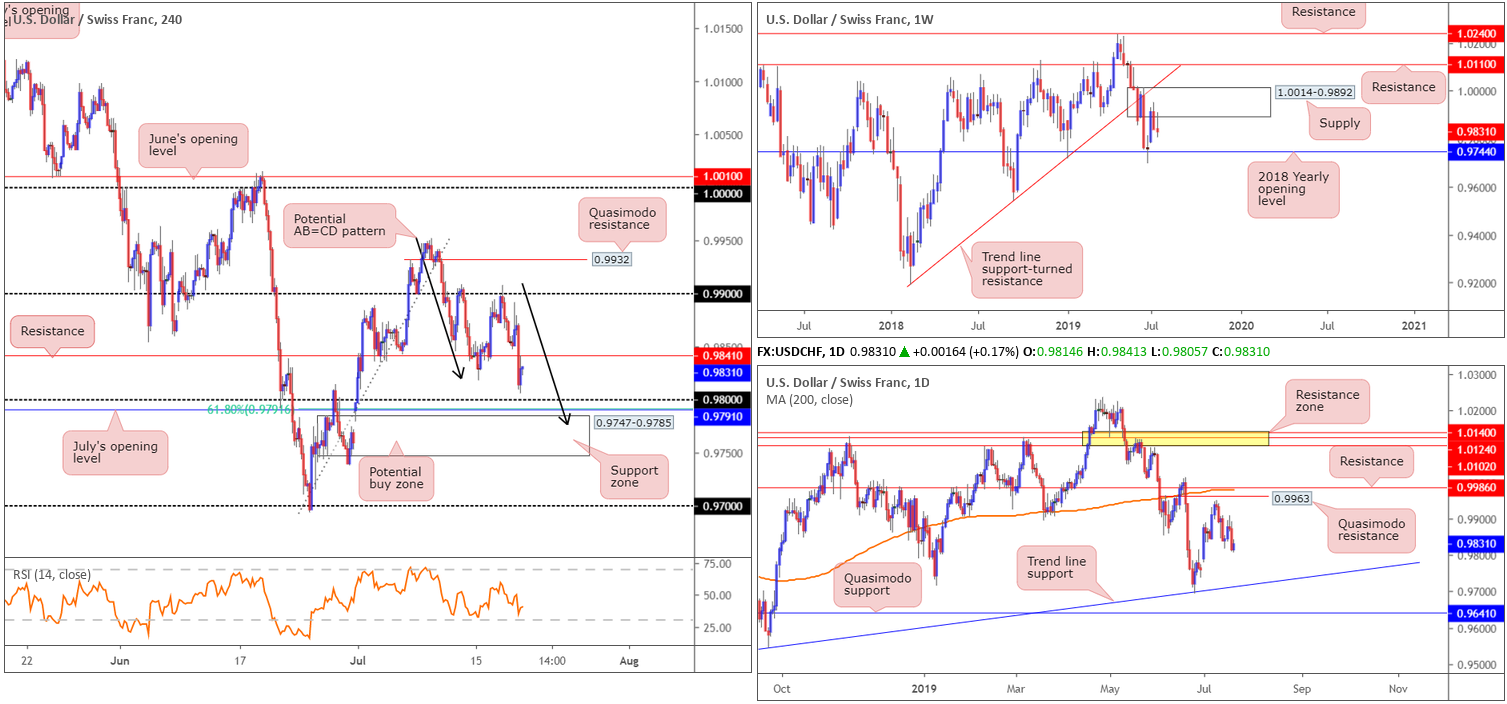
Having seen the USD/CHF probe lower Thursday, largely due to dovish comments from Federal Reserve member Williams, the H4 candles are hovering a few points north of 0.98 this morning. As underlined in Thursday’s briefing, 0.98 is an alluring area of support. Closely trailed by July’s opening level at 0.9791, a 61.8% Fibonacci retracement value a support zone at 0.9747-0.9785 and a possible AB=CD correction point (black arrows) at 0.9777, the surrounding area offers strong local confluence for a move higher.
Higher up on the curve, weekly flow is selling off from supply at 1.0014-0.9892 after shaking hands with the base two weeks ago. While this may lead to a revisit of 0.9744: the next downside support target, traders may also find use in noting the trend line support-turned resistance (extended from the low 0.9187), closely followed by resistance at 1.0110, should we turn higher.
Closer examination of price action on the daily timeframe shows the unit pressing south after failing to test Quasimodo resistance at 0.9963, followed closely by resistance at 0.9986 and the 200-day SMA (orange). To the downside, limited support is in view until reaching trend line support taken from the low 0.9542.
Areas of consideration:
Outlook remains unchanged.
Longer-term flow remains unchanged and suggests selling could still be in store from weekly supply at 1.0014-0.9892.
Medium-term flow, also unchanged in terms of tradable zones, has eyes on the 0.98 region (given its surrounding confluence highlighted above) for potential longs. However, traders interested in buying 0.98 are also urged to take into account we could witness a fakeout into 0.9747-0.9785 before rotating higher. Stop-loss placement, therefore, is best positioned beneath this zone at 0.9747.
Dow Jones Industrial Average:
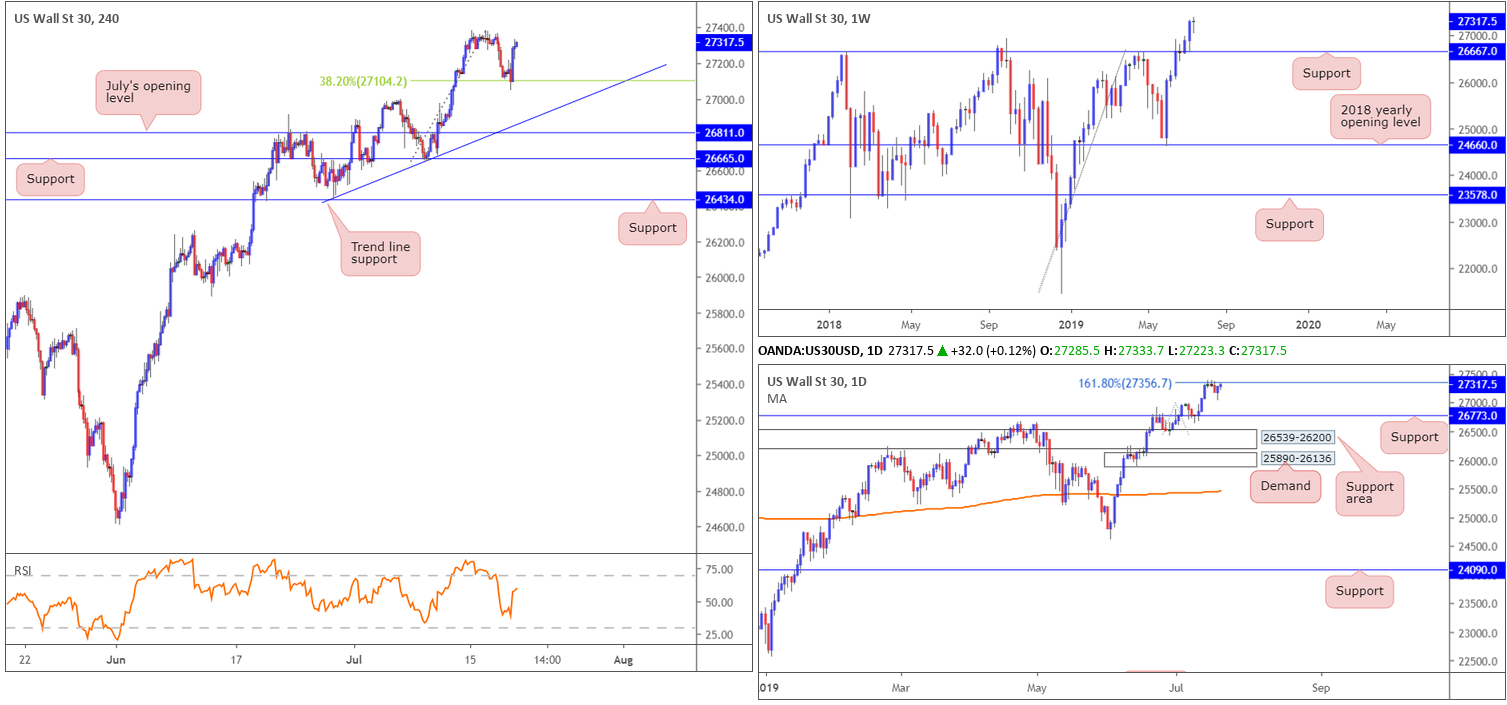
Kicking off with a look at the weekly timeframe this morning, the research team notes that aside from a brief spell of indecision three weeks back, the Dow Jones Industrial Average has emphasised a strong bullish tone since shaking hands with the 2018 yearly opening level at 24660 in early June. Taking out resistance at 26667 and shortly after retesting it as support propelled the index to fresh record highs of, as of current price, 27388. With limited resistance in sight until connecting with 28070 (not visible on the screen), a 127.2% Fibonacci ext. point taken from the low 21425, additional buying could be seen over the coming weeks.
Contrary to weekly price, daily action is defending the underside of 27356: the 161.8% Fibonacci ext. point. Continued selling from here has a downside support target set at 26773, located just north of weekly support at 26667.
US stocks reversed course from an early slump and closed higher Thursday to break a two-day losing streak after technology and bank stocks rallied (AP). The Dow Jones Industrial Average closed at +0.01%; the S&P 500 advanced 0.36% and the tech-heavy Nasdaq 100 added 0.19%.
Aside from the 38.2% Fibonacci support retracement on the H4 timeframe at 27104, limited support is visible on this scale until reaching a trend line support extended from the low 26436.
Areas of consideration:
Until the index breaks above daily resistance (161.8% Fibonacci ext. point) at 27356, buying this market is a challenge. Once/if this level is taken out a long, preferably on the retest of 27356, is certainly worthy of consideration, with an ultimate upside target set at the weekly resistance coming in by way of a 127.2% Fibonacci ext. point taken from the low 21425.
XAU/USD (GOLD):
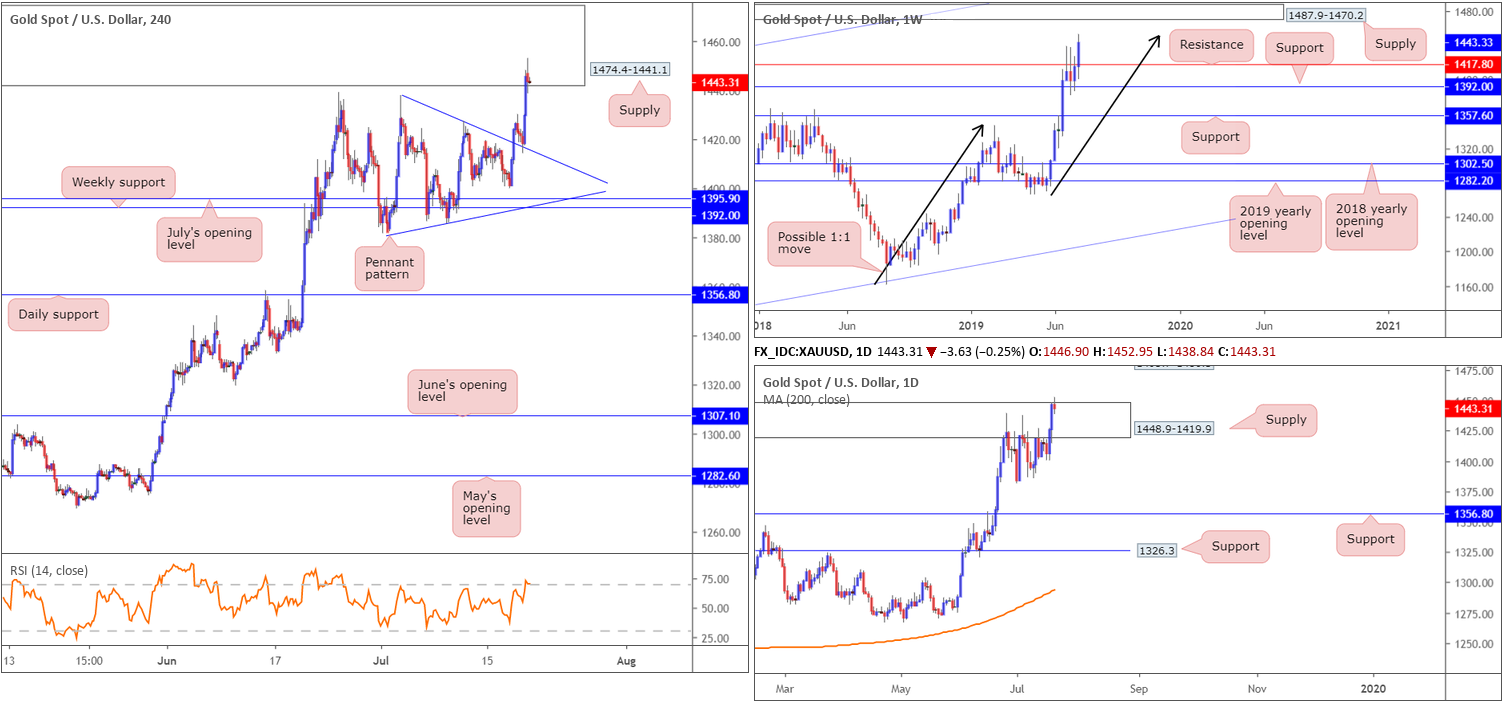
In recent sessions, market participants witnessed bullion surge higher vs. its US peer, concluding Thursday +1.44%. From a technical standpoint on the H4 timeframe, a continuation move to the upside was expected given the pennant pattern formation (1381.9/1437.7). As you can see, price action dethroned the top edge of the pennant in recent trading and shortly after retested the limit as support, which was followed through with a strong move to the upside that ended with price closing within the lower limits of a rather large supply at 1474.4-1441.1. Well done to any of our readers who managed to catch the recent run higher.
Glued to the top edge of the said H4 supply zone is a weekly supply area coming in at 1487.9-1470.2, though before reaching this zone, price must contend with a 1:1 correction (black arrows) around 1453.2 shaped from the 1160.3 August 13 low.
The technical landscape on the daily timeframe, however, recently observed price action break the top edge of a supply zone at 1448.9-1419.9. While this move was likely enough to trip a portion of the stop-loss orders above here, its unlikely to have cleared the path north just yet. In the event we do break higher, nevertheless, traders may wish to note supply at 1495.7-1480.3 as the next upside target on this scale (not visible on the screen).
Areas of consideration:
Daily supply at 1448.9-1419.9 had the upper edge of its base clipped in recent movement, though price action has yet to close above the perimeter. This – coupled with H4 price entering the jaws of a large supply at 1474.4-1441.1 and weekly price connecting with a 1:1 correction around 1453.2 – we could be in for some selling today, possibly recapturing a large portion of Thursday’s gains.
To take advantage of this, traders may opt to wait for H4 price to print a bearish candlestick configuration at current price and entering based on this structure. The first downside target from here is likely to be back around the top edge of the H4 pennant.
The accuracy, completeness and timeliness of the information contained on this site cannot be guaranteed. IC Markets does not warranty, guarantee or make any representations, or assume any liability with regard to financial results based on the use of the information in the site.
News, views, opinions, recommendations and other information obtained from sources outside of www.icmarkets.com.au, used in this site are believed to be reliable, but we cannot guarantee their accuracy or completeness. All such information is subject to change at any time without notice. IC Markets assumes no responsibility for the content of any linked site.
The fact that such links may exist does not indicate approval or endorsement of any material contained on any linked site. IC Markets is not liable for any harm caused by the transmission, through accessing the services or information on this site, of a computer virus, or other computer code or programming device that might be used to access, delete, damage, disable, disrupt or otherwise impede in any manner, the operation of the site or of any user’s software, hardware, data or property.


