
A note on lower timeframe confirming price action…
Waiting for lower timeframe confirmation is our main tool to confirm strength within higher timeframe zones, and has really been the key to our trading success. It takes a little time to understand the subtle nuances, however, as each trade is never the same, but once you master the rhythm so to speak, you will be saved from countless unnecessary losing trades. The following is a list of what we look for:
- A break/retest of supply or demand dependent on which way you’re trading.
- A trendline break/retest. Buying/selling tails – essentially we look for a cluster of very obvious spikes off of lower timeframe support and resistance levels within the higher timeframe zone.
- Candlestick patterns. We tend to only stick with pin bars and engulfing bars as these have proven to be the most effective.
For us, lower timeframe confirmation starts on the M15 and finishes up on the H1, since most of our higher timeframe areas begin with the H4. Stops usually placed 5-10 pips beyond your confirming structures.
EUR/USD:
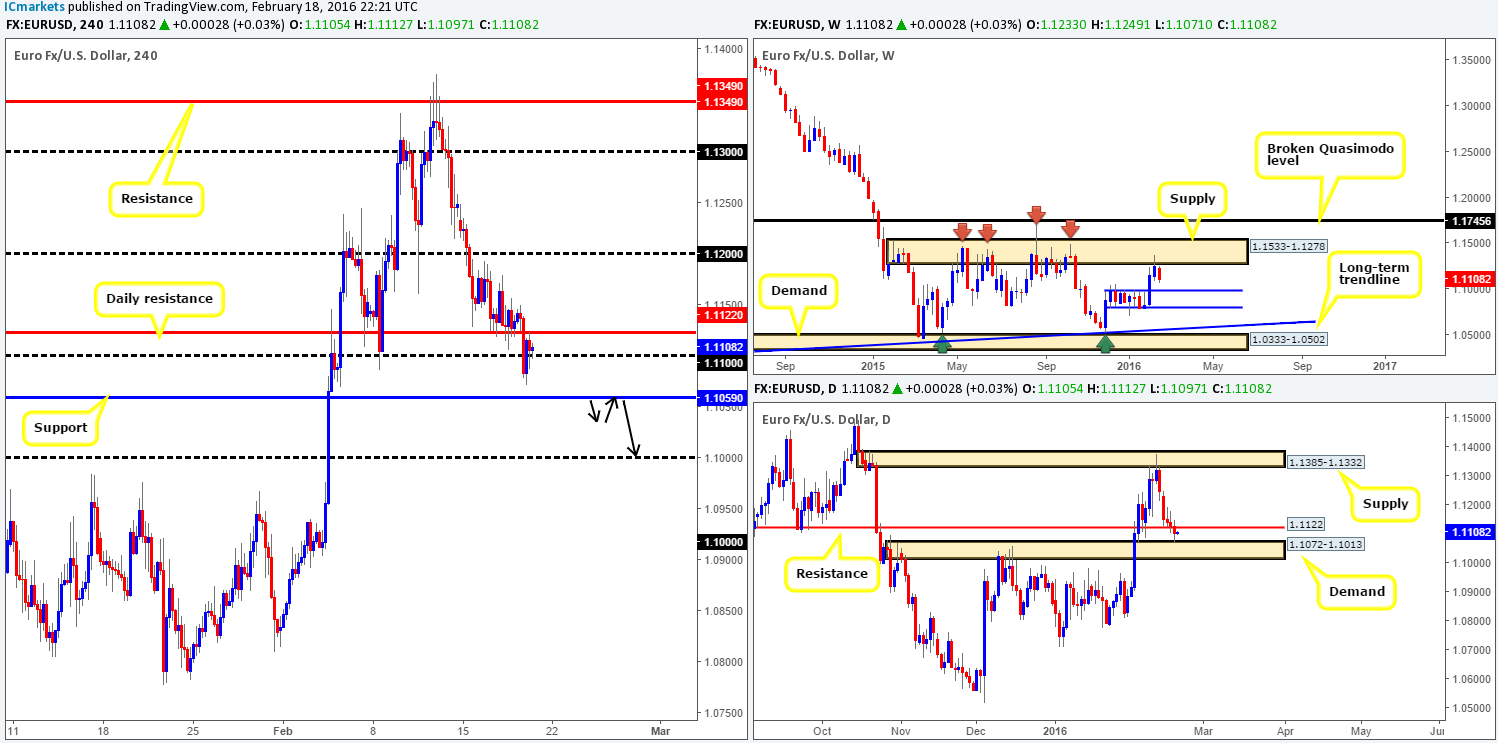
Another wet and rainy day for the EUR yesterday helped the pair record its fifth consecutive daily loss. The single currency smashed through both daily support at 1.1122 and also psychological support 1.1100, before changing tracks going into the U.S open (likely due to positive unemployment U.S. data) and retesting the underside of the daily support as resistance.
From our perspective, this pair is in a little bit of a tricky spot right now. Weekly flow is currently being held lower by supply drawn from 1.1533-1.1278, whilst daily action recently touched gloves with the top-side of demand at 1.1072-1.1013. In addition to this, below current price on the H4, there sits a support penciled in at 1.1059.
Based on recent price action there is little that jumps out to us this morning. The best, and in our opinion, most logical setup to watch for would be a break below and retest of the aforementioned H4 support (see black arrows), targeting the large psychological support 1.1000 (single take-profit target due to weekly support lurking just below this number at 1.0983). Granted, this trade would mean one shorting into daily demand, but when there’s weekly supply backed by daily resistance assisting downward flow, we feel the odds would be in our favor here.
Levels to watch/live orders:
- Buys: Flat (Stop loss: N/A).
- Sells: Watch for bids to be consumed around 1.1059 and look to trade any retest from this area thereafter (lower timeframe confirmation required).
GBP/USD:
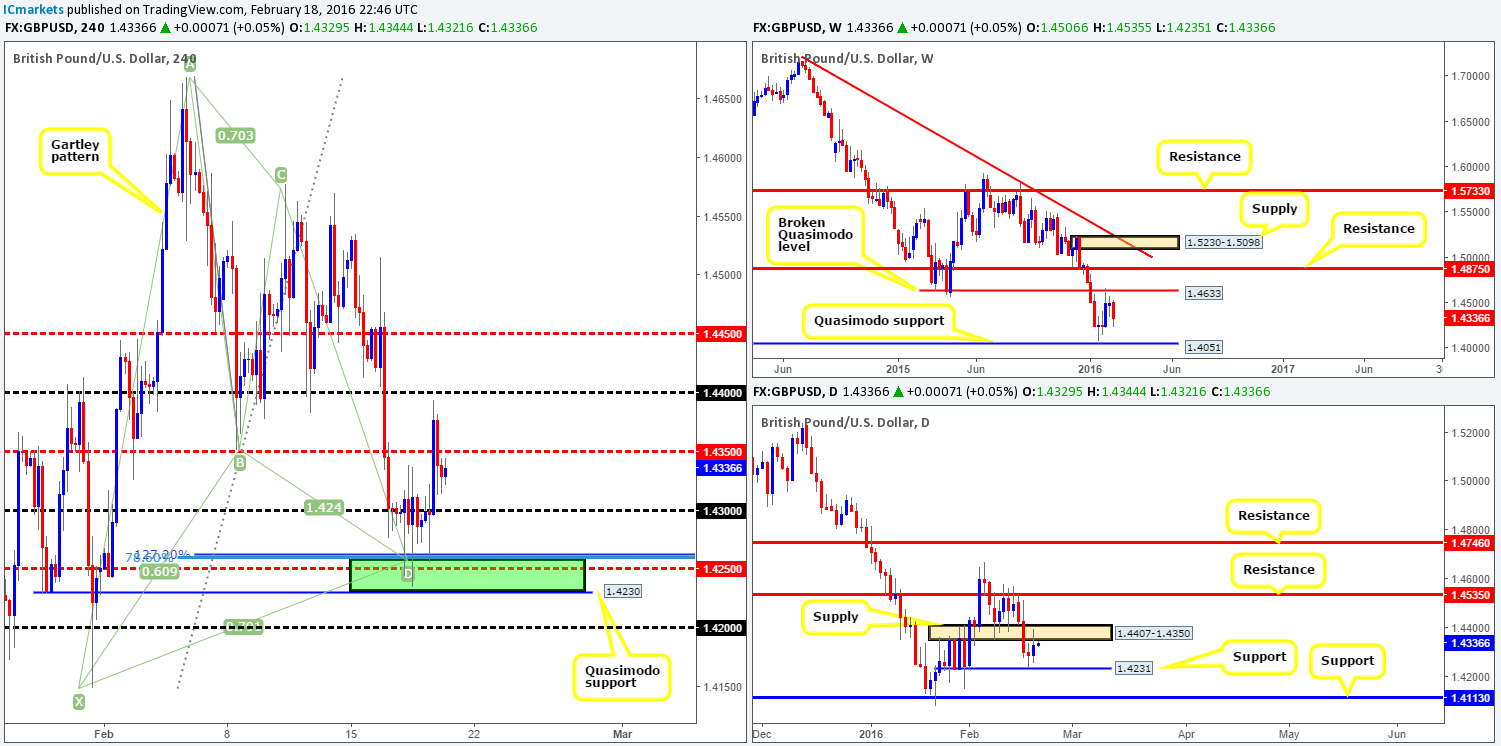
In Thursday’s report (http://www.icmarkets.com/blog/thursday-18th-february-daily-technical-outlook-and-review/), it was noted that we had a live position from 1.42589 on the basis of the H4 Harmonic Gartley pattern around the 1.4258 mark. Partial profits had already been taken at 1.4300 and our stop moved to breakeven plus three. As shown on the H4 chart, recent action unfortunately stabbed our breakeven stop, and then took off like a rocket to highs of 1.4393 before reversing going into the American session. Very frustrating to say the least, but it’s something we have to deal with as traders. Well done to any of our readers who managed to stay in on this move!
Now, with the weekly chart loitering mid-range between Quasimodo support at 1.4051 and a broken Quasimodo level at 1.4633, and the daily flirting with the underside of supply at 1.4407-1.4350, what’s likely in store for this market today? Well, to our way of seeing things, It’s very difficult to be bullish the pound considering daily action. On the flip side, selling also has its problems since psychological support 1.4300 is hovering just below, followed closely by the Gartley Harmonic buy zone discussed above. In light of this, and the fact that it’s the last trading day of the week, we’ll remain on the sidelines today and reassess for next week.
Levels to watch/live orders:
- Buys: Flat (Stop loss: N/A).
- Sells: Flat (Stop loss: N/A).
AUD/USD:
Following Wednesday’s rally north, the commodity currency saw more subdued price action during the course of yesterday’s sessions. Although attempts were made to breakout, the pair consolidated tightly between mid-level support at 0.7150 and 0.7166. Given this rather lackluster performance, our outlook for this pair remains unchanged.
At the top of the pile, weekly action is currently seen holding firm ground above support at 0.7035. Provided that price continues to show strength from here, we could potentially see the pair rally up to supply penciled in at 0.7438-0.7315.
Down on the daily chart, however, price continues to flirt with the underside of resistance drawn from 0.7178. One only has to look to the past to see how significant this level is!
In view of the H4 chart, supply at 0.7217-0.7191 is still an area we have on our radar, since it boasts a deep 88.6% Fibonacci resistance at 0.7212 along with psychological resistance just below at 0.7200. Due to this confluence, along with additional resistance coming in from the daily chart at 0.7178, we believe price will bounce from here. Despite this, trading this area without lower timeframe confirmation is a risky trade in our book, since weekly flow could easily wipe out both the daily and H4 levels and continue trading north. Should we manage to pinpoint a setup in this region today, we’ll be looking to take partial profits at the first demand formed prior to hitting our zone, and will likely place our stop above the H4 supply itself.

Levels to watch/live orders:
- Buys: Flat (Stop loss: N/A).
- Sells: 0.7217-0.7191 [Tentative – confirmation required] (Stop loss: dependent on where one confirms this area).
USD/JPY:
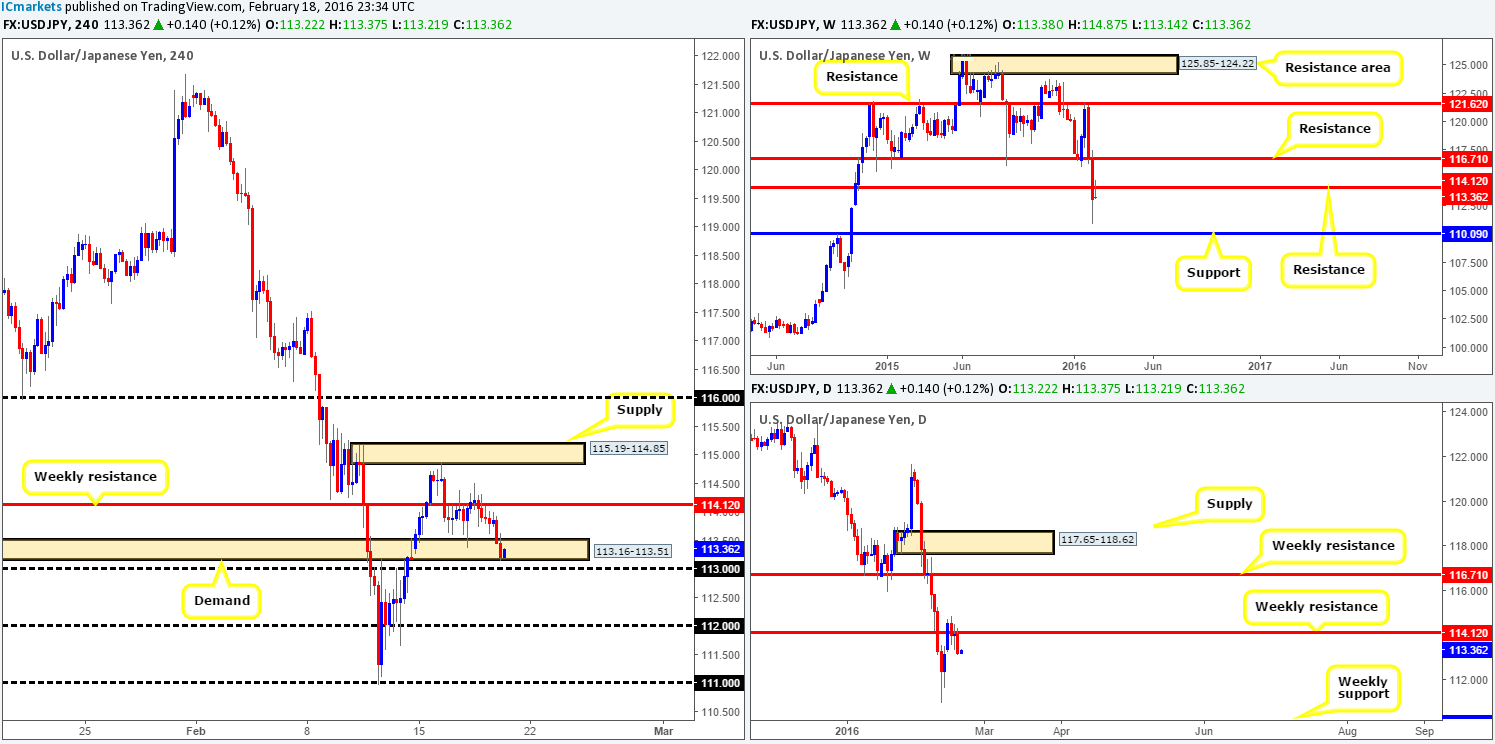
Beginning from the top this morning, weekly resistance at 114.12 is seen holding firm for the time being. Assuming that the sellers remain dominant here, the next objective to reach can be seen at 110.09. Very little difference between the weekly and daily timeframe is present at the moment. Apart from the 11th Feb low at 110.96, there’s little daily support in the way of a move down to the aforementioned weekly support.
From the H4 chart, it’s clear to see price now tackling the extremes of a H4 demand drawn from 113.16-113.51. Traders who are considering a buy from here might want to take the higher-timeframe picture into account before doing so (see above).
Based on yesterday’s movement, Thursday’s outlook remains valid in our opinion since it is very difficult to know if weekly resistance is going to hold at this point:
- For buys, we would not be confident until a sustained move above the H4 supply zone penciled in at 115.19-114.85 has taken place. This should not only confirm bid strength from the weekly level mentioned above, but also open the gates for prices to challenge the 116.00 figure.
- For sells, the 113.00 psychological support would need to be taken out. This should confirm selling strength from the weekly level discussed above and also clear the path south down to the112.00 handle.
Trading either side is valid in our opinion, as long as one waits for a confirmed retest of the broken area.
Levels to watch/live orders:
- Buys: Watch for offers to be consumed around 115.19-114.85 and look to trade any retest seen thereafter (lower timeframe confirmation required).
- Sells: Watch for bids to be consumed around 113.00 and look to trade any retest seen thereafter (lower timeframe confirmation required).
USD/CAD:
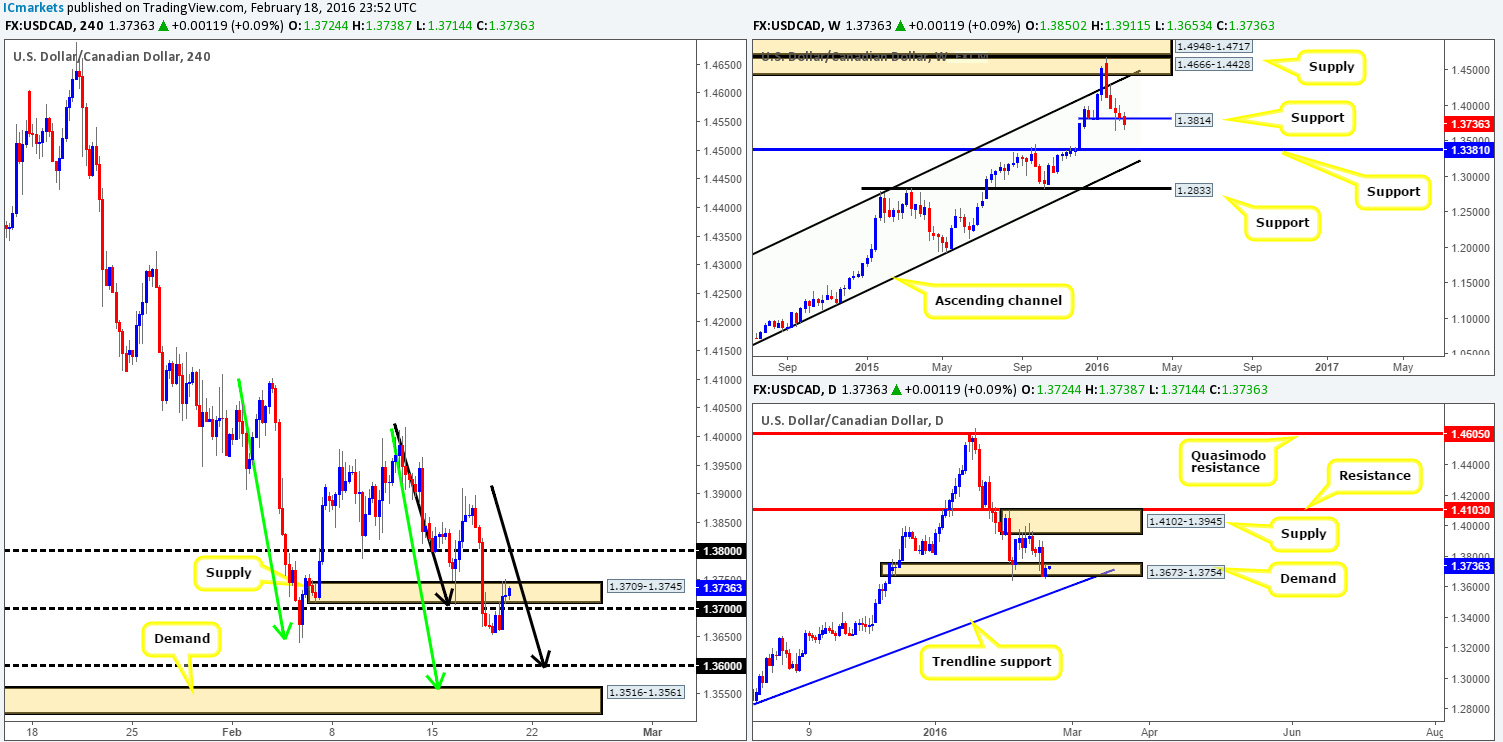
Could this be the end of weekly support at 1.3814? It certainly seems to be the case. However, with today’s docket showing a relatively heavy schedule for the CAD this afternoon, things could possibly change before the week’s out, so best to wait for the weekly candle to close up shop before making judgment. Looking at the daily chart, demand at 1.3673-1.3754 continues to hold. Nevertheless, the response from here appears soft at best in our book, which could encourage continuation selling down to the long-term daily trendline extended from the low 1.1919.
Stepping across to the H4 chart, the recently broken demand at 1.3709-1.3745 is currently being retested as supply. Should this area hold, we could see this pair clock in new lows down to psychological support 1.3600, followed closely by demand drawn from 1.3516-1.3561. As we mentioned in Thursday’s report, the H4 chart also appears to be chalking up two AB=CD bull patterns on approach to the above said supports. We favor a bounce from demand rather than 1.3600. Here’s why:
- The H4 demand lurks a mere 40 pips below 1.3600, and this will likely act as a magnet for price to fake the stops below 1.3600 into this said demand.
- The long-term daily trendline extended from the low 1.1919 beautifully intersects the H4 demand thus adding weight to this area.
Despite the confluence seen at this H4 demand, nevertheless, we would highly recommend not entering here with a pending order since weekly action is presently showing room for a move lower to support at 1.3381.
Levels to watch/live orders:
- Buys: 1.3600 [Tentative – confirmation required] (Stop loss: dependent on where one confirms this level). 1.3516-1.3561 [Tentative – confirmation required] (Stop loss: dependent on where one confirms this area).
- Sells: Flat (Stop loss: N/A).
USD/CHF:
The USD/CHF, as you can see from the H4 chart, rallied for a fifth consecutive day yesterday, resulting in price connecting with mid-level resistance 0.9950. Shorting from this hurdle initially seemed attractive considering it held prices lower back on the 5th February, and also due to the corresponding daily supply present at 0.9958-1.0036. The only drawbacks for us were the fact that the weekly resistance area at 0.9796-0.9902 does not really appear steady at the moment, and there is a much more tempting number to trade above it at 1.0000 (parity).
Given the above points, buying this pair, even though it has rallied for five straight days, is not something we’d label a high-probability trade. Selling from 1.0000 on the other hand seems like a reasonable possibility considering how many traders watch this number, and the fact that the 61.8% Fibonacci level lurks just above at 1.0027. We would insist on waiting for lower timeframe confirmation prior to executing a trade here though since not only are fakeouts possible here, we’d also be going against weekly structure at that point (see above).
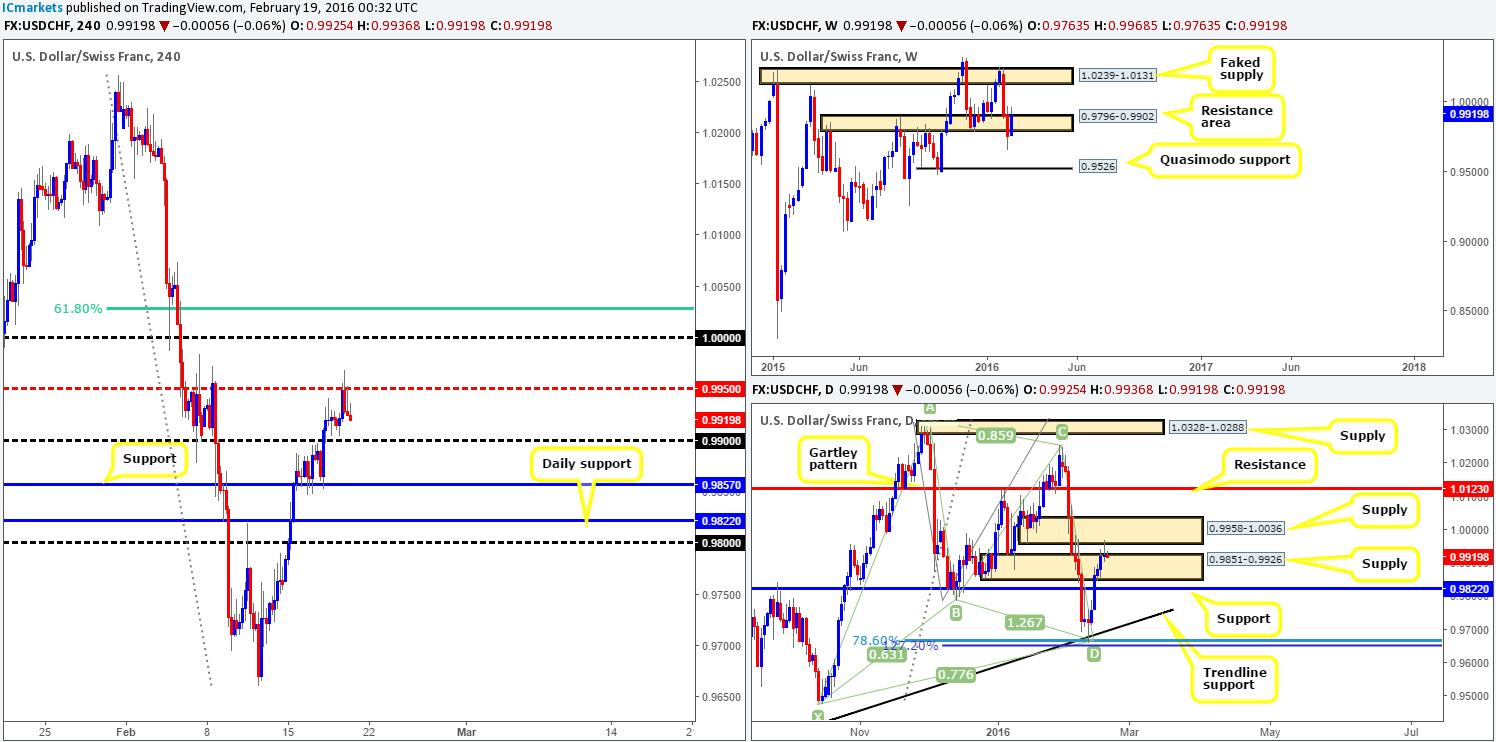
Levels to watch/live orders:
- Buys: Flat (Stop loss: N/A).
- Sells: 1.0000 [Tentative – confirmation required] (Stop loss: dependent on where one confirms this level).
DOW 30:
Following Wednesday’s advance north, yesterday’s activity was, as you can see, far more subdued. Session highs were recorded at 16495 whilst H4 demand managed to bolster this market during the day. For those who read our previous report on the DOW (http://www.icmarkets.com/blog/thursday-18th-february-daily-technical-outlook-and-review/) you may recall us mentioning to watch for a slight break above the current H4 supply and a retest of it as demand. The break did occur but the zone seems to be struggling to hold as demand at the moment. Could this simply be a rather large fake above this H4 area and the 16435 daily level? If this is the case, be prepared for a sell-off today as the next downside target in view is H4 demand at 16110-16211 which sits directly above daily support at 16083.
Although the above is valid, we’re still unsure due to the recent buying seen from weekly support at 15978. Given this, we’d much prefer to be on the buy-side of this market, but by the looks of things that does not look like it’s going to happen today. That being the case, unless the 16486-16425 zone begins holding as demand in order for us to begin looking for confirmed longs up to the H4 Quasimodo resistance at 16593, our team will remain on the sidelines going into the weekend.
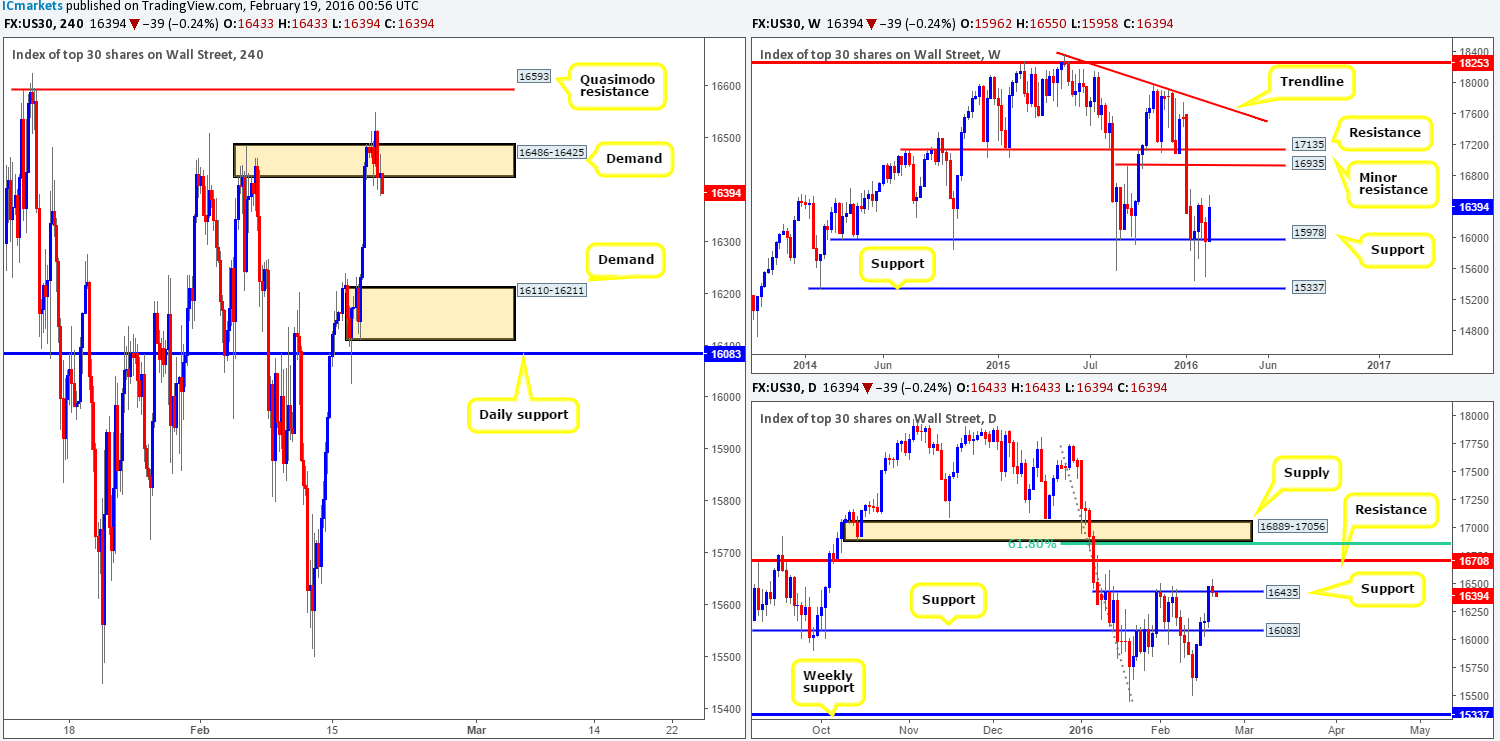
Levels to watch/live orders:
- Buys: 16486-16425 [Tentative – confirmation required] (Stop loss: dependent on where one confirms this area).
- Sells: Flat (Stop loss: N/A).
XAU/USD: (Gold)
Beginning from the top this morning, Gold has responded beautifully from not only the broken supply (now demand) at 1205.6-1181.2, but also the recently broken weekly wedge resistance taken from the high at 1485.3. In the event that bids remain stable, there’s a possibility the yellow metal may cross paths with supply seen overhead at 1307.4-1280.0. Turning our attention to the daily chart, the small demand at 1205.6-1199.9, along with yesterday’s bullish inside candle pattern saw prices advance close to $23 in value.
Zooming in and looking at the H4 chart, we suggested that the bearish pennant pattern was likely going to fail due to what was being seen on the higher-timeframe picture. In this case, we happened to be correct. However, it did not give us the trade we wanted since to buy this market we required price to retest resistance at 1212.2 as support beforehand.
Going forward, market action is now trading from H4 supply at 1239.9-1235.7, which could potentially force prices back down to retest support at 1212.2 today. By and large, our team is bullish due to where price is positioned on the higher timeframes (see above), so we may look to buy from 1212.2 should it be tested today. Caution is advised here, however, since a fakeout below this support into the daily demand lurking just below at 1205.6-1199.9 is a strong possibility. Therefore, we’ll only consider a trade long from here if and only if lower timeframe confirmation is seen.
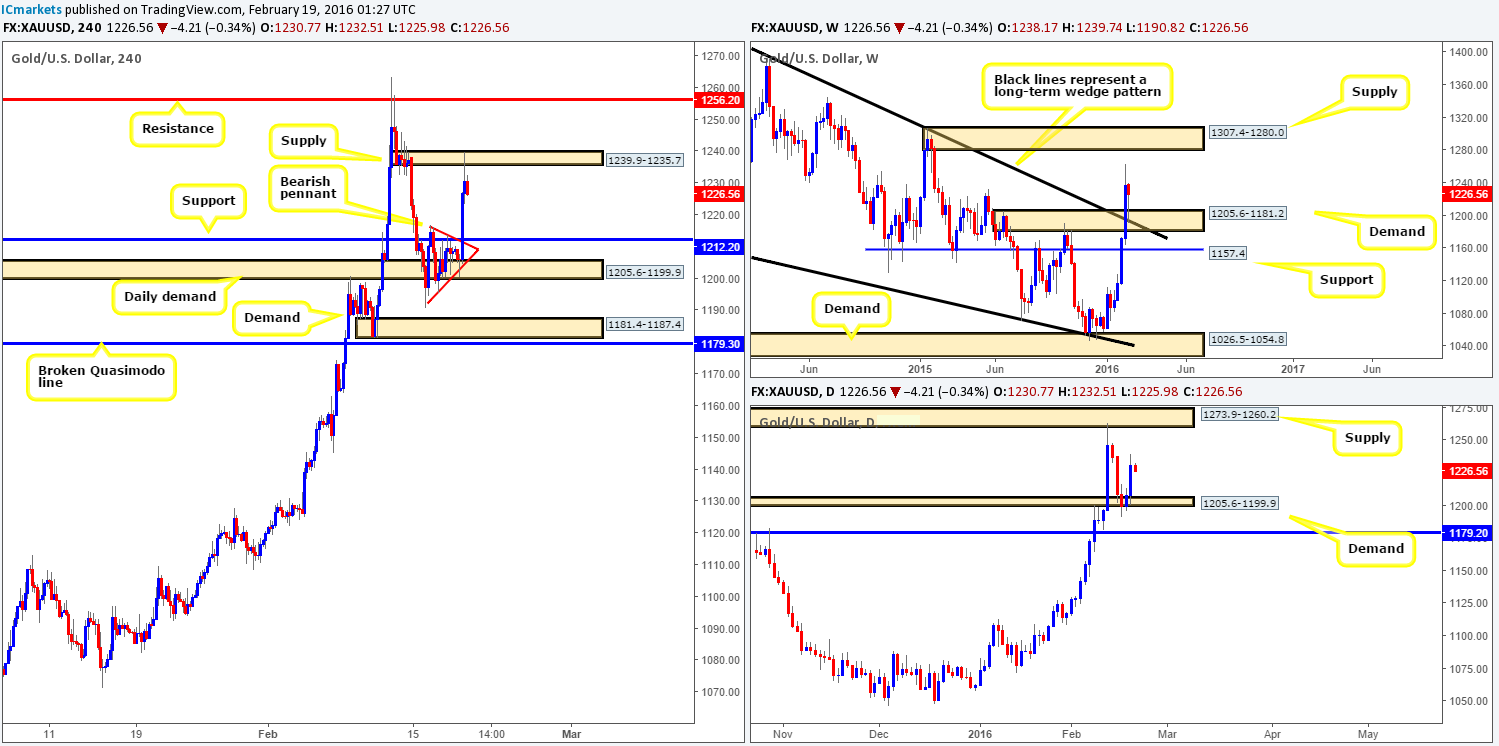
Levels to watch/live orders:
- Buys: 1212.2 [Tentative – confirmation required] (Stop loss: dependent on where one confirms this level).
- Sells: Flat (Stop loss: N/A).


