A note on lower timeframe confirming price action…
Waiting for lower timeframe confirmation is our main tool to confirm strength within higher timeframe zones, and has really been the key to our trading success. It takes a little time to understand the subtle nuances, however, as each trade is never the same, but once you master the rhythm so to speak, you will be saved from countless unnecessary losing trades. The following is a list of what we look for:
- A break/retest of supply or demand dependent on which way you’re trading.
- A trendline break/retest. Buying/selling tails – essentially we look for a cluster of very obvious spikes off of lower timeframe support and resistance levels within the higher timeframe zone.
- Candlestick patterns. We tend to only stick with pin bars and engulfing bars as these have proven to be the most effective.
For us, lower timeframe confirmation starts on the M15 and finishes up on the H1, since most of our higher timeframe areas begin with the H4. Stops usually placed 5-10 pips beyond your confirming structures.
EUR/USD: (Slightly revised)
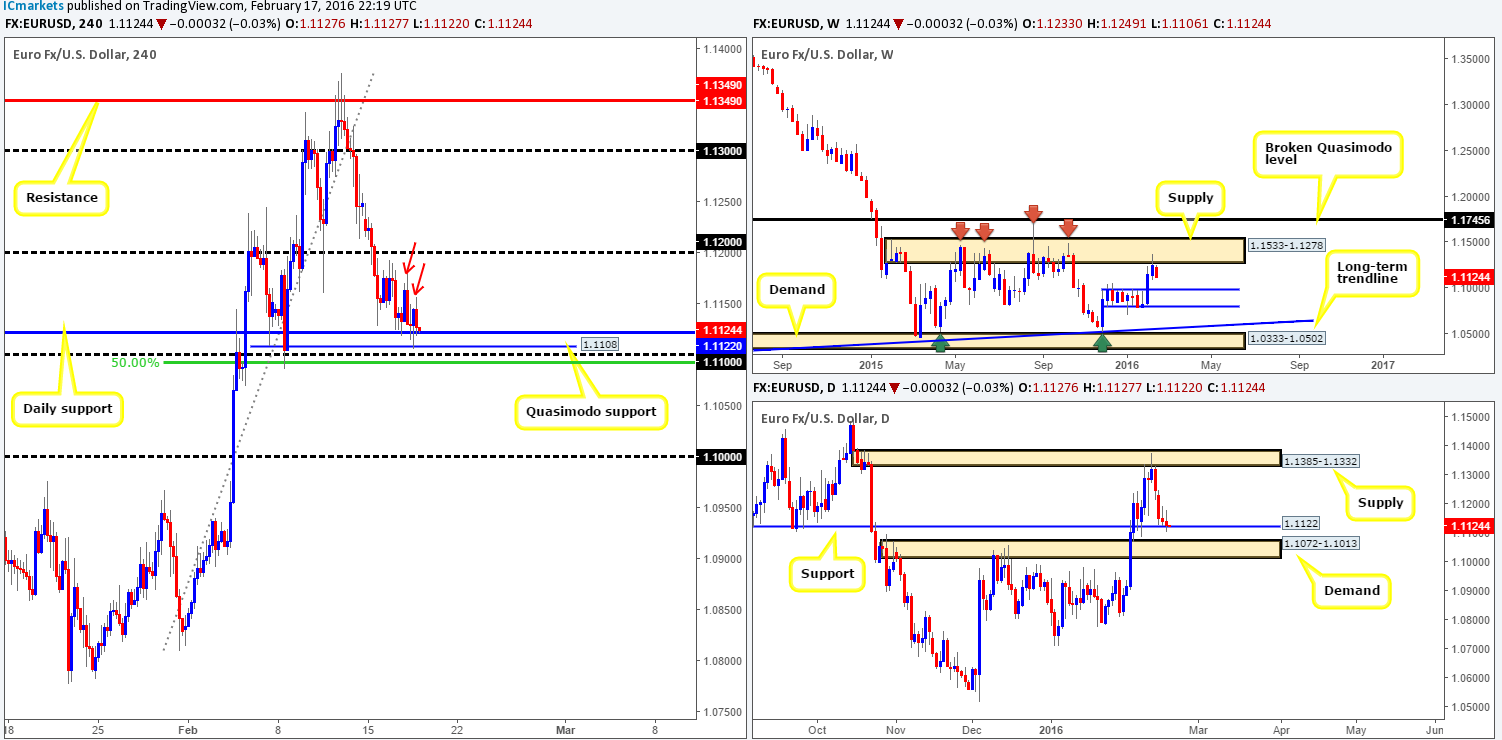
Going into the early hours of yesterday’s sessions the single currency extended north. Price made a run to highs of 1.1179 before collapsing lower and whipsawing through daily support at 1.1122 to connect with the H4 Quasimodo support at 1.1102, which, as you can see, has so far held firm. In Wednesday’s report (http://www.icmarkets.com/blog/wednesday-17th-february-heavy-afternoonevening-for-the-u-s-dollar-today-remain-vigilant/), we spoke about entering long from this region with lower timeframe confirmation. Price has, at least for us, shown that the EUR may want to trade higher as the M15 chart broke above a significant high at 1.1149, which shows space to move higher. However, although there is confirmation here, we decided to pass on this entry long for two reasons. The first, lower lows are currently forming (marked with red arrows) each time the market rebounds from an area of support – not a good sign. Secondly, let’s not forget that weekly action is currently trading from supply at 1.1533-1.1278.
With the above points in mind, today’s spotlight will firmly be focused on looking for the round number 1.1100 to be consumed. The path south should, as a consequence, be clear down to the large psychological support 1.1000. Granted, by shorting the retest of 1.1100, you’d effectively be selling into daily supply at 1.1072-1.1013. Nevertheless, at the same time, weekly flow would be on your side (see above) as the chart shows a clear path south down to at least support drawn from 1.0983.
Levels to watch/live orders:
- Buys: Flat (Stop loss: N/A).
- Sells: Watch for bids to be consumed around 1.1100 and look to trade any retest from this area thereafter (lower timeframe confirmation required).
GBP/USD:
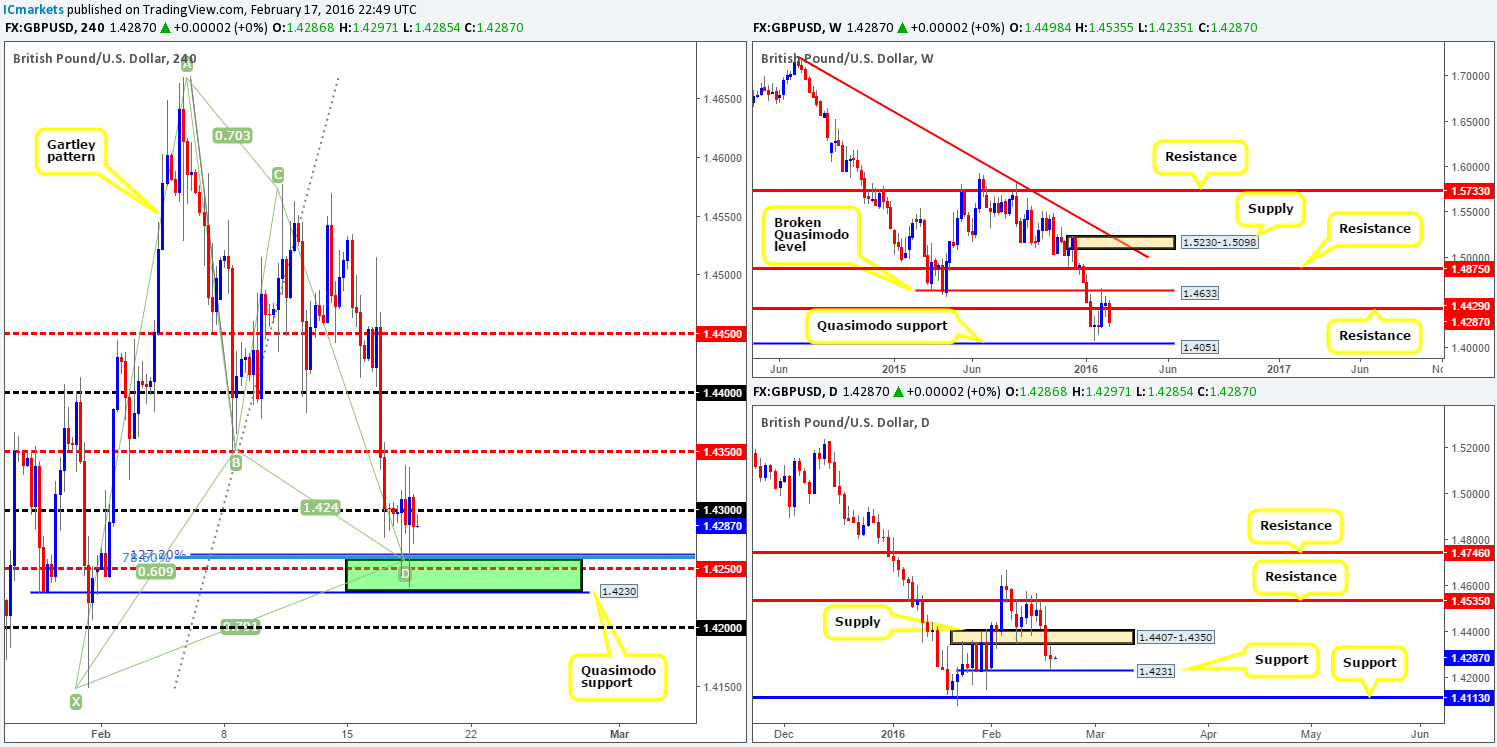
For those who read Wednesday’s report on Cable (http://www.icmarkets.com/blog/wednesday-17th-february-heavy-afternoonevening-for-the-u-s-dollar-today-remain-vigilant/), you may recall that we spoke about entering long from the base of a H4 Harmonic Gartley pattern around the 1.4258 mark. Additional confluence was also seen here from the mid-level number at 1.4250 and a H4 Quasimodo support at 1.4230, which blends nicely with daily support drawn from 1.4231.
We managed to pin down a trade entry on the M15 timeframe yesterday afternoon around 14.15pm GMT at 1.42589, after price rebounded from the above said H4 area and took out a truckload of tops on the M15 around the 1.4307 region. Partial profits have already been taken at 1.4300 and the stop is sitting at breakeven plus three right now. The reason for us taking profits so quickly is due to daily action coming so very close to tagging the underside of daily supply at 1.4407-1.4350. This could effectively push this market lower today and we did not want this winner to end in a loser!
Ultimately, a close above 1.4300 on a H4 basis would be fantastic today since this could set the stage for a continuation move north up to the mid-level number 1.4350 – the lower limit of daily supply (further profits would be liquidated here). It will be interesting to see how this pans out!
Levels to watch/live orders:
- Buys: 1.42589 [LIVE] (Stop loss: Breakeven).
- Sells: Flat (Stop loss: N/A).
AUD/USD:
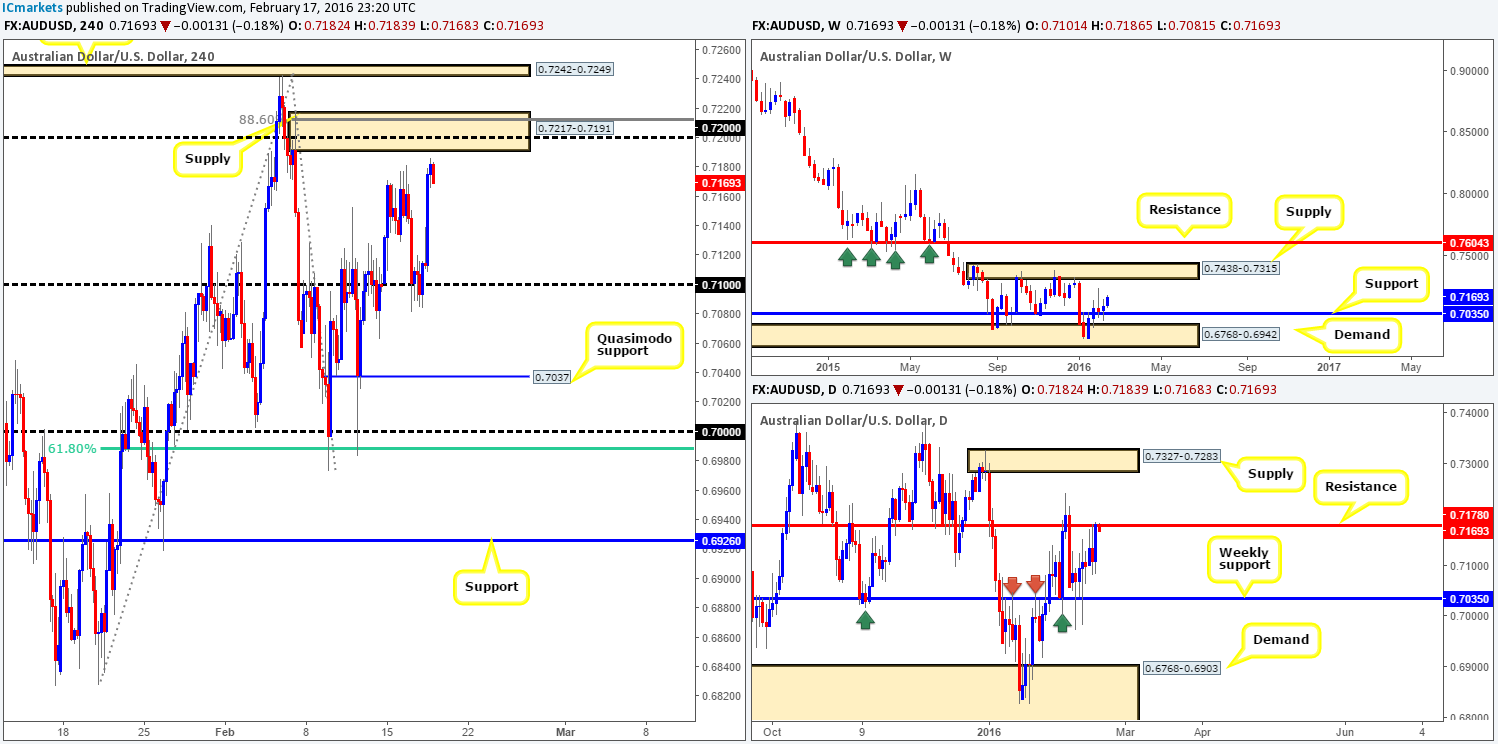
Beginning from the top this morning, weekly action is currently seen holding firm ground above support at 0.7035. Provided that the commodity currency continues to show strength from here, we could potentially see the pair rally up to supply penciled in at 0.7438-0.7315. Turning our attention to the daily chart, however, price is seen kissing the underside of resistance drawn from 0.7178. One only has to look to the past to see how significant this level is! Zooming in and looking at the H4 chart we can see that psychological support 0.7100 held steady yesterday, pushing price to highs of 0.7186 on the day – a stone’s throw from supply at 0.7217-0.7191.
In a nutshell, what we have here is the weekly showing room to advance and both the daily and H4 at sell zones (see above). Given this, and the fact that the H4 supply boasts a deep 88.6% Fibonacci resistance at 0.7212 along with psychological resistance just below at 0.7200, we believe price will bounce from here. Despite this, trading this area without lower timeframe confirmation is a risky trade in our book, since weekly flow could easily wipe out both the daily and H4 levels and continue trading north. Should we manage to pinpoint a setup in this region today, we’ll be looking to take partial profits at the first demand printed prior to hitting our zone, and will likely place our stop above the H4 supply itself.
Levels to watch/live orders:
- Buys: Flat (Stop loss: N/A).
- Sells: 0.7217-0.7191 [Tentative – confirmation required] (Stop loss: dependent on where one confirms this area).
USD/JPY:
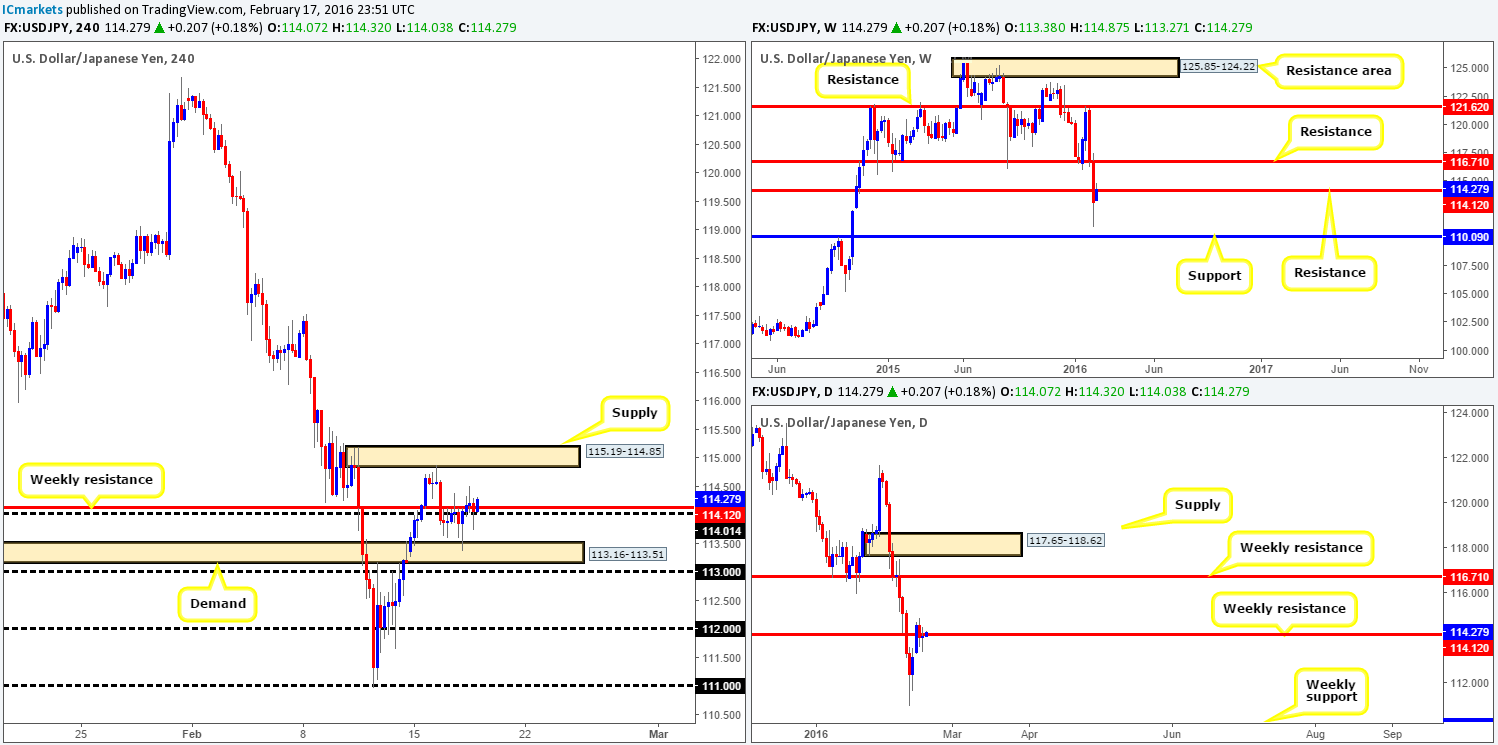
The USD/JPY came alive going into London trading yesterday, as price struck the top-side of H4 demand coming in at 113.16-113.51. As shown on the H4 chart this forced the pair to highs of 114.50, before reversing tracks into the U.S. open.
There is clearly uncertainty being presented in this market at the moment around the current weekly resistance hurdle at 114.12 – hence the daily indecision candle printed yesterday. Based on recent price action it’s very difficult to know which direction this market is likely headed – here is what we have jotted down so far:
For buys, we would not be confident until a sustained move above the H4 supply zone penciled in at 115.19-114.85 has taken place. This should not only confirm bid strength from the weekly level mentioned above, but also open the gates for prices to challenge the 116.00 figure.
- For sells, the 113.00 psychological support would need to be taken out. This should confirm selling strength from the weekly level discussed above and also clear the path south down to the112.00 handle.
Trading either side is valid in our opinion, as long as one waits for a confirmed retest of the broken area.
Levels to watch/live orders:
- Buys: Watch for offers to be consumed around 115.19-114.85 and look to trade any retest seen thereafter (lower timeframe confirmation required).
- Sells: Watch for bids to be consumed around 113.00 and look to trade any retest seen thereafter (lower timeframe confirmation required).
USD/CAD:
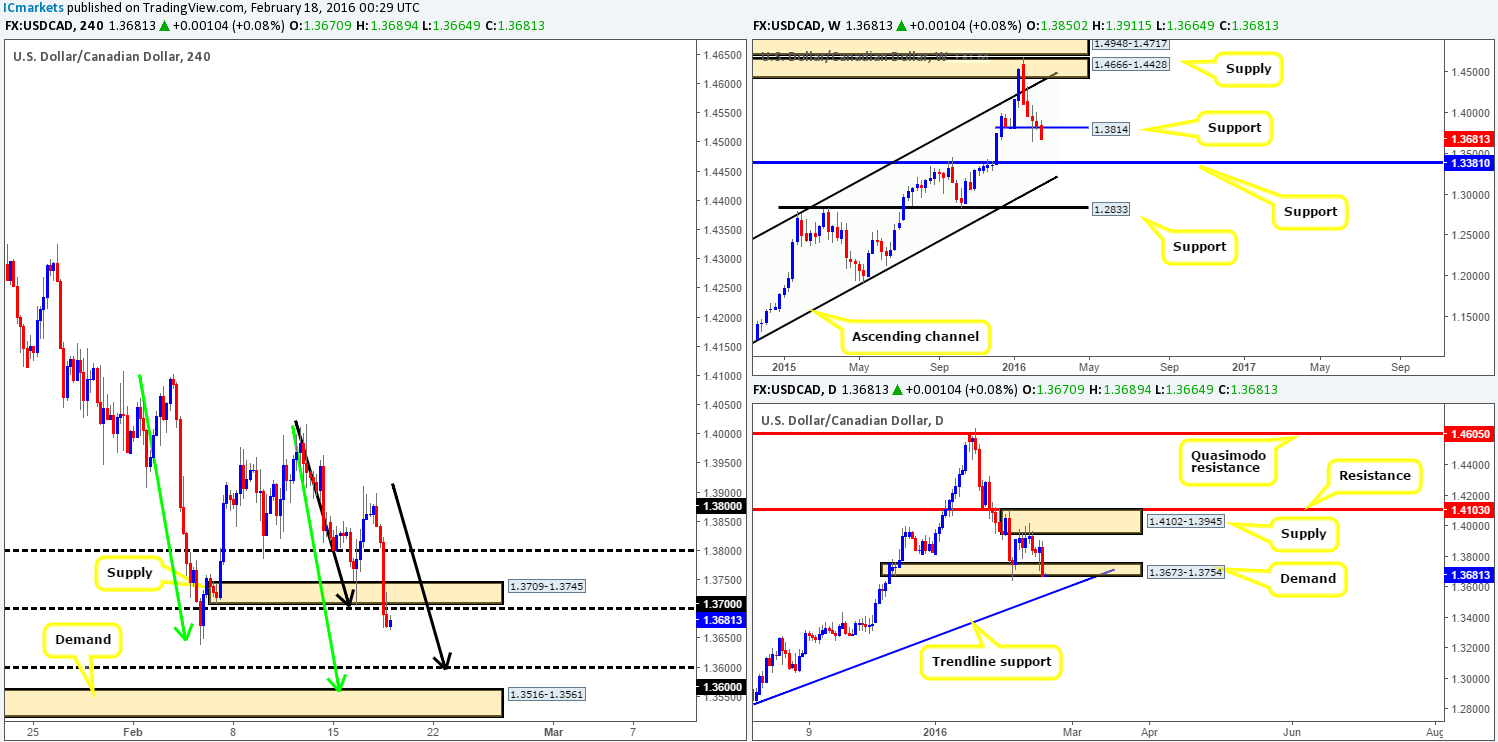
The USD/CAD took a hit to the mid-section yesterday as Oil found support around the 28.90 region, losing close to 200 pips on the day! Consequent to this, there is some very interesting price action at play here right now. Beginning with the H4, both demand (now acting supply) at 1.3709-1.3745 and psychological support 1.3700 were wiped out amid yesterday’s bearish assault. This move potentially opened the trapdoor for further selling down to at least the 1.3600 figure, followed closely by demand drawn from 1.3516-1.3561. Furthermore, the H4 chart appears to be chalking up two AB=CD bull patterns on approach to the above said areas. We favor a bounce from demand rather than 1.3600. Here’s why:
- The H4 demand lurks a mere 40 pips below 1.3600, and this will likely act as a magnet for price to fake the stops below 1.3600 into this said demand.
- The long-term daily trendline extended from the low 1.1919 beautifully intersects the H4 demand thus adding weight to this area.
With the daily demand at 1.3673-1.3754 appearing to be on its last legs at the moment, it is likely we’ll see the H4 demand at 1.3516-1.3561 come into play today, as the daily trendline is the next objective to reach. Despite the confluence seen at this H4 demand, nevertheless, we would highly recommend not entering here with a pending order since weekly action is presently showing room for a move lower to support at 1.3381.
Levels to watch/live orders:
- Buys: 1.3600 [Tentative – confirmation required] (Stop loss: dependent on where one confirms this level). 1.3516-1.3561 [Tentative – confirmation required] (Stop loss: dependent on where one confirms this area).
- Sells: Flat (Stop loss: N/A).
USD/CHF:
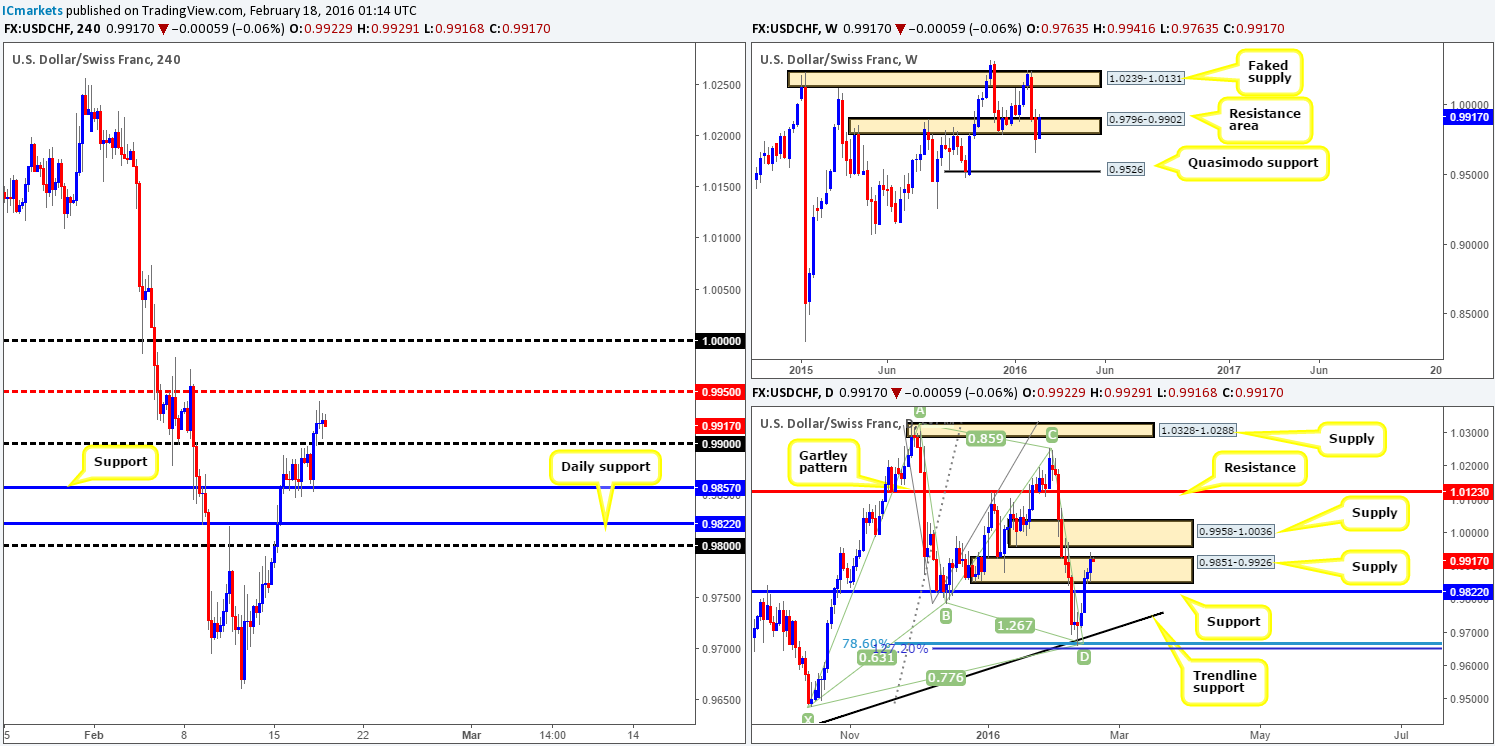
Kicking off this morning’s analysis with a look at the weekly chart shows that price recently poked its head above the resistance area visible at 0.9796-0.9902. It’s difficult to tell whether the break of this area is legit, however, until the candle closes. Down on the daily timeframe, price also spiked above supply coming in at 0.9851-0.9926 which could lead to further buying up to the underside of supply chalked up at 0.9958-1.0036.
Moving down to the H4 timeframe it’s clear to see prices were heavily bid going into yesterday’s London session, ending with the market punching through offers at psychological resistance 0.9900 and reaching highs of 0.9941 on the day.
In light of the above, buying this pair is out of the question given higher-timeframe action and the mid-level resistance 0.9950 lurking just above. A break above 0.9950 would likely place parity in the limelight. Buying the break of 0.9950 into daily supply at 0.9958-1.0036 would not be something we’d be comfortable with. Selling from 1.0000 on the other hand seems like a reasonable possibility considering how many traders watch this number – we would insist on waiting for lower timeframe confirmation prior to executing a trade though since fakeouts here are likely.
Levels to watch/live orders:
- Buys: Flat (Stop loss: N/A).
- Sells: 1.0000 [Tentative – confirmation required] (Stop loss: dependent on where one confirms this level).
DOW 30:
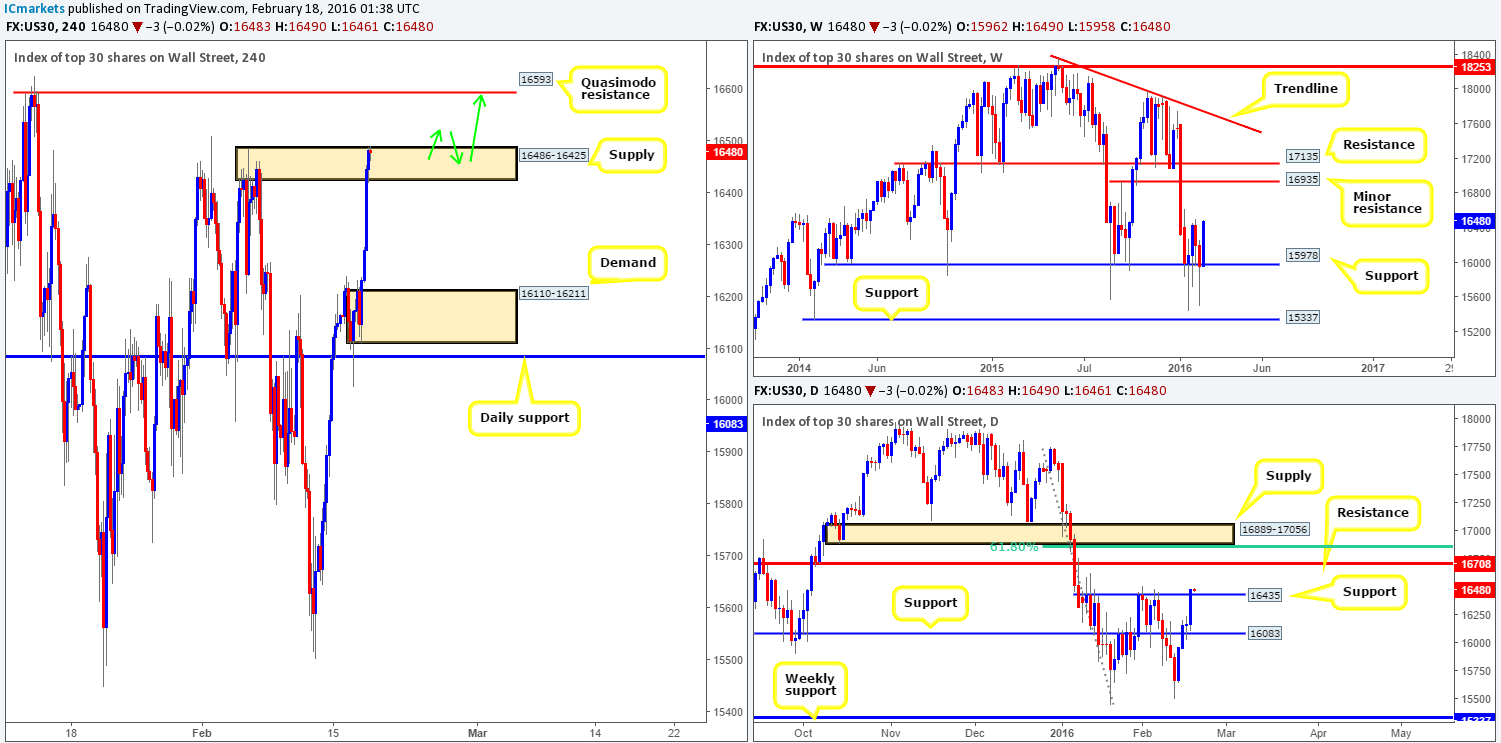
The DOW was in spectacular form yesterday, recording over 300 points into the day’s close 16483. From the weekly chart, this rally, at least from a technical standpoint, should not come as much of a surprise since weekly support at 15978 continues to bolster this market. In consequence to the recent surge in buying, price closed above daily resistance (now potential support) at 16435. Providing that the bulls remain forceful above this roadblock today, its possible further buying will be seen up to daily resistance drawn from 16708.
Breaking into the H4 chart, however, price is now seen tackling the extremes of a supply zone seen at 16486-16425. From this angle, the bears are not having much luck at the moment, and considering the higher-timeframe picture (see above), this will likely end in a push towards the H4 Quasimodo resistance taken from 16593.
Therefore, an ideal situation today would be a slight break above the current H4 supply and a retest of it as demand. It would be here that should a lower timeframe buy setup form, our team would jump in long, targeting 16593, followed closely by daily resistance mentioned above at 16708 (see green arrows).
Levels to watch/live orders:
- Buys: Watch for offers to be consumed around 16486-16425 and look to trade any retest seen thereafter (lower timeframe confirmation required).
- Sells: Flat (Stop loss: N/A).
XAU/USD: (Gold)
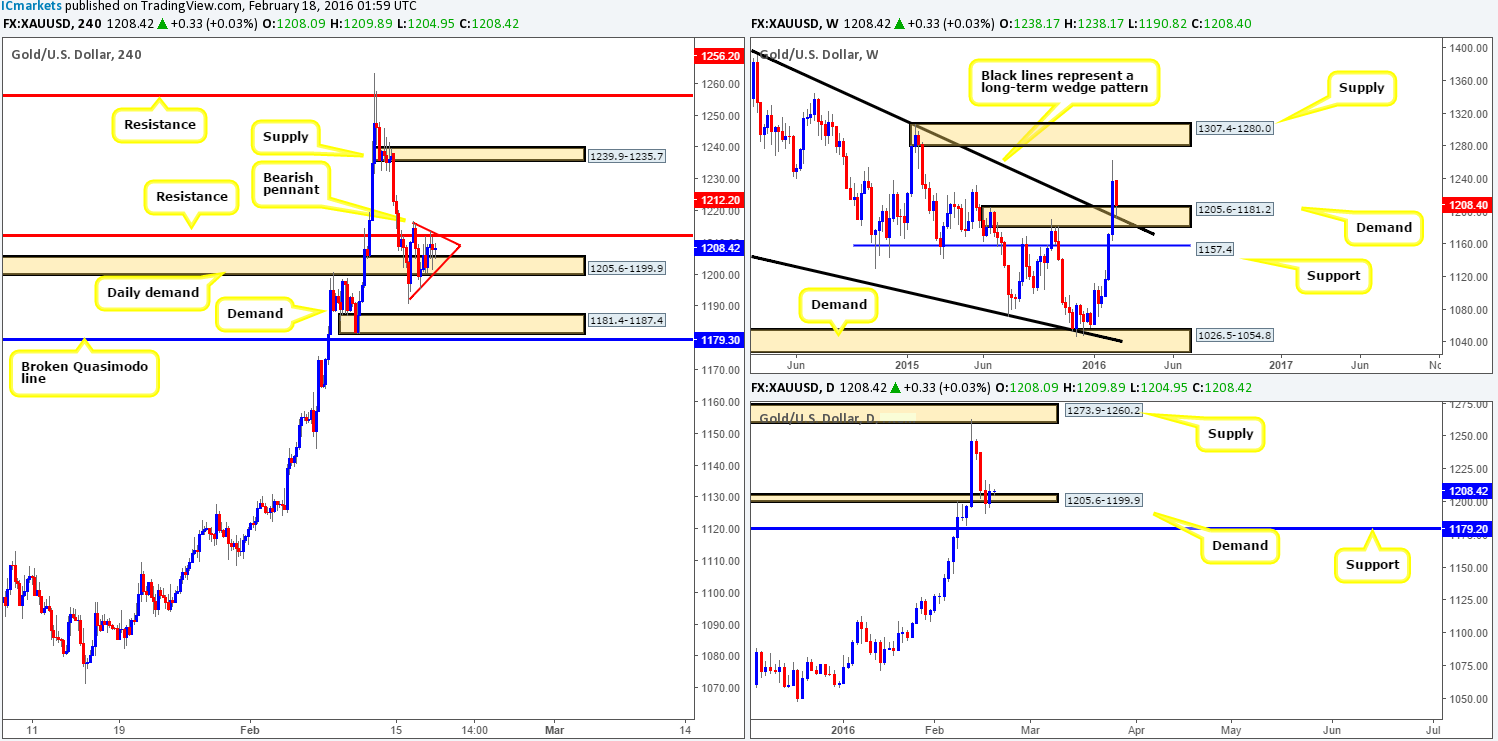
Coming at you directly from the weekly chart this morning, the yellow metal is seen rebounding from not only the broken supply (now demand) at 1205.6-1181.2, but also the recently broken weekly wedge resistance taken from the high at 1485.3. Climbing down into the pits of the daily timeframe shows us that the buyers and sellers continue to battle for position around demand chalked up at 1205.6-1199.9. Yesterday’s action, as you can see, also printed a nice-looking bullish inside candle pattern, which could potentially signal direction today.
Looking at the H4 chart, however, the buyers and sellers appear to be confined within a bearish pennant formation (1190.8/1216.8). Traders may want to be careful trading this pattern as the majority will be looking for a continuation move here. Nevertheless, with what we’ve noted on the higher timeframes (see above) we have absolutely no interest in selling the break of this pattern! Instead, what we’re currently watching for is a sustained move above H4 resistance at 1212.2. This would likely open the flood gates up to H4 supply at 1239.9-1235.7 and at the same time confirm bullish strength from the higher timeframe zones discussed above.
To trade this potential move, however, we’d need to see price retest 1212.2 as support together with a lower timeframe buy setup – a break of supply, a break of a trendline or a collection of buying tails planted at or very close to the traded level is what we generally look for.
Levels to watch/live orders:
- Buys: Watch for offers to be consumed around 1212.2 and look to trade any retest seen thereafter (lower timeframe confirmation required).
- Sells: Flat (Stop loss: N/A).