
Key risk events today:
BoJ Monetary Policy Statement and Press Conference; UK Retail Sales m/m; German ifo Business Climate; Canada Core Retail Sales m/m and Retail Sales m/m; US CB Leading Index m/m.
(Previous analysis as well as outside sources – italics).
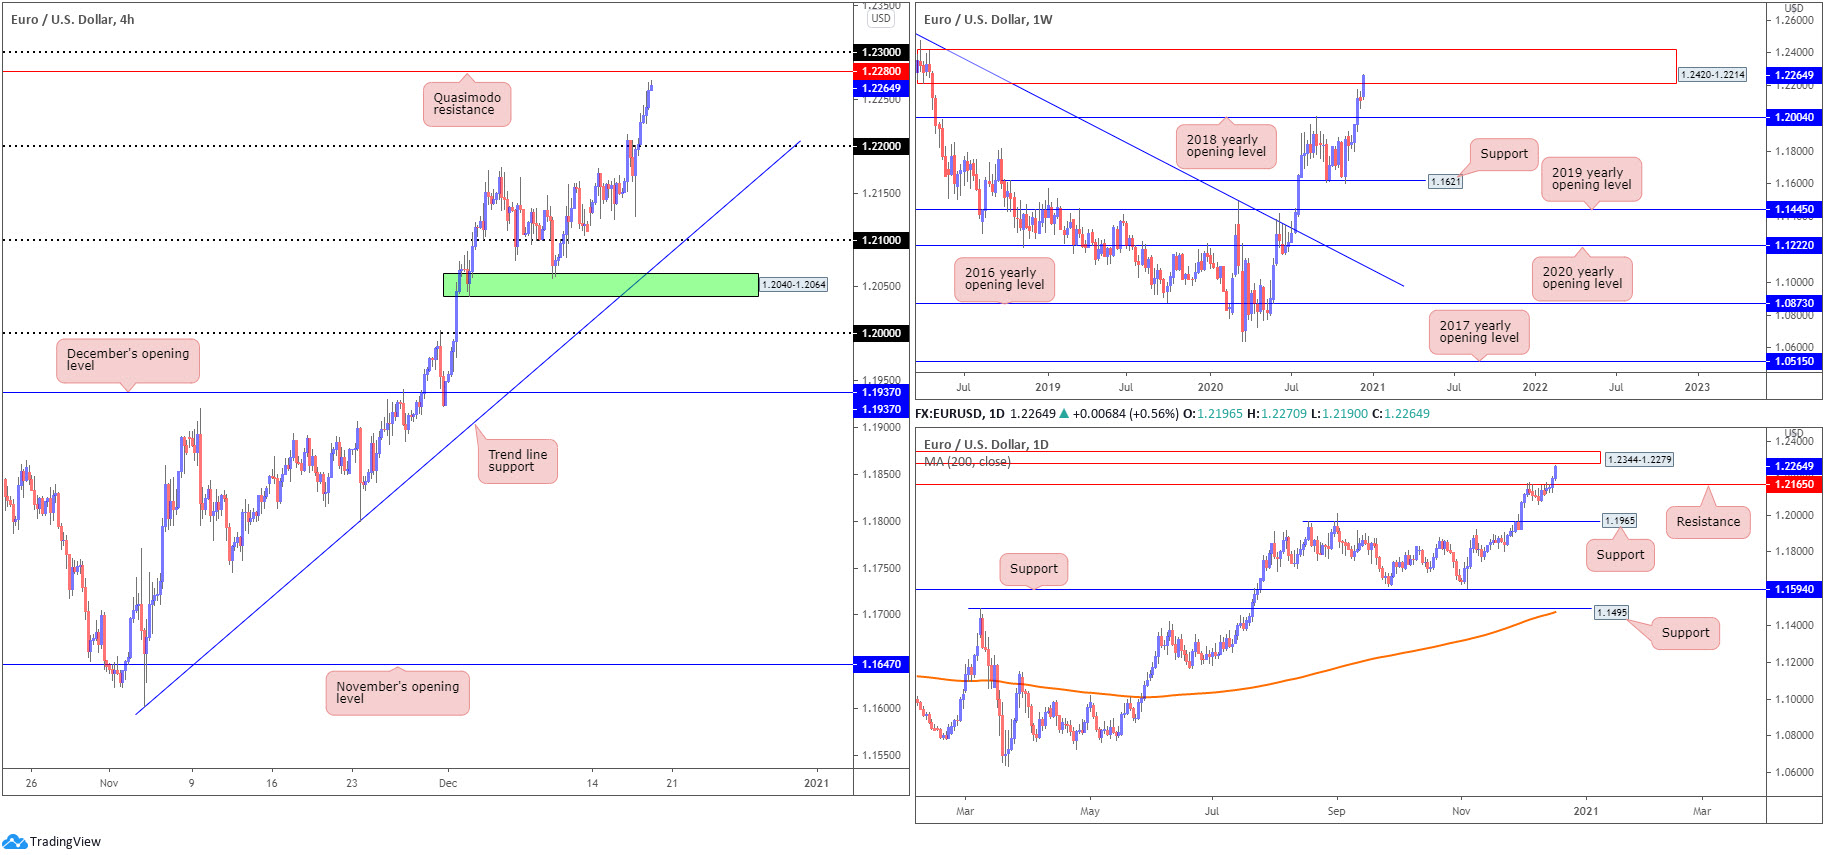
EUR/USD:
USD weakness, fuelled by Thursday’s risk-on environment and Fed Chair Powell’s dovish tone in the post-meeting press conference on Wednesday, led EUR/USD to fresh multi-year pinnacles.
Absorbing offers around 1.22 on the H4 scale invited fresh buying yesterday. In the shape of six consecutive bullish candles, H4 price is seen closing in on Quasimodo resistance at 1.2280 and the 1.23 figure.
Across the page on the weekly timeframe, we can see that price, higher by 1.3% on the week, mounted an attack on supply at 1.2420-1.2214. What’s also interesting is daily price is seen nearing supply at 1.2344-1.2279, an area arranged within the aforementioned weekly supply zone.
Areas of consideration:
- Although the uptrend is clear in this market, weekly supply at 2420-1.2214 making an appearance and daily supply nearby at 1.2344-1.2279 could trigger selling. Countertrend traders are likely to take aim at 1.23 and H4 Quasimodo resistance at 1.2280.
- Any reaction from 1.23/1.2280 turns the spotlight back on the 1.22 figure. Overthrowing 1.23/1.2280, nonetheless, signals bullish strength and could see the euro reach for 1.24.
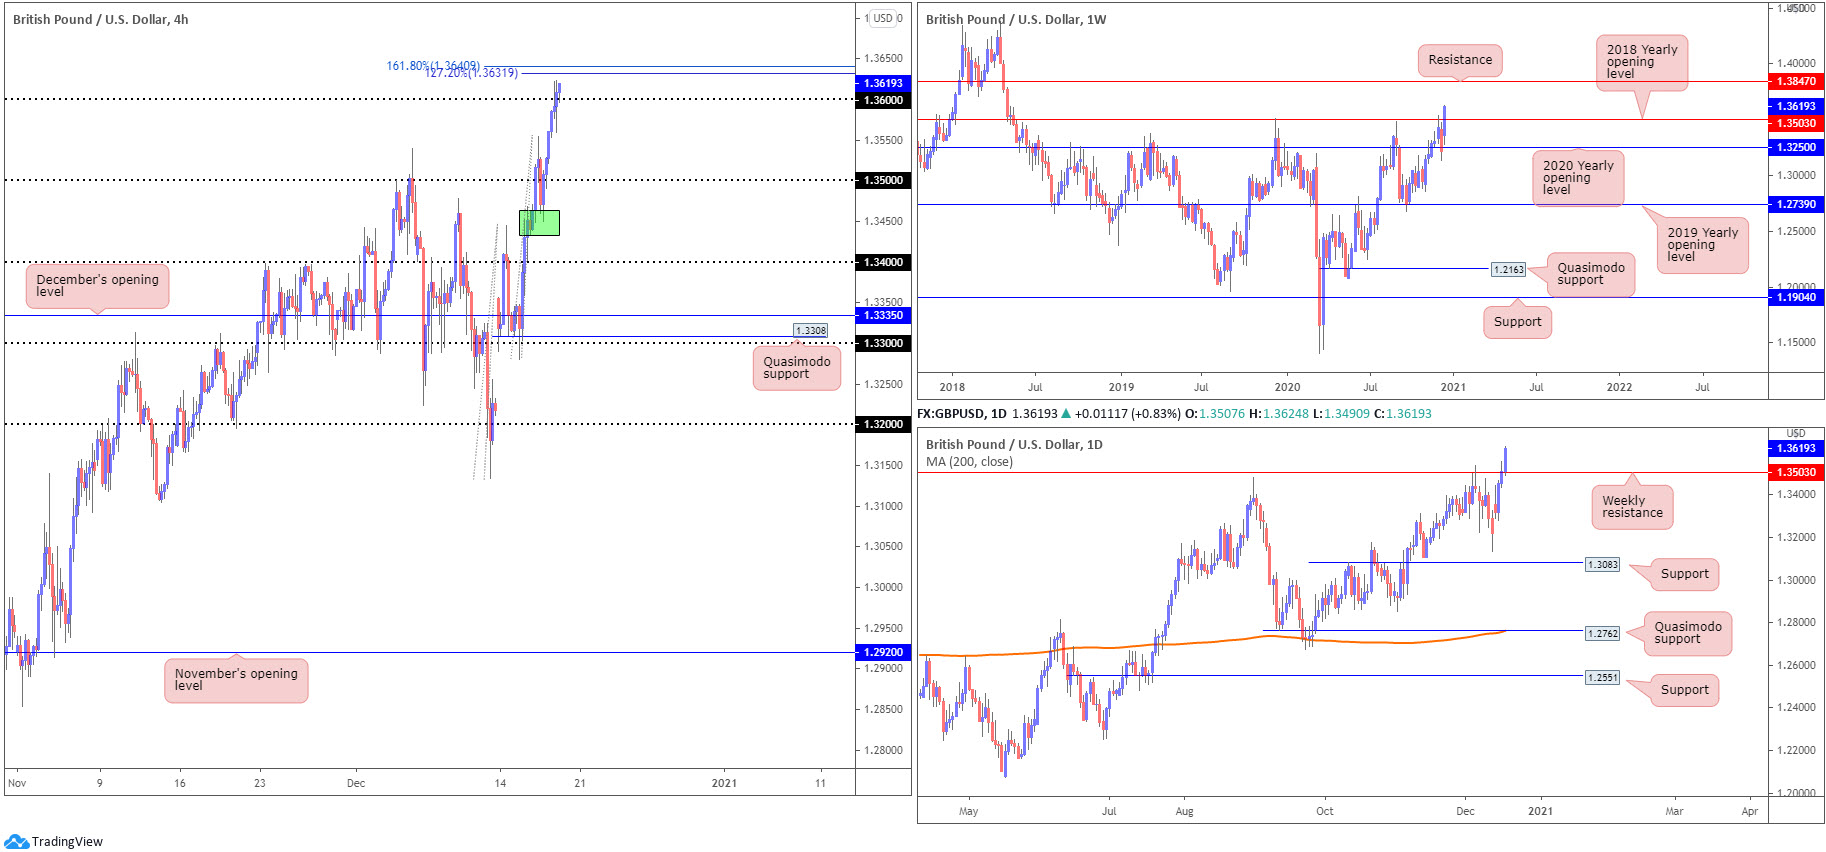
GBP/USD:
Forging fresh multi-year highs, sterling capitalised on USD softness and Brexit optimism Thursday, elbowing through offers around the 1.36 figure and shining the spotlight on nearby 127.2% and 161.8% H4 Fibonacci projection points at 1.3631 and 1.3640, respectively. This followed a recent test of H4 demand around the 1.3450ish range (green).
Weekly resistance at 1.3503 (2018 yearly opening value), as you can see, is under pressure, a level that’s capped upside since June 2018. Closing north of this level highlights resistance at 1.3847. Beyond 1.3503 on the daily scale, we can see resistance forged at 1.3763.
Areas of consideration:
- Buy-stops above 1.36 on the H4 have likely been filled, with offers currently containing upside around 1.3620. The 2% and 161.8% H4 Fibonacci projection points at 1.3631 and 1.3640 likely contain additional offers and could be enough to push back breakout buyers above 1.36. The flip side to this, of course, is buyers push through the noted offers due to both weekly and daily timeframes suggesting thin resistance until around 1.3763.
- A H4 close under 1.36 may spark intraday countertrend selling, while a H4 close north of 1.3640 is likely to give the green light to breakout buying.
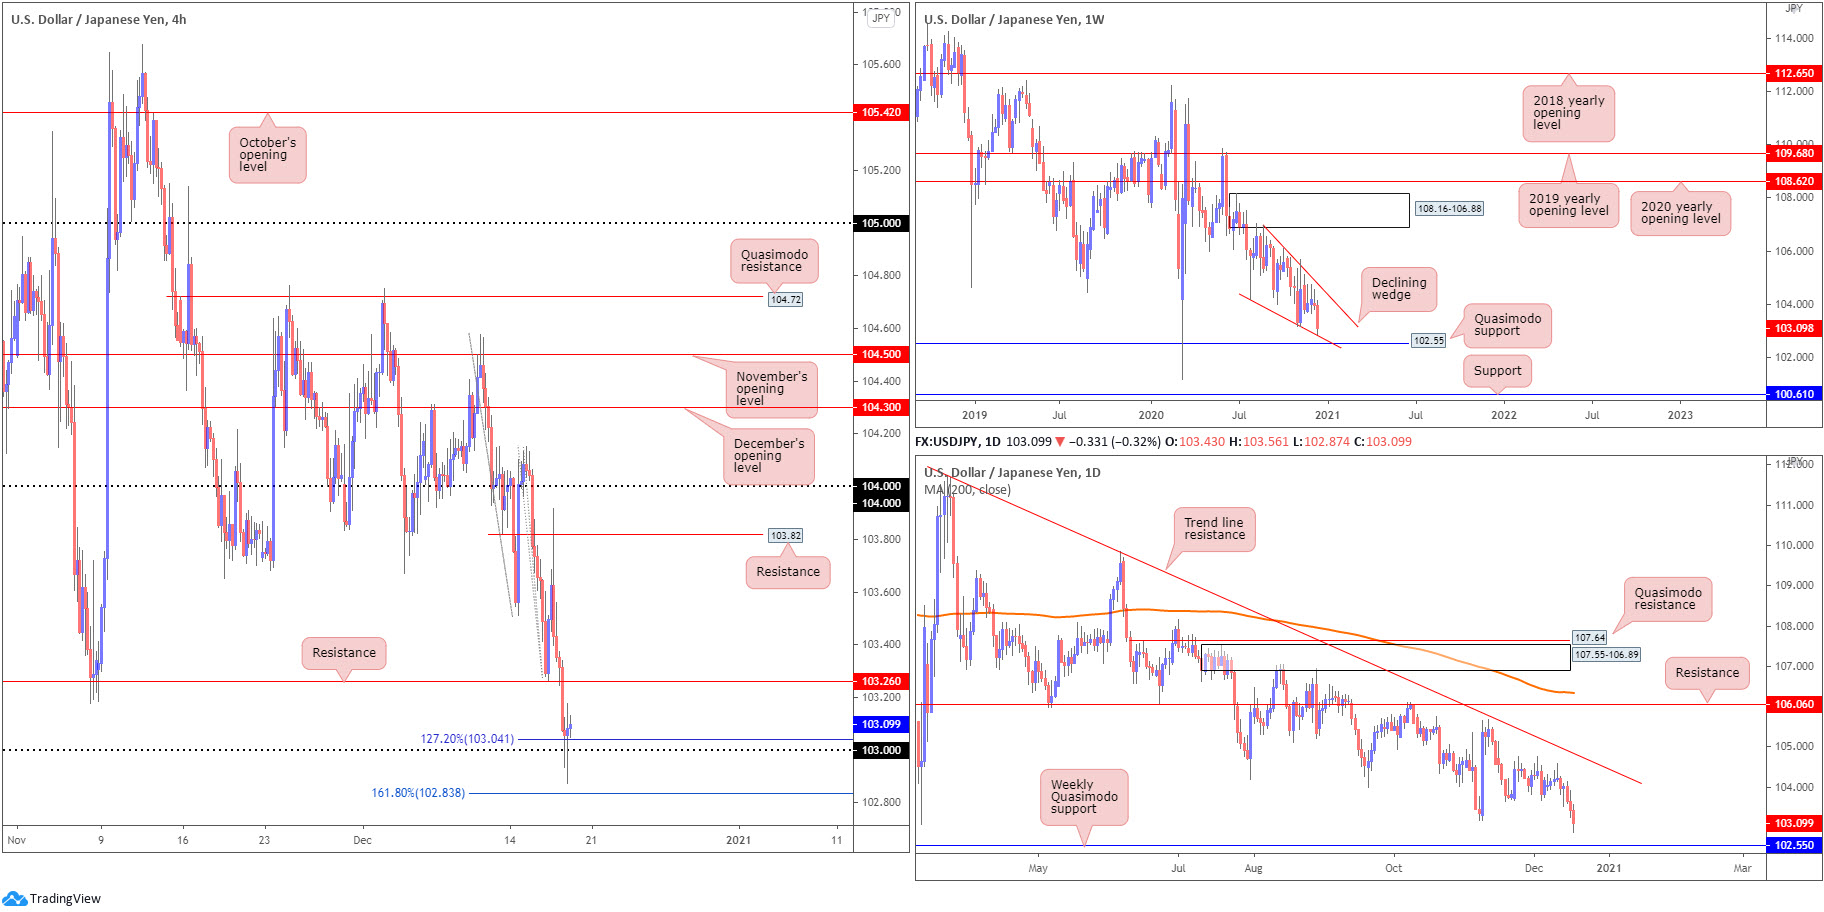
USD/JPY:
Broad dollar softness on Thursday captained USD/JPY to its third consecutive daily loss. Sell-stops beyond the 103 figure on the H4 scale were likely filled as price dipped a toe south of the round number in recent hours. However, downside movement was short-lived as bids directed price back above 103. Fibonacci traders will also acknowledge additional support is seen, in the form of 127.2% and 161.8% Fibonacci projection points at 103.04 and 102.83, respectively.
Based on the weekly timeframe, we can see that since connecting with the underside of supply at 108.16-106.88 in August, price has gradually shifted lower and developed a weekly declining wedge (106.94/104.18). As you can see, downside this week has forced price into close range of the lower edge of the declining wedge. Quasimodo support at 102.55 is also in the picture, with a break revealing support plotted at 100.61. A strong bounce from 102.55, however, may provide enough impetus for buyers to attempt a breakout above the current declining wedge.
From the daily timeframe, the technical landscape reveals price broke through the 103.17 November 6 low, consequently throwing weekly Quasimodo support at 102.55 in the mix.
Areas of consideration:
- 103 figure offering potential support on the H4, bolstered by 127.2% and 161.8% Fibonacci projection points at 103.04 and 102.83. Though do pencil in the possibility of resistance forming around 103.26.
- 103 letting go, however, could spark a bearish theme in the direction of weekly Quasimodo support at 102.55. Conservative sellers will likely seek a 103 retest before committing.
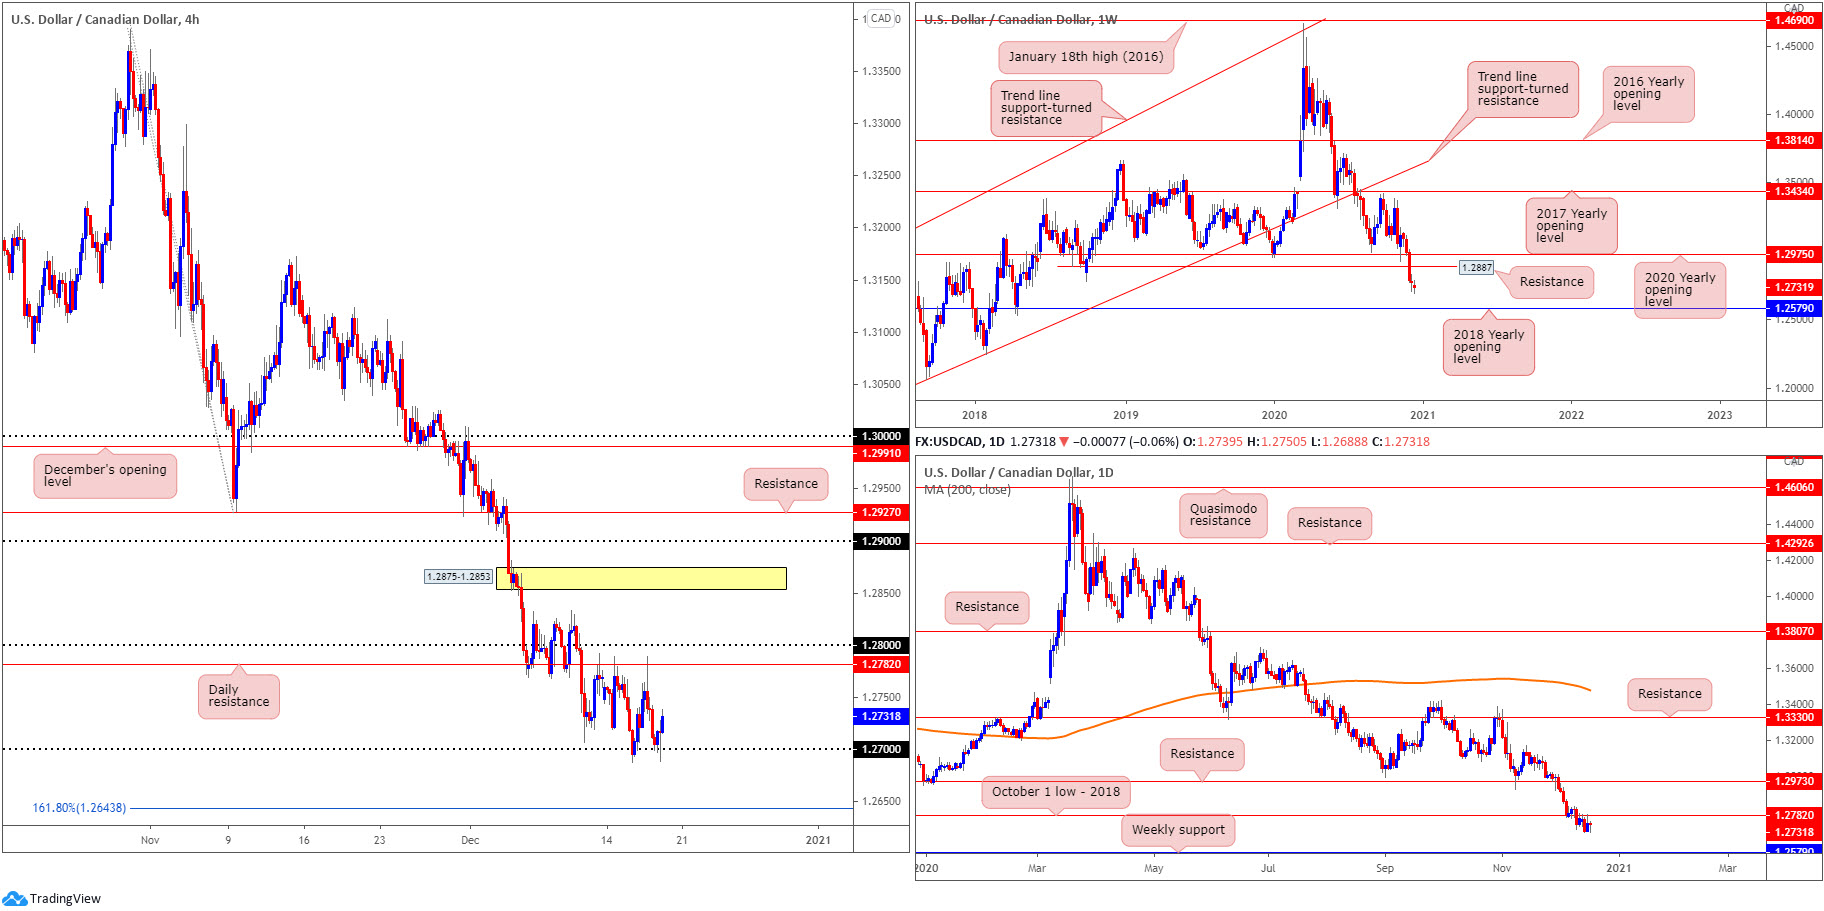
USD/CAD:
Despite the US dollar sinking to multi-year troughs, USD/CAD discovered support off the 1.27 figure on Thursday.
As you can see, price has spent the week fading the underside of daily resistance at 1.2782 (October’s low, 2018), closely shadowed by the 1.28 figure on the H4 scale.
Above 1.28, aside from local tops around 1.2832, supply at 1.2875-1.2853 is visible, while beneath 1.27 the 161.8% Fibonacci projection point can be found at 1.2643.
Price action on the weekly timeframe, as highlighted in recent technical briefings, shows recent weeks witnessed price elbow through the 2020 yearly opening value at 1.2975 and Quasimodo support coming in at 1.2887. With both 1.2975 and 1.2887 depicting resistance, sustained downside places the 2018 yearly opening value at 1.2579 in the firing line. Also important to note is that long-term flow has been pointing lower since topping in March. In conjunction with the weekly timeframe, last week’s selling set aside bids at daily support from 1.2782 (October’s low, 2018), consequently enhancing the weekly timeframe’s bearish stance towards the 2018 yearly opening value.
Areas of consideration:
- The 1.28 figure on the H4 and daily resistance at 1.2782 forms interesting resistance to be mindful of.
- As we remain above 1.27, Wednesday’s highlighted scenario could still emerge: Should H4 secure position south of the 1.27 handle, this will likely have sellers enter flow towards the 161.8% Fibonacci projection point at 1.2643. Follow-through selling beyond 1.2643 is also possible, according to the higher timeframes, suggesting 1.26 could be on the table, followed by weekly support at 1.2579 (the 2018 yearly opening value).
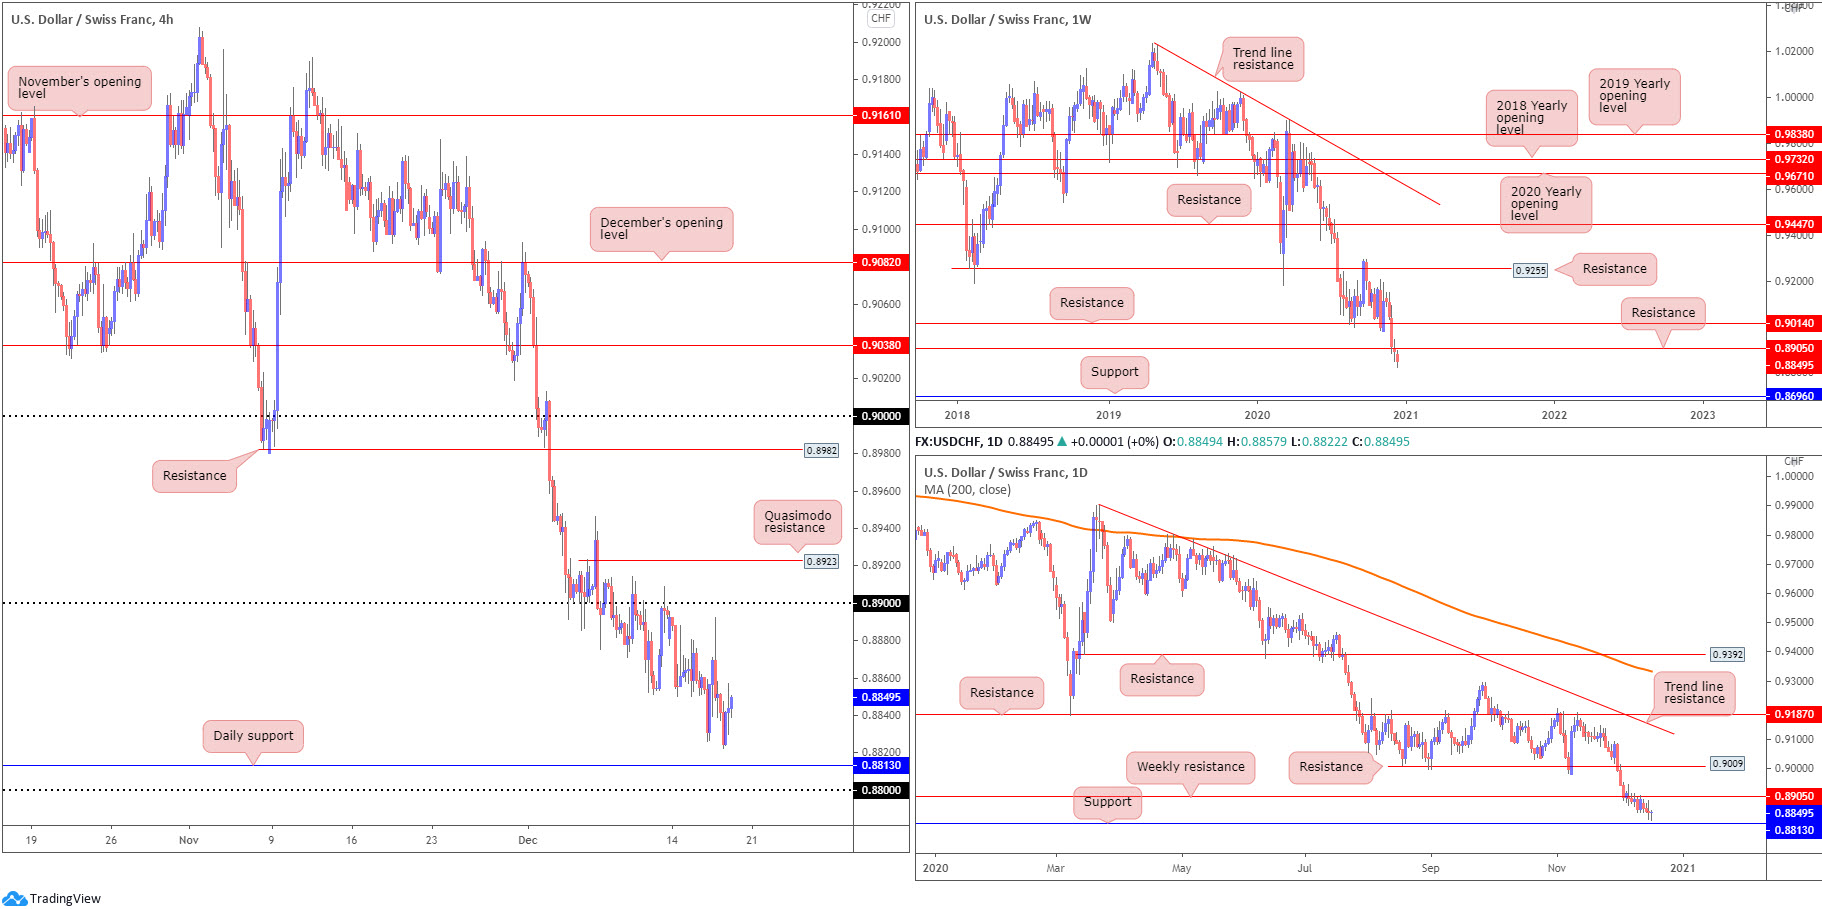
USD/CHF:
The US dollar eased off multi-year troughs against the Swiss franc on Thursday, establishing a daily hammer candlestick pattern (generally interpreted as a bullish signal). Despite an earnest attempt from buyers, however, downside risks remain given the following technical points:
- Downside momentum has subsided since the beginning of December, with H4 compressing (seemingly clearing out sellers as price explores lower terrain) towards daily support priced in at 0.8813, closely shadowed by the 0.88 handle on the H4 chart. Overhead, the 0.89 handle is seen, with a break exposing Quasimodo resistance at 0.8923.
- The technical landscape on the weekly timeframe remains unchanged, showing price drifting beneath resistance from 0.8905. While buyers could still attempt a recovery, traders are urged to pencil in the possibility of refreshing multi-year lows and shining the limelight on support at 0.8696. Interestingly, the trend in this market has been lower since early 2019.
- The framework on the daily timeframe reveals candle action languishing under weekly resistance at 0.8905. Below 0.8905 on the daily scale, however, support is seen at 0.8813.
Areas of consideration:
- Similar to Thursday’s outlook, according to all three charts analysed above, each points to a bearish theme, at least until we cross swords with daily support at 0.8813 and the 0.88 handle on the H4 scale. H4 retesting 0.8850 could lure bearish interest, targeting the aforementioned supports.
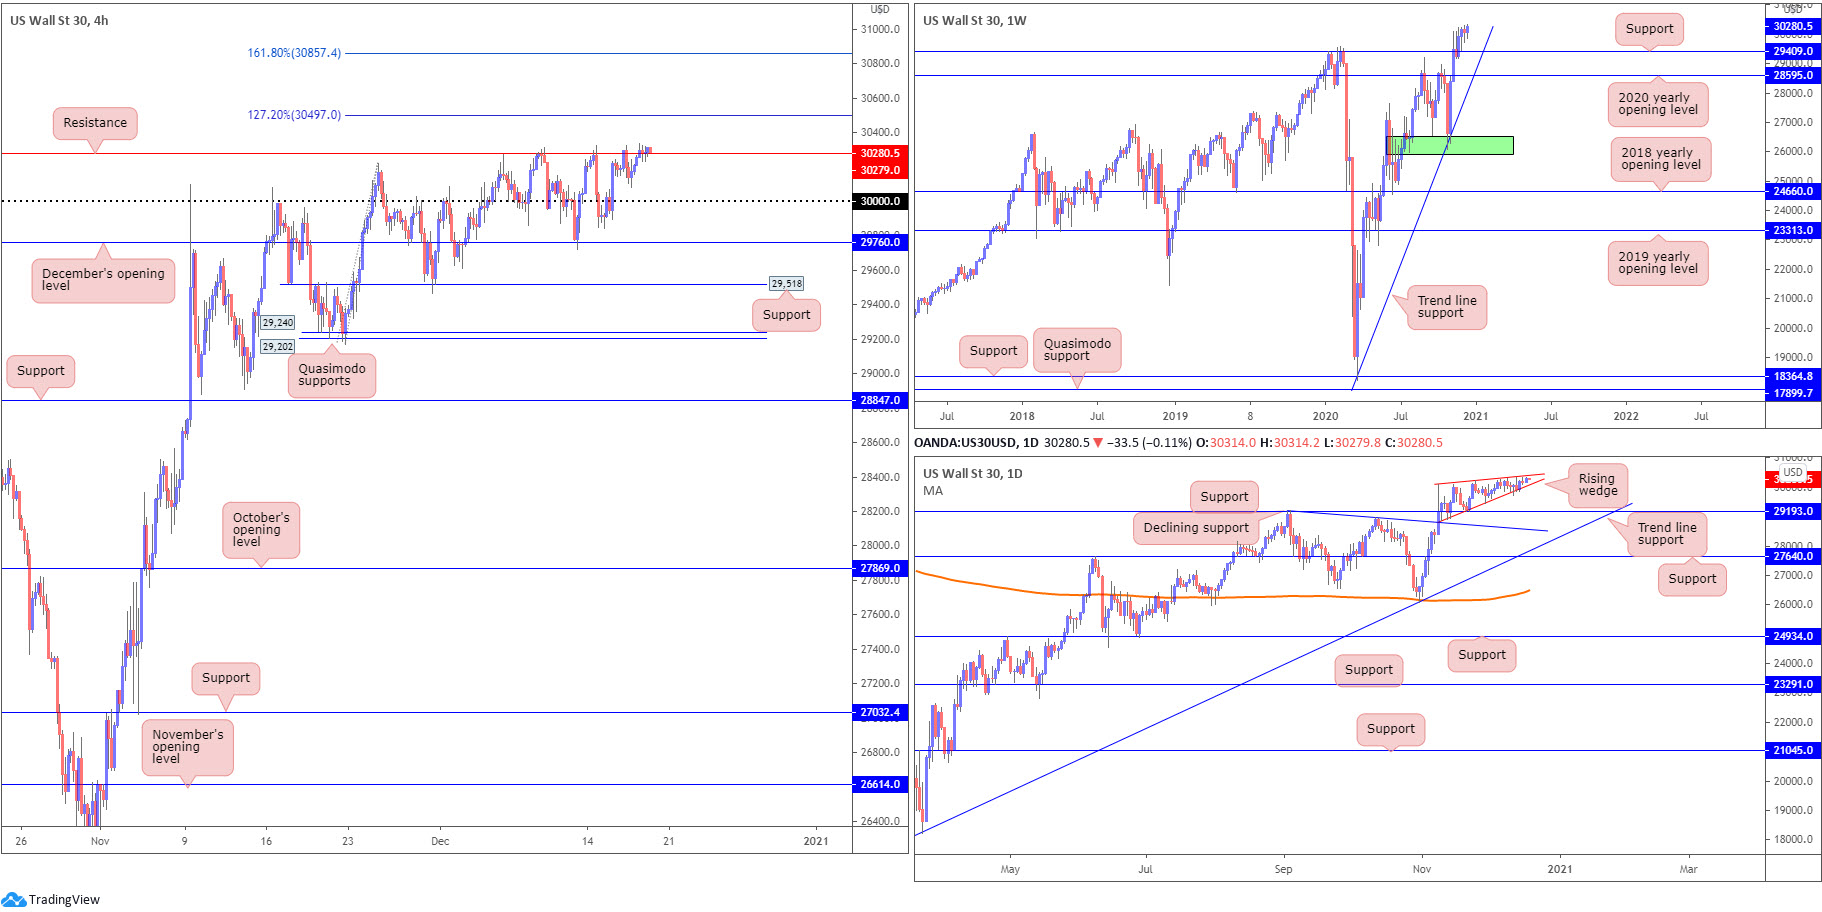
Dow Jones Industrial Average:
US equity benchmarks closed higher Thursday amid stimulus hopes. The Dow Jones Industrial Average added 148.83 points, or 0.49%; the S&P 500 advanced 21.31 points, or 0.58% and the Nasdaq rallied 106.56 points, or 0.84%.
Technically speaking, limited change was observed on the DJIA yesterday, with H4 still toying with resistance at 30,279 (around YTD peaks), following price climbing 30,000 earlier in the week. Clearing 30,279 not only calls for fresh all-time highs, it also shines the spotlight on the 127.2% and 161.8% Fibonacci projection points at 30,497 and 30,857, respectively.
Further out on the weekly timeframe, we can see that should the unit correct, support at 29,409 (prior Quasimodo resistance) could be an area dip-buyers find interest in. The 2020 yearly opening value from 28,595 is also in the frame, tied together with trend line support, taken from the low 18,213. According to the daily timeframe, support is seen at 29,193. Pattern traders may also acknowledge the rising wedge forming between 28,940/30,097.
Areas of consideration:
Outlook unchanged due to lacklustre movement on Thursday.
- Retesting 30,000 may draw buyer interest to take on H4 resistance at 30,279, followed by 30,497 and 30,857.
- A close below the daily rising wedge pattern could see sellers force a retest at daily support from 29,193. This would take H4 through supports at 29,760 and 29,518 to test Quasimodo supports at 29,202 and 29,240.
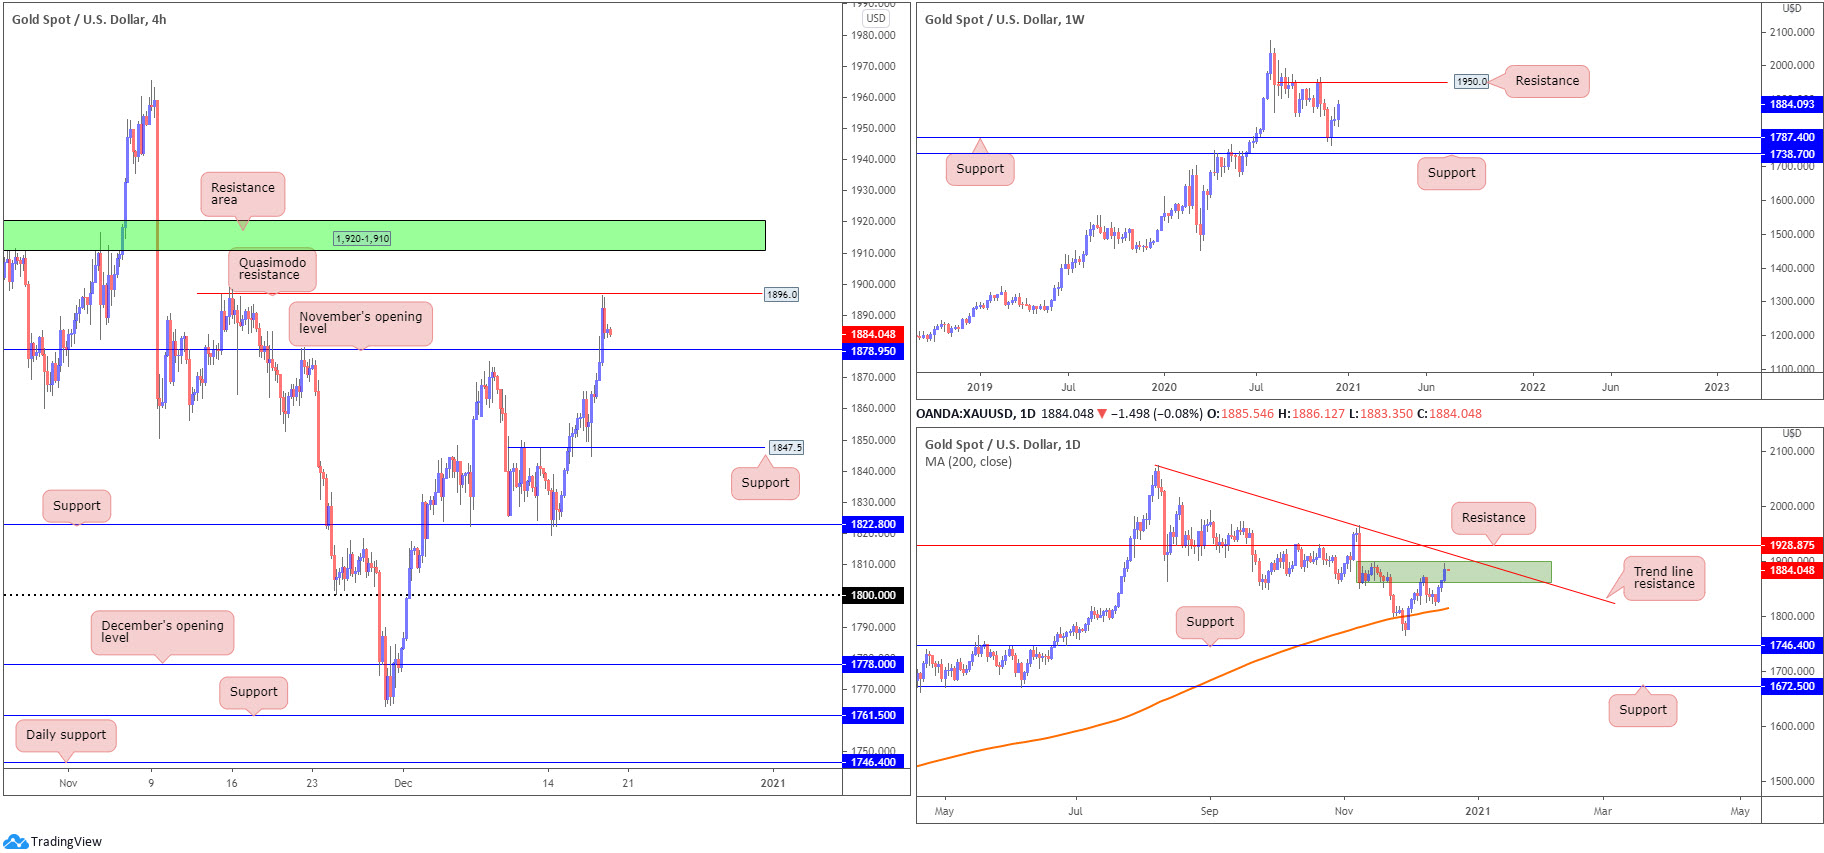
XAU/USD (GOLD):
Dollar downside continued to underpin the yellow metal Thursday, with XAU/USD extending recovery gains by 1.1%.
Following H4 support making an appearance at $1,847 late Wednesday, yesterday overthrew the $1,875 December 8th peak and November’s opening value priced in at $1,878. This resulted in offers being tested at H4 Quasimodo resistance from $1,896. Technicians will acknowledge a H4 resistance area is also parked above the aforementioned Quasimodo at $1,920-$1,910.
Elsewhere, weekly price is on fine form north of support at $1,787, sited ahead of another support at $1,738. Further buying unveils resistance at $1,950. A closer reading of price action on the daily chart shows supply around $1,870ish (green zone) is on the brink of giving way for nearby trend line resistance, taken from the high $2,075.
Areas of consideration:
- November’s opening value at $1,878 on the H4 could offer a platform for buyers today, having seen weekly and daily timeframes exhibit scope to approach higher levels. Upside targets fall in at the H4 Quasimodo resistance from $1,896 and the H4 resistance zone at $1,920-$1,910.
- Intraday breakout buying opportunities may also emerge upon crossing above H4 Quasimodo resistance from $1,896.
The accuracy, completeness and timeliness of the information contained on this site cannot be guaranteed. IC Markets does not warranty, guarantee or make any representations, or assume any liability regarding financial results based on the use of the information in the site.
News, views, opinions, recommendations and other information obtained from sources outside of www.icmarkets.com.au, used in this site are believed to be reliable, but we cannot guarantee their accuracy or completeness. All such information is subject to change at any time without notice. IC Markets assumes no responsibility for the content of any linked site.
The fact that such links may exist does not indicate approval or endorsement of any material contained on any linked site. IC Markets is not liable for any harm caused by the transmission, through accessing the services or information on this site, of a computer virus, or other computer code or programming device that might be used to access, delete, damage, disable, disrupt or otherwise impede in any manner, the operation of the site or of any user’s software, hardware, data or property
