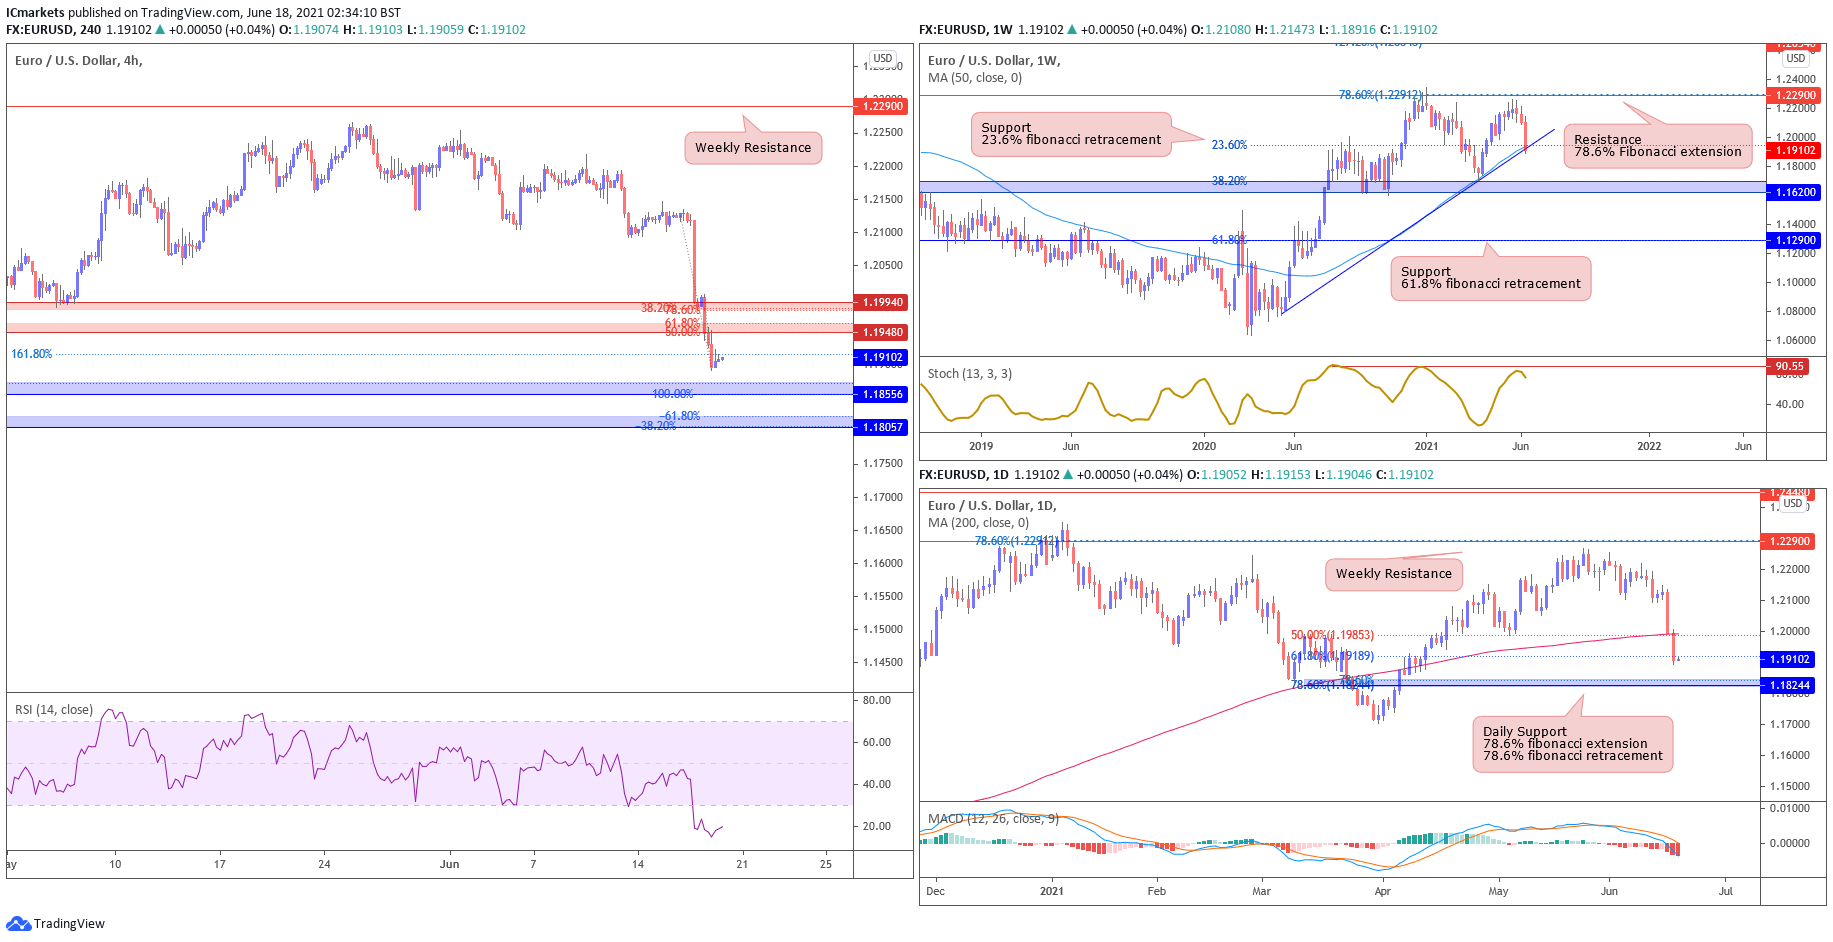
EUR/USD:
Looking at the weekly chart we can see that prices have pulled back and found support at 1.19102, in-line with 23.6% Fibonacci retracement, 50MA and ascending trendline support. On the daily chart prices are facing strong bearish pressure where it broke below 200MA and 50% Fibonacci retracement and found support at 1.19102, which would be the 61.8% Fibonacci retracement. Price could potentially face further bearish pressure to 1.18244, which would also be our Fibonacci confluence zone for 78.6% extension and 78.6% retracement. MACD is also indicating further bearish pressure, in-line with our bearish analysis.
On the H4 timeframe, prices have broken down and found support at 1.18950, in-line with 161.8% Fibonacci extension. There could potentially be a short-term bounce to 1.19480, in-line with 50% and 61.8% Fibonacci retracement. RSI is also over-sold, which also supports our view for a short-term bounce. The next level of resistance will be at 1.19940, in-line with 38.2% and 61.8% Fibonacci retracement.
If price breaks current level, it could face further bearish pressure to 1.18556, in-line with 100% Fibonacci extension and 61.8% Fibonacci retracement. The next level of support will be at 1.18057, in-line with -38.2% and -61.8% Fibonacci retracement.
Areas of consideration:
- H4 time frame, support level at 1.18556 and 1.18057
- H4 time frame, resistance level at 1.19480 and 1.19940
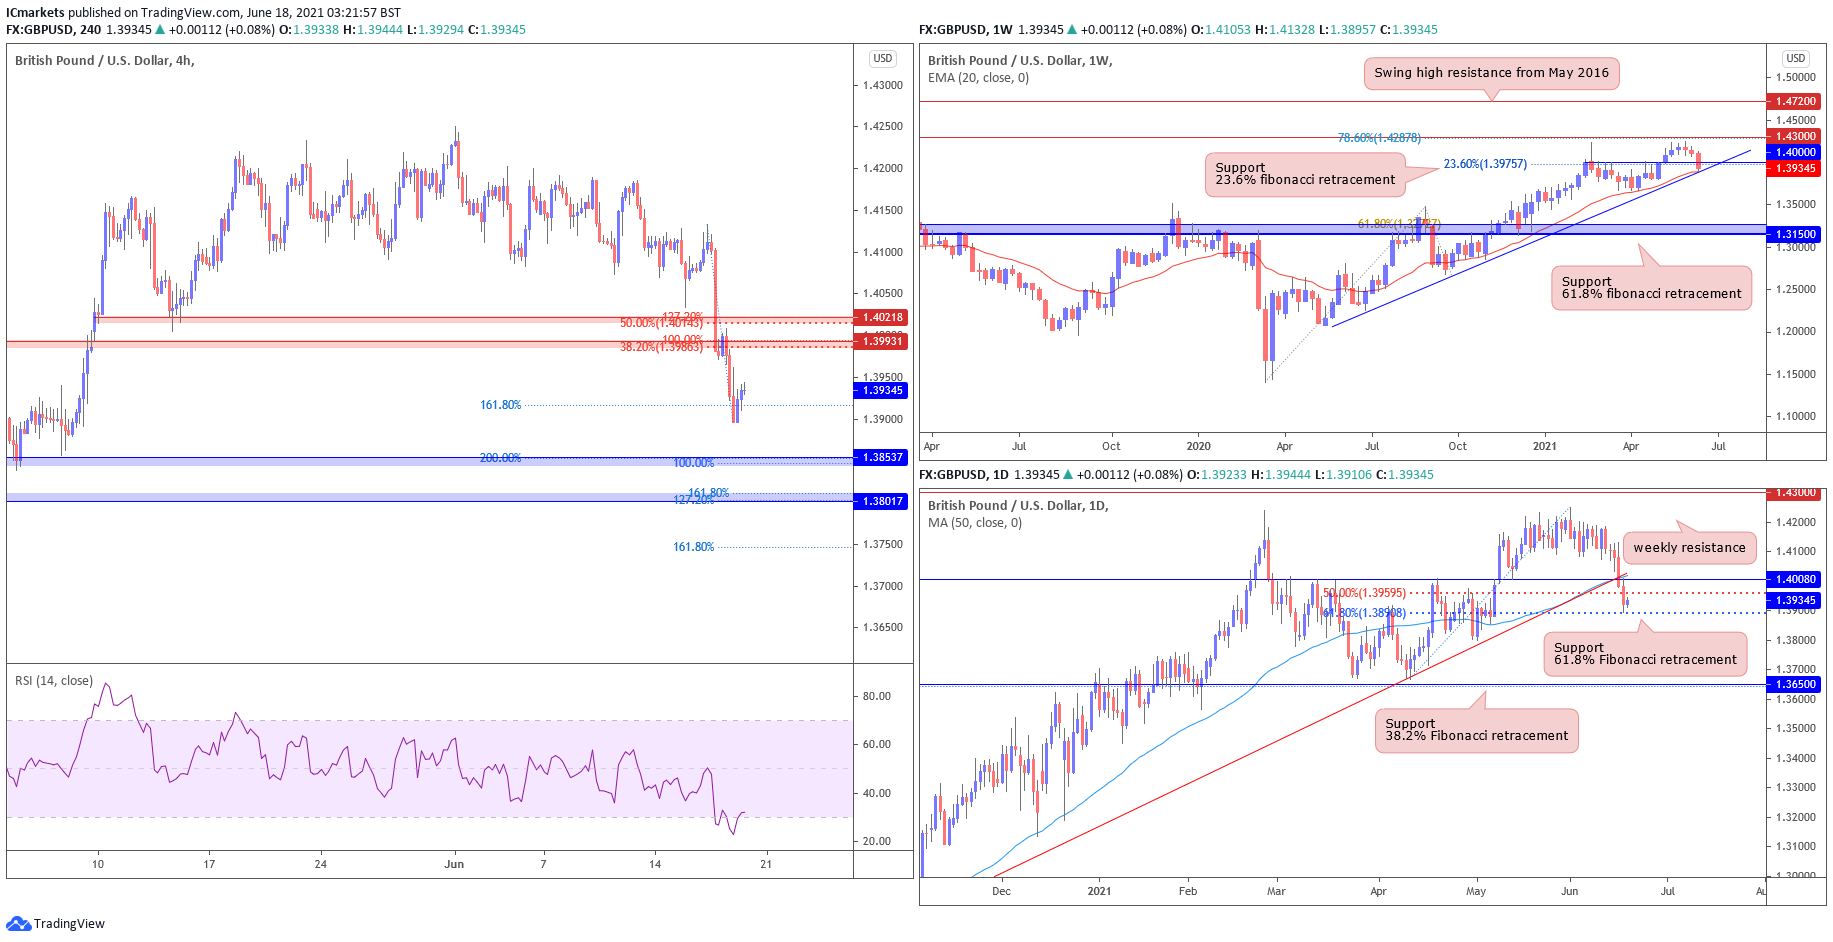
GBP/USD:
Looking at the weekly chart, we can see that prices have pulled back and found support at 1.39345, in-line with 23.6% Fibonacci retracement and ascending trendline support. On the daily time frame, prices have broken below 50MA and ascending trendline and found support at 1.39345 where it could potentially find short-term support and a quick short-term bounce, in-line with our weekly timeframe.
On the H4 timeframe, prices have broken down from the descending trendline where it found support at 1.18946, in-line with 161.8% Fibonacci extension.
The RSI is oversold and there could potentially be a short-term bounce. The first level of resistance is 1.39931, in-line with 38.2% Fibonacci retracement and 100% Fibonacci extension. The next level of resistance will be 1.40218, in-line with 50% Fibonacci retracement and 127.2% Fibonacci extension.
If prices continue to face bearish pressure, the first level of support will be at 1.38537, in-line with 100% & 200% Fibonacci extension. The next level of support will be at 1.38017, in-line with 161.8% & 127.2% Fibonacci extension.
Areas of consideration:
- H4 time frame, 38537 and 1.38017 support level
- H4 time frame, 1.39931 and 1.40218 resistance level
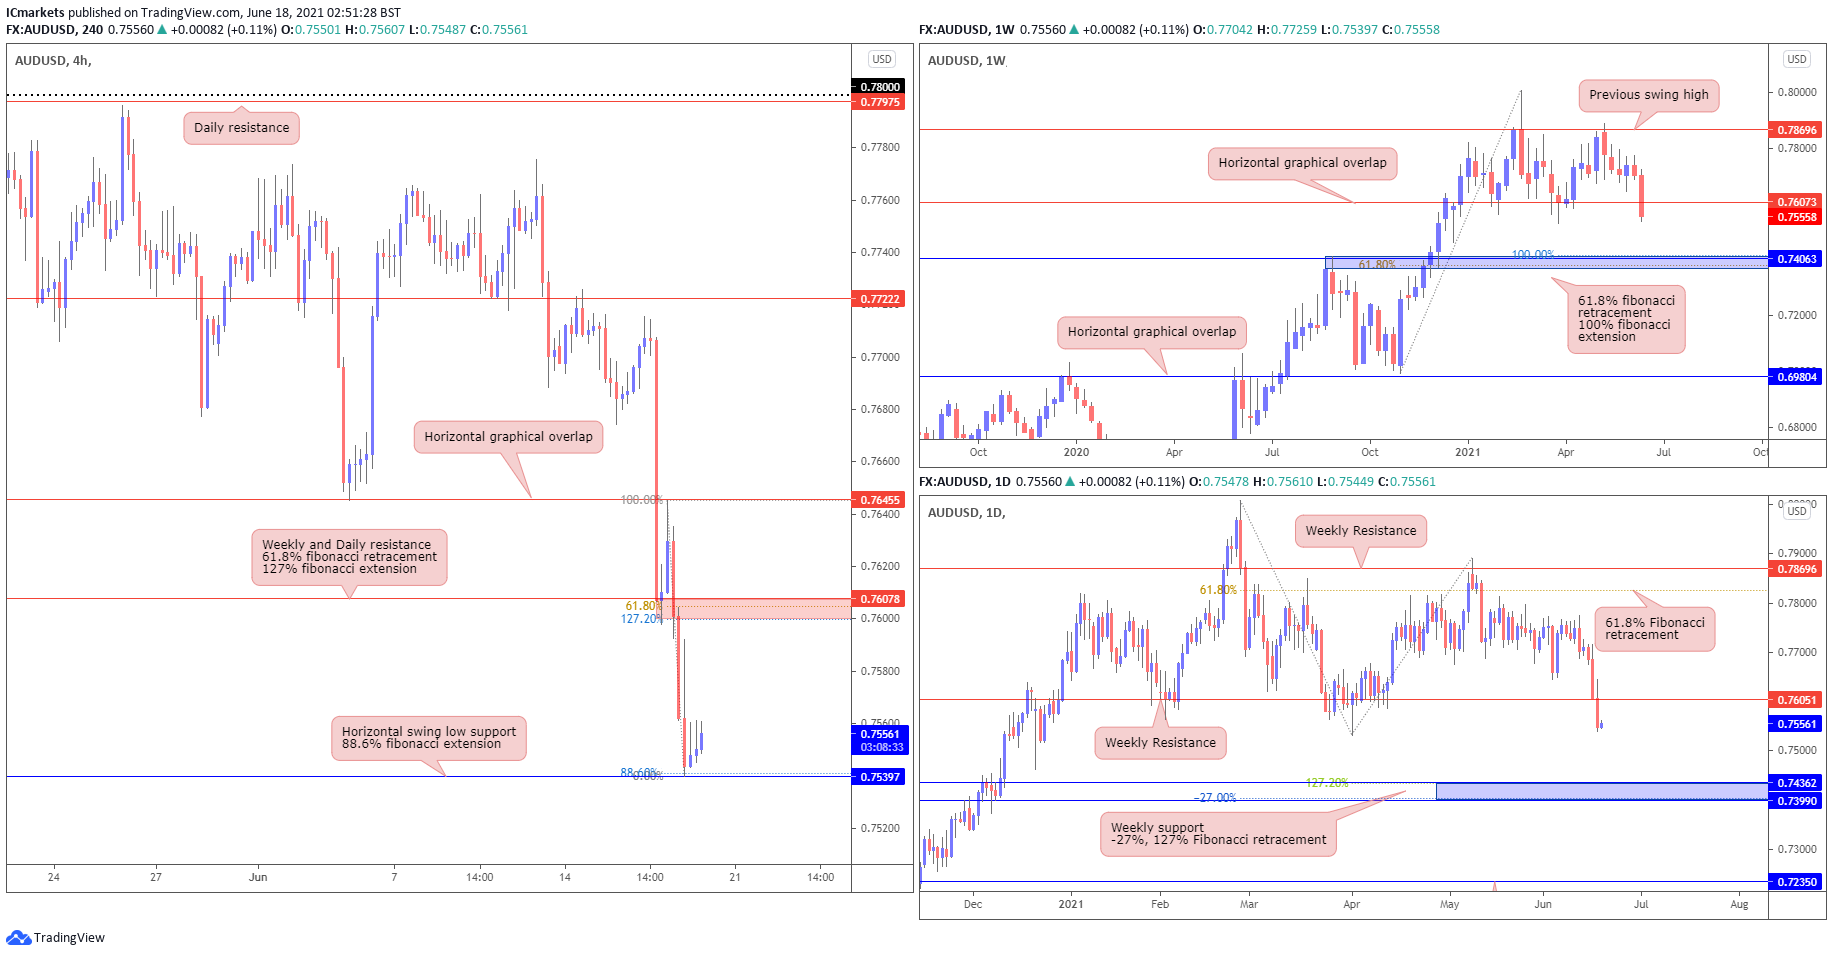
AUD/USD:
From the Weekly timeframe, we see price breaking beneath 0.76073, in line with previous swing low, where we may see a continuation of push down towards 0.74063, in line with 61.8% fibonacci retracement, 100% fibonacci extension and horizontal graphical overlap. From the daily timeframe, we see a similar action where price is pushing down towards the 0.74362 level, in line with Weekly support, -27% and 127% fibonacci retracement.
On the H4 timeframe, we see price bounced from 0.75397, in line with Horizontal swing low support and 88.6% fibonacci extension level. Where price may push up towards 0.76078, in line with Daily and weeky resistance, 127% Fibonacci extension and 61.8% fibonacci retracement.
Areas of consideration:
- H4 timeframe, price may make a short-term bullish bounce from 0.75397 towards 0.76078
- Daily and weekly time frames showing bearish pressure.
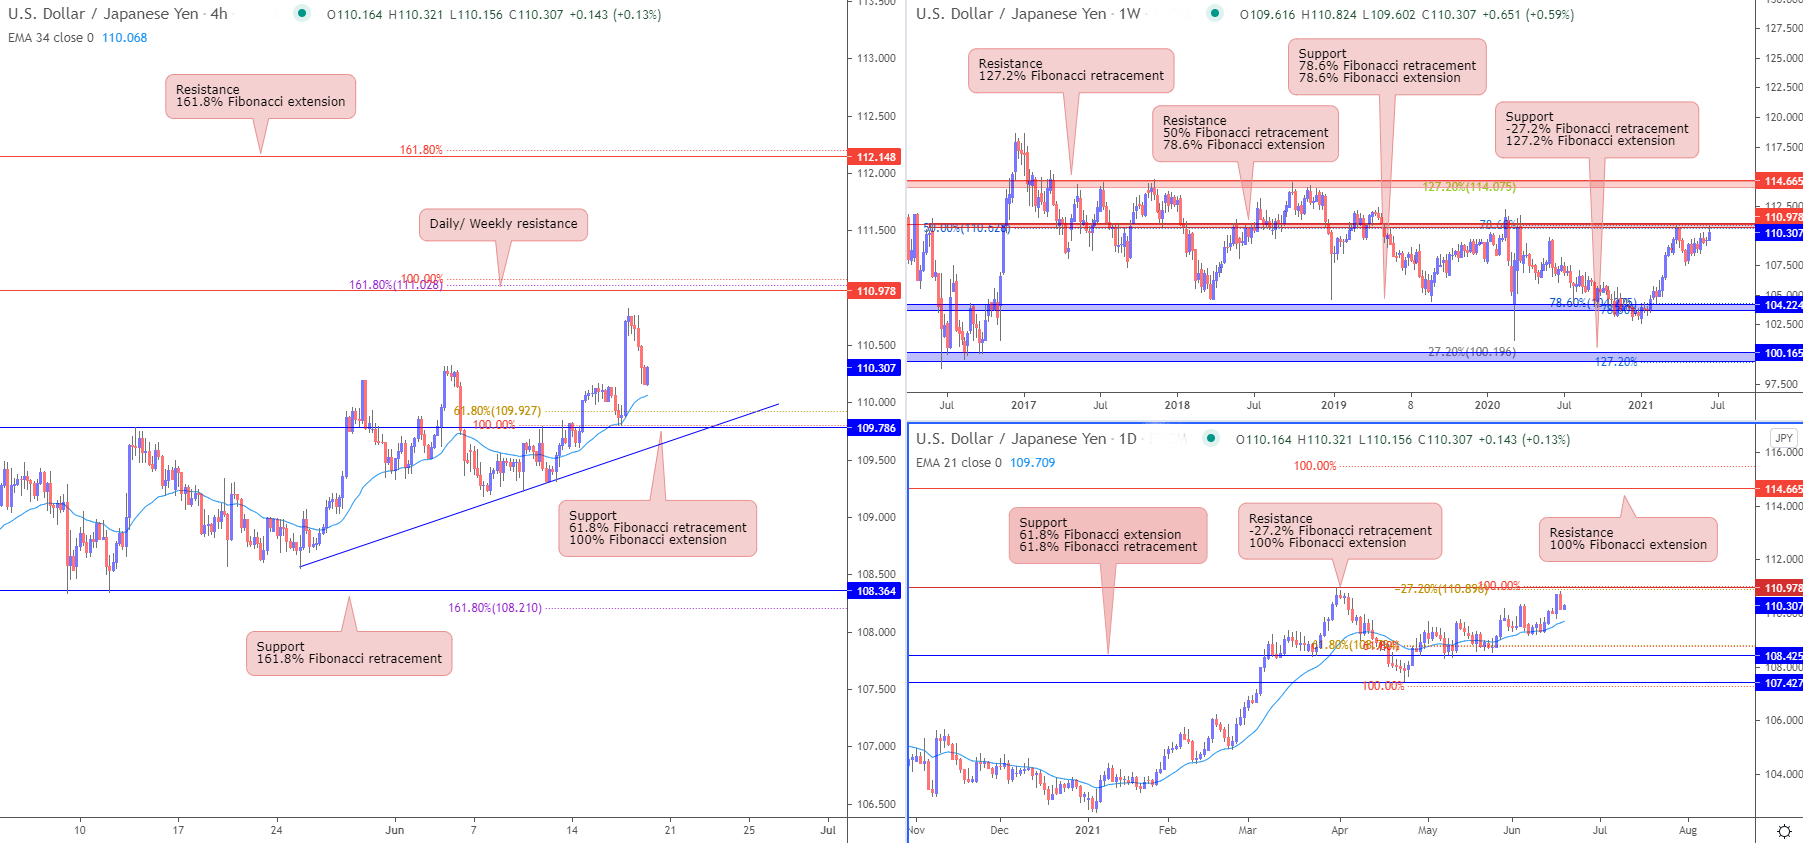
USD/JPY
From the weekly timeframe, prices are facing resistance from horizontal swing high resistance which coincides with 50% Fibonacci retracement and 78.6% Fibonacci extension. Prices seem to be more bullish and might break through the resistance. If price breaks out, next target on the weekly would be the 114.665 level in line with 127.2% Fibonacci retracement. On the daily time frame, prices are holding nicely above the 21 period EMA. Prices are approaching resistance at 110.978 in line with the weekly level. A reversal from that level could mean prices would take support on 108.425 level. A continued push up could mean next target is weekly resistance of 114.665 in line with 100% Fibonacci extension level.
On the H4 timeframe, prices are showing the same picture. Prices are approaching the daily/weekly resistance level of 110.978. A break above the level could see prices pushing up towards 112.148, a short term resistance in line with 161.8% Fibonacci extension. Prices are pulling back to take support on 109.786 which is in line with ascending trendline support, 61.8% Fibonacci retracement and 100% Fibonacci extension. 34 Period EMA is also below prices, showing a bullish pressure for prices.
Areas of consideration:
- 148 resistance level on the H4 timeframe might be next upside target
- 978 level on every time frame
- 786 support level on the H4 timeframe
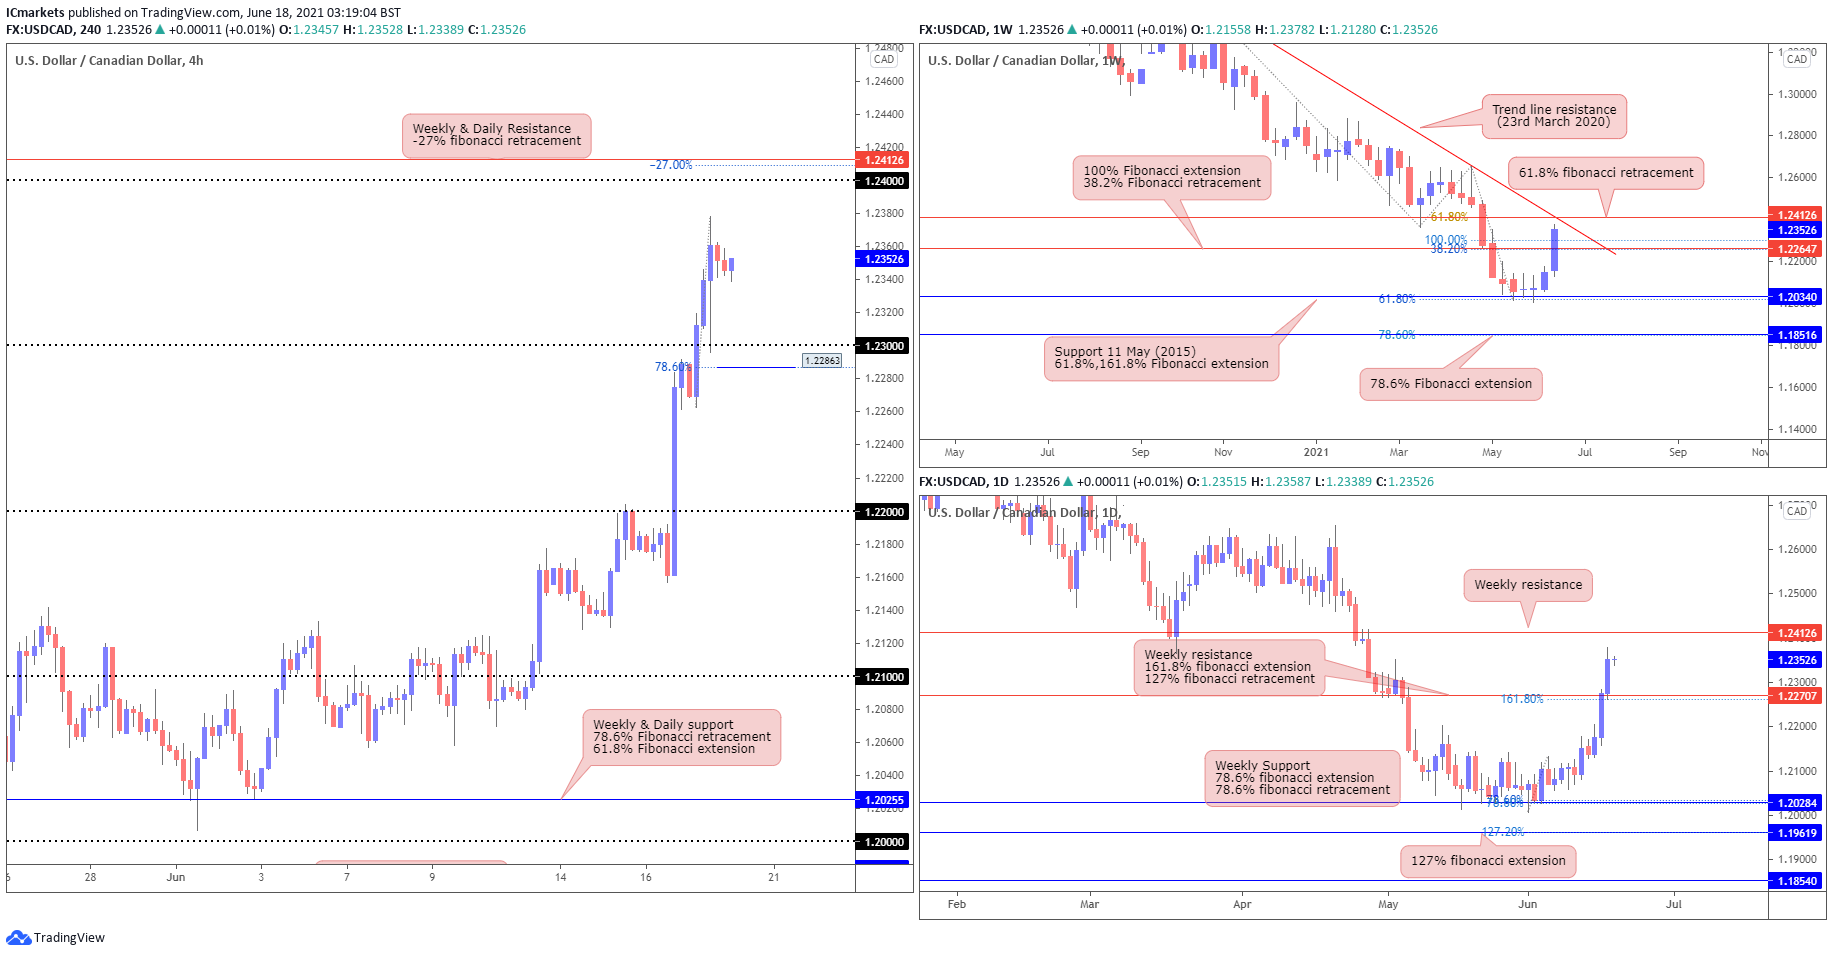
USD/CAD:
From the Weekly timeframe, we saw a push towards the 1.22647 level, in line with 100% fibonacci extension and 38.2% fibonacci retracement. If price breaks above this level we may see it test the next level at 1.24126, in line with 61.8% fibonacci retracement and descending trendline resistance. On the daily timeframe, we see price broken above the level of 1.22707, in line with Weekly resistance, 161.8% fibonacci extension and horizontal graphical overlap. The next level of resistance may be found at 1.24126 in line with the Weekly resistance.
The H4 timeframe shows price pulling back where we may find a bounce from the 1.22863 level, in line with the 78.6% fibonacci retracement towards 1.24126 level, in line with -27% fibonacci retracement, Weekly and Daily resistance
Areas of consideration:
- The weekly and daily time frame shows a bullish momentum.
- On H4, price may pull back towards 1.22863 before bouncing towards 1.24126
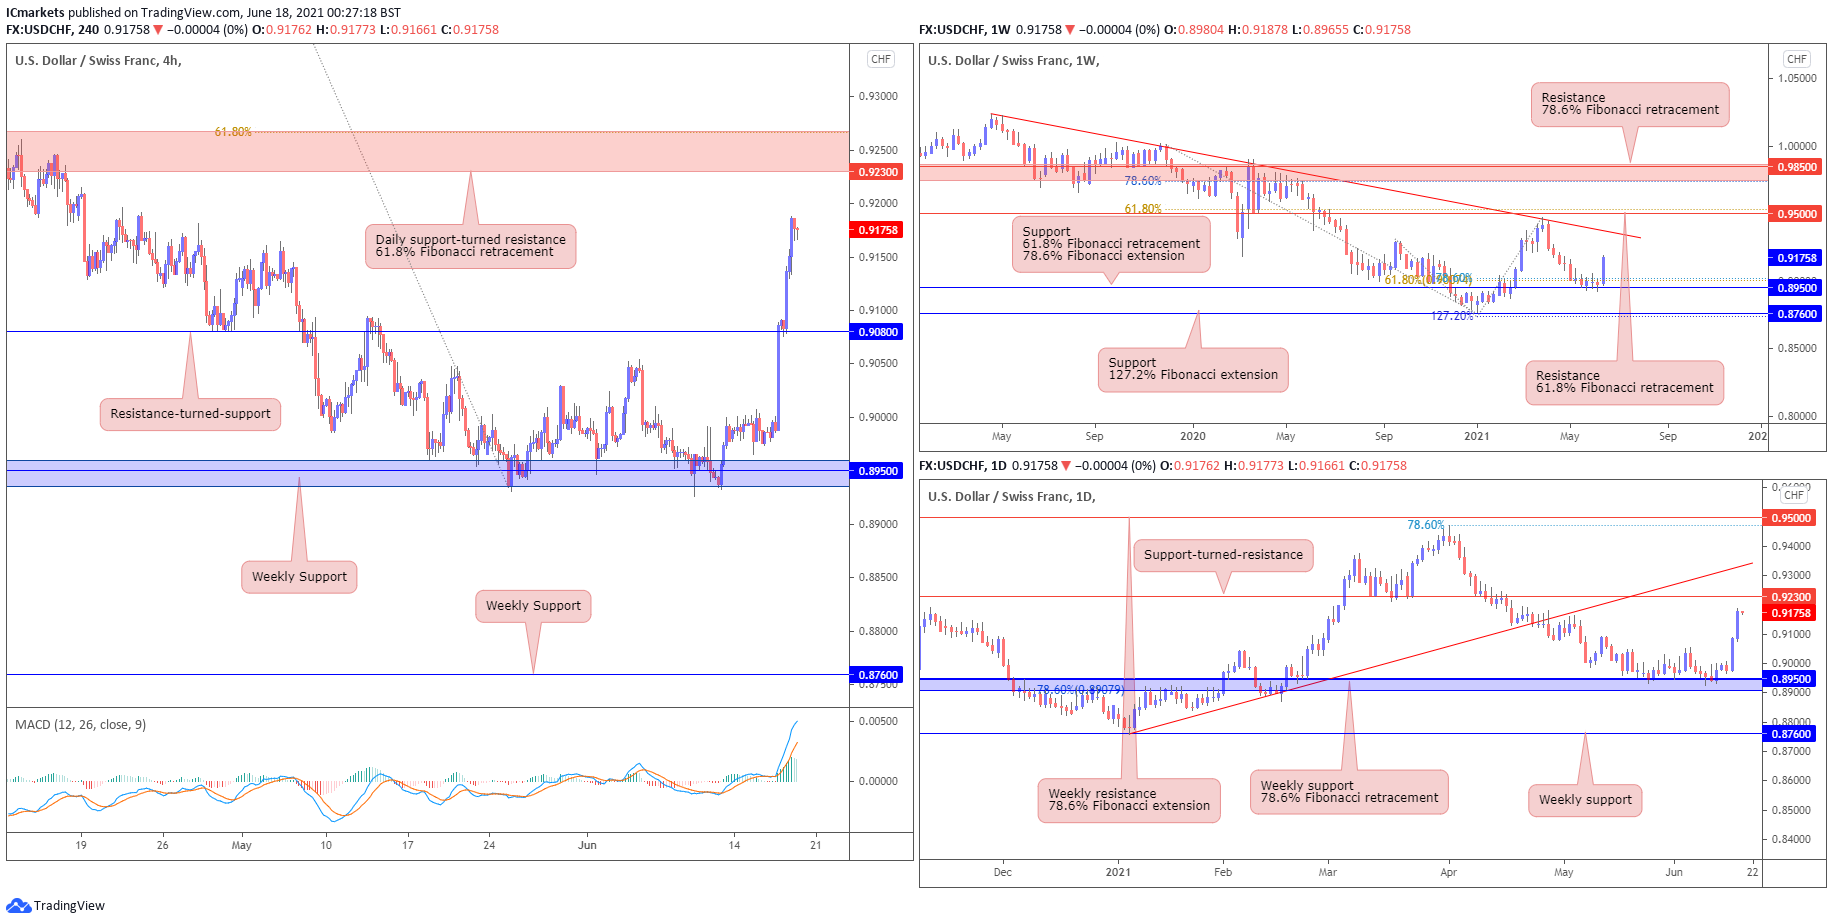
USD/CHF:
USD/CHF has shown a bounce from the weekly 0.89500 support, in line with 61.8% Fibonacci retracement and 78.6% Fibonacci extension. The daily chart shows that price is now approaching the key daily 0.92300 support-turned-resistance, which is now a key resistance level to watch. We could see a reversal at 0.92300 resistance.
On the H4 chart, we can see that price has shown a strong bounce from the key weekly 0.89500 support level, in line with 61.8% and 127.2% Fibonacci extension, and has broken and closed above the 0.90800 resistance. In this scenario, with MACD also holding above the 0 line, we could see price push up higher to test the 0.92300 weekly resistance. The 0.92300 weekly resistance is a key level to watch, in line with our 61.8% Fibonacci retracement.
Areas of consideration:
- The 0.92300 resistance is a key intraday level to watch.
- MACD is showing signs of possible bullish pressure.
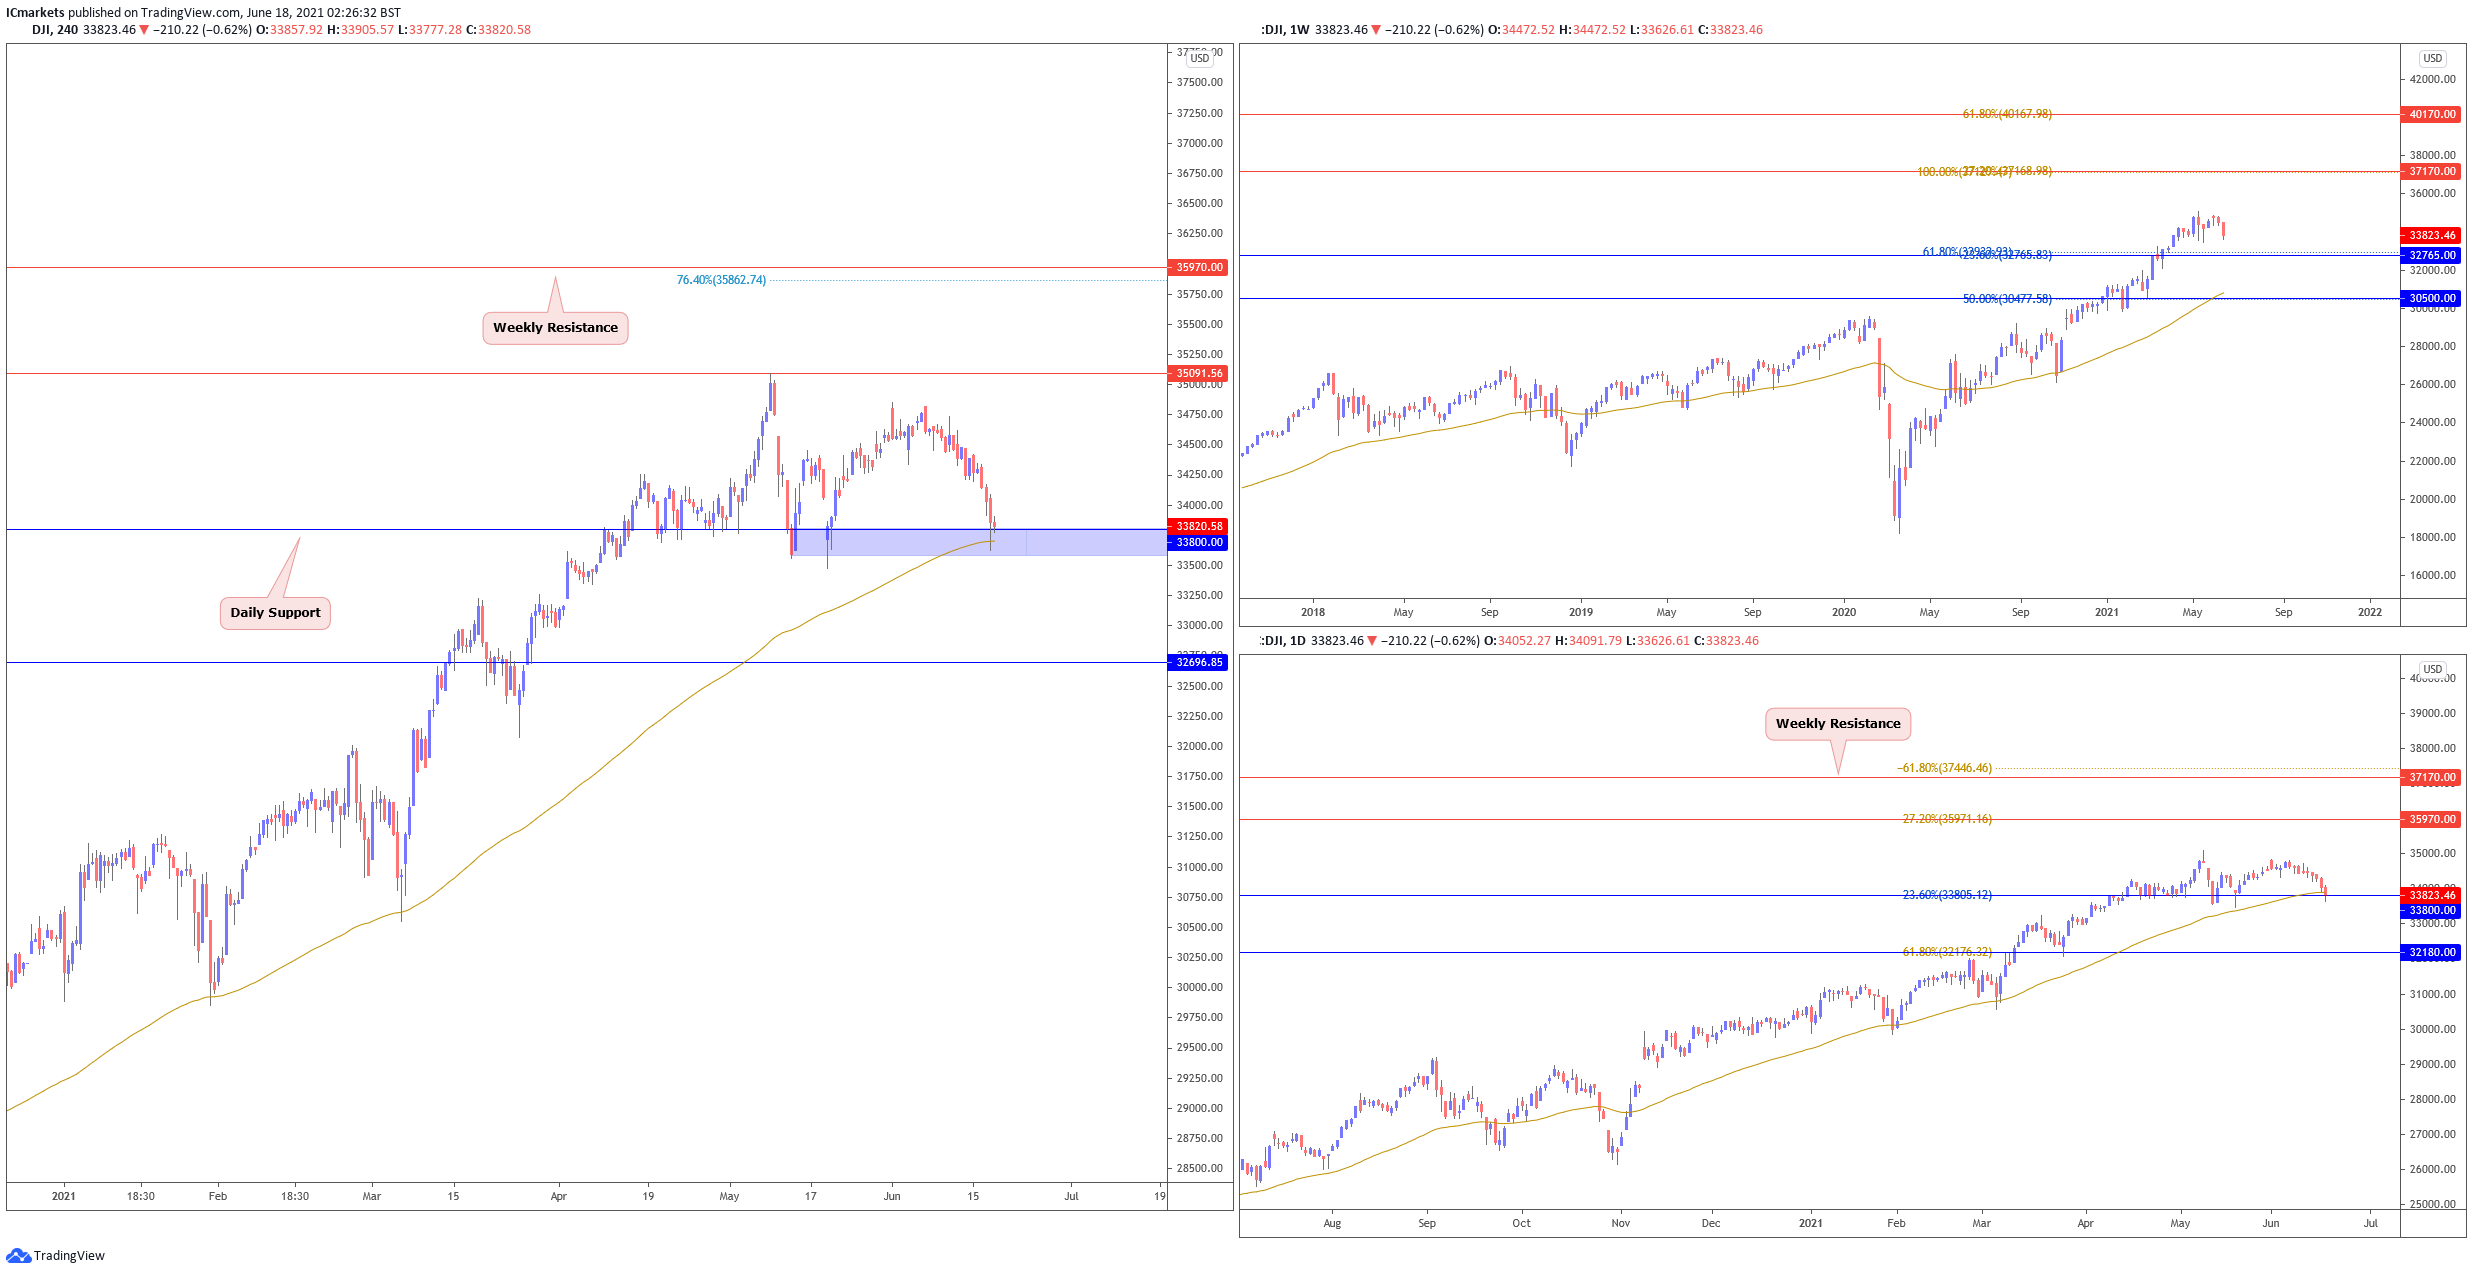
Dow Jones Industrial Average:
On the weekly chart, price is trading sideways. With price holding above the long term moving average, we can expect further bullish pressure above 32765 support. On the daily chart, price dipped lower however, still testing support at 33800 and also holding above moving average. Buyers may look to add their longs to push price higher towards possible target at 35970 resistance.
On the H4, price drifted lower and is also testing daily support at 33800. We could possibly see more buyers enter with their longs to play a revived bounce towards 35091 resistance. Otherwise, failure to hold above 33800 support will see price drop lower towards 32696 support next. Price is also holding above moving average support as well.
Areas of consideration:
- Watch support at 33800 on H4 closely
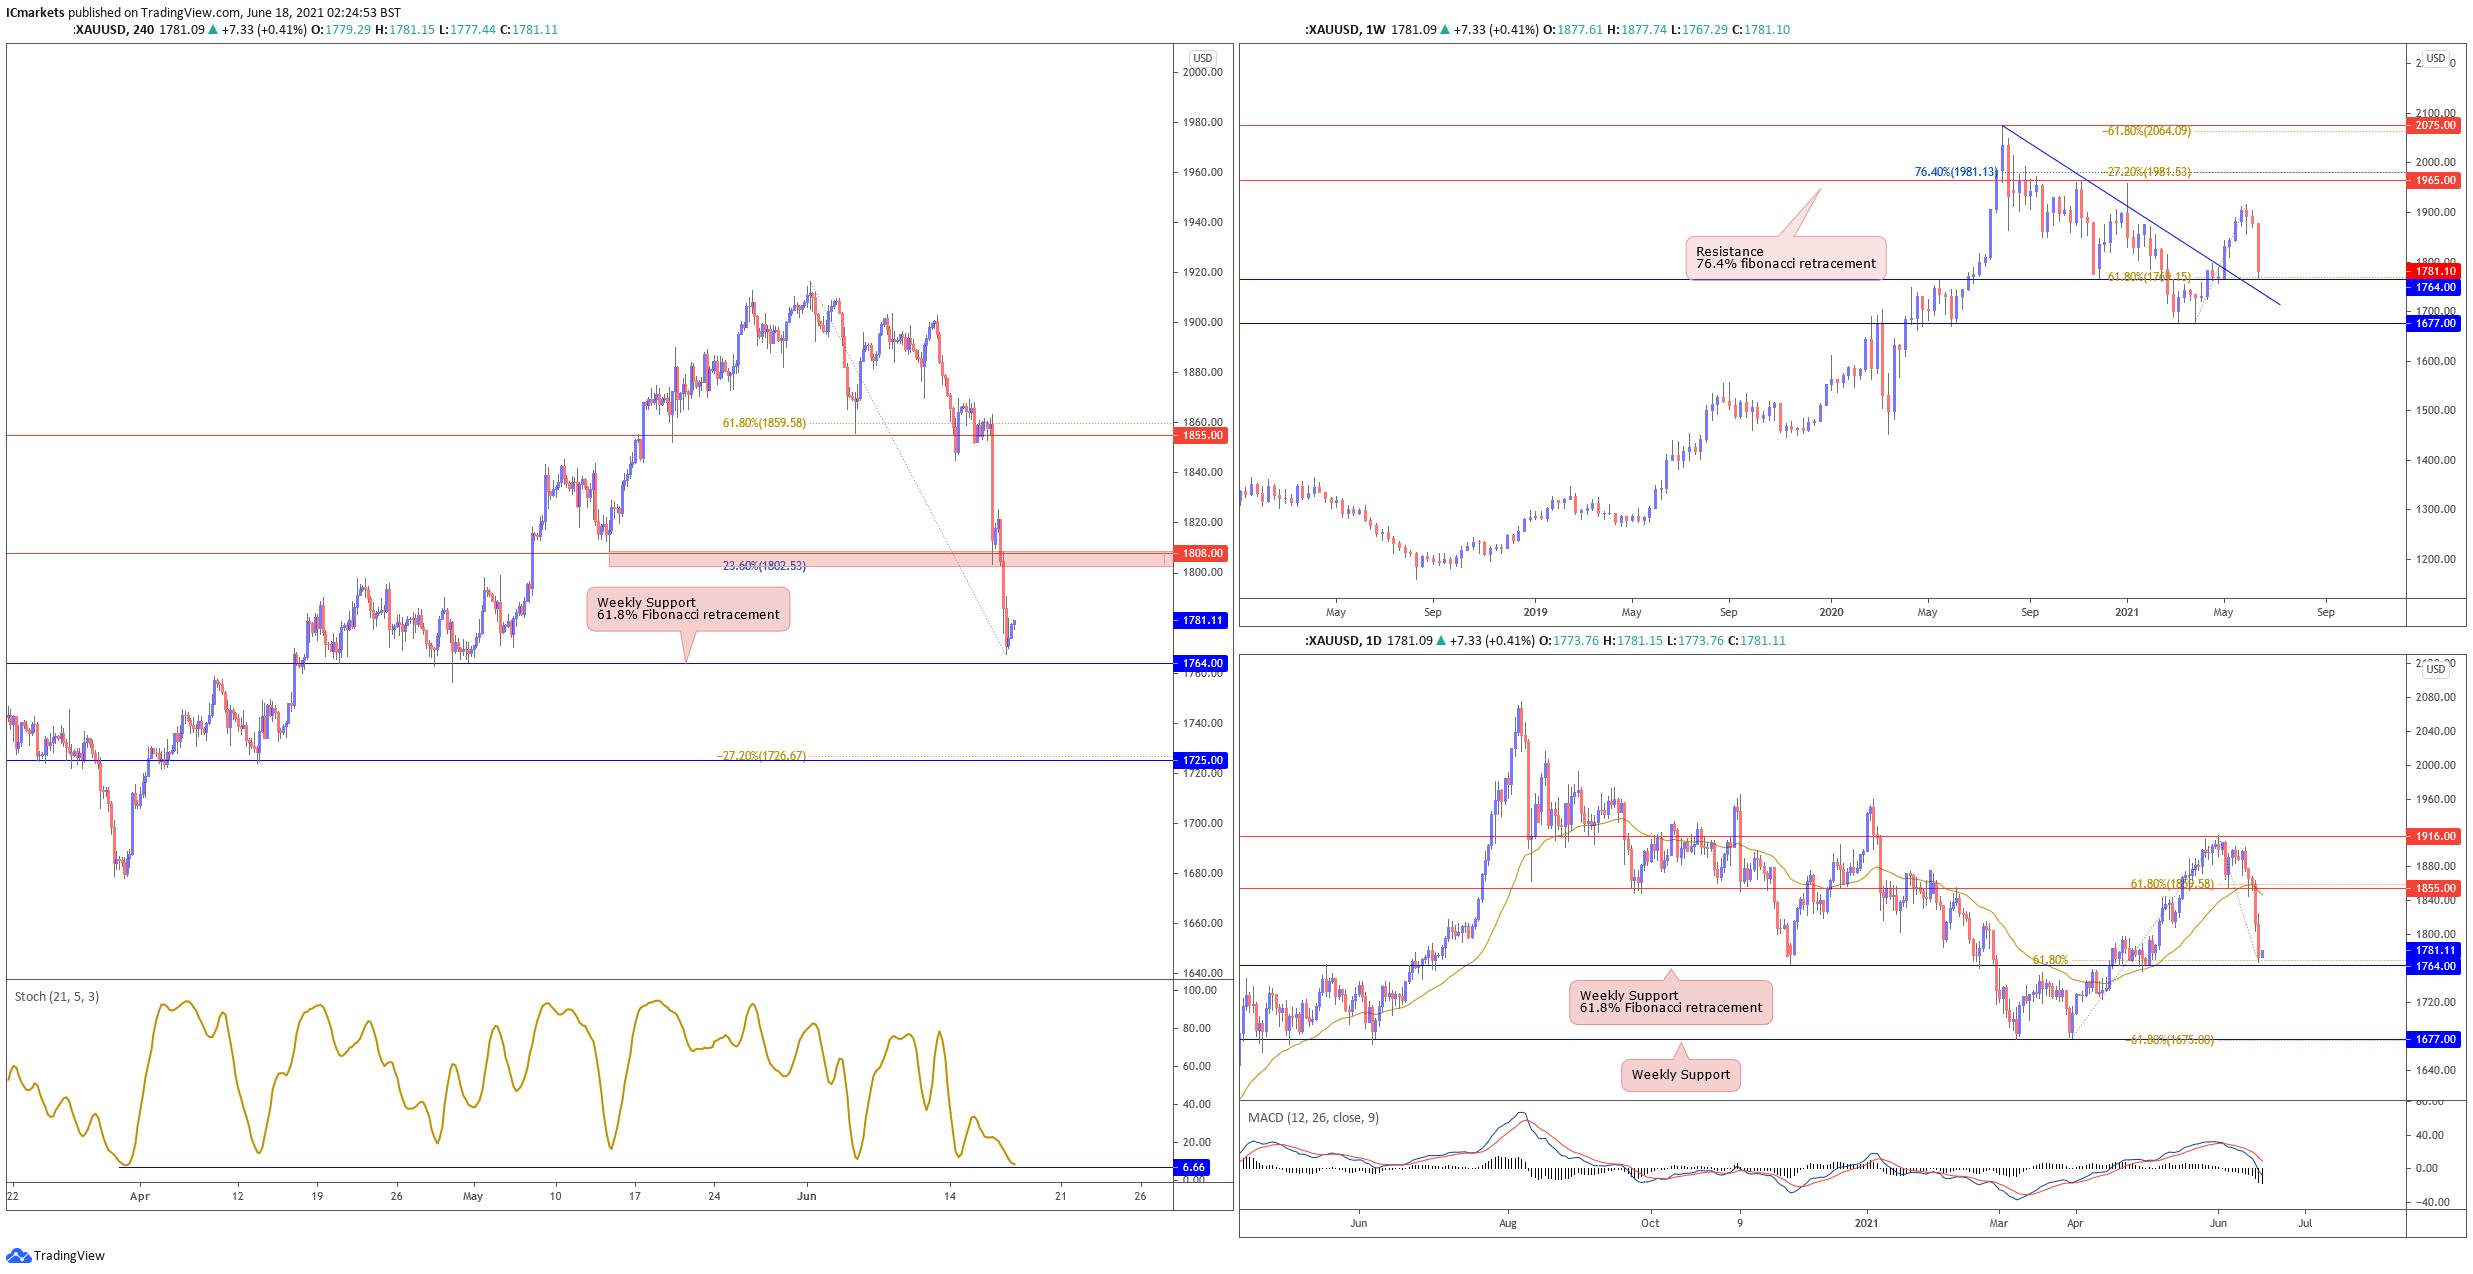
XAU/USD (GOLD):
On the weekly timeframe, prices are facing bullish pressure and could still see further upside, with 1965 as the weekly resistance target. On the daily, price pulled back lower, and is testing 1815 support, in line with the descending trendline resistance-turned-support. With technical indicators showing room for further bullish momentum, we could see buyers looking to add to their longs above 1815 support and push price towards 1965 resistance.
On the H4, price dropped much lower and towards the 1815 support. With stochastics approaching support where price bounced in the past as well, we see a medium probability bullish scenario where buyers may look to add to their longs with a possible upside target at 1850 resistance, in line with horizontal pullback resistance and 50% Fibonacci retracement. Otherwise, failure to hold above 1815 support could see price swing towards the next key weekly and daily support at 1764.
Areas of consideration:
- 1850 support to watch on H4 timeframe
The accuracy, completeness and timeliness of the information contained on this site cannot be guaranteed. IC Markets does not warranty, guarantee or make any representations, or assume any liability regarding financial results based on the use of the information in the site.
News, views, opinions, recommendations and other information obtained from sources outside of www.icmarkets.com.au, used in this site are believed to be reliable, but we cannot guarantee their accuracy or completeness. All such information is subject to change at any time without notice. IC Markets assumes no responsibility for the content of any linked site.
The fact that such links may exist does not indicate approval or endorsement of any material contained on any linked site. IC Markets is not liable for any harm caused by the transmission, through accessing the services or information on this site, of a computer virus, or other computer code or programming device that might be used to access, delete, damage, disable, disrupt or otherwise impede in any manner, the operation of the site or of any user’s software, hardware, data or property.


