
Key risk events today:
China GDP q/y; China Fixed Asset Investment ytd/y; China Industrial Production y/y; UK Retail Sales m/m; US Building Permits and Housing Starts; FOMC Member Harker Speaks; Prelim UoM Consumer Sentiment.
(Italics represents previous analysis and outside sources)
EUR/USD:
Thursday had the EUR/USD refresh weekly highs at 1.1172 before rotating to the downside. The decline gained traction following upbeat US data as well as tripping intraday sell stops south of 1.1144.
According to the Census Bureau, advance estimates of US retail and food services sales for December 2019, adjusted for seasonal variation and holiday and trading-day differences, but not for price changes, were $529.6 billion, an increase of 0.3 percent (±0.4 percent) from the previous month, and 5.8 percent (±0.7 percent) above December 2018.
Manufacturing activity in the region increased this month, according to results from the January Manufacturing Business Outlook Survey. The diffusion index for current general activity increased nearly 15 points this month, from a revised reading of 2.4 in December to 17.0.
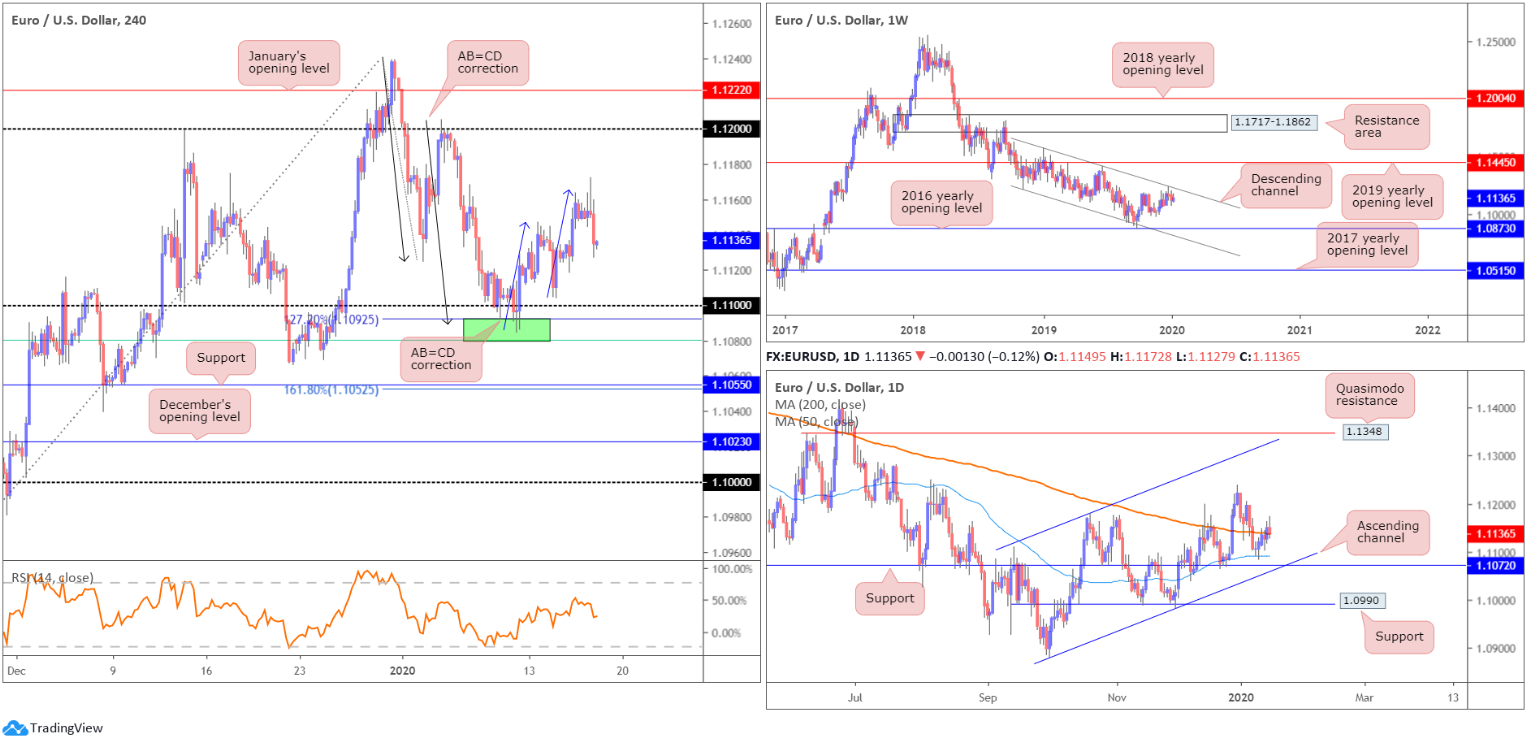
The recovery from 1.11 on the H4 timeframe, following the completion of a bullish AB=CD correction (black arrows), formed a bearish AB=CD correction (blue arrows) at 1.1165. Well done to any readers who managed to profit from the recent move higher; it was a noted move to watch for in previous analysis. With price now heading lower, a revisit at 1.11 may be at hand.
On more of a broader perspective, traders have the current daily candle testing the 200-day SMA (orange – 1.1137), which hovers a few points north of the 50-day SMA (blue – 1.1091). Another layer of support worthy of mention on the daily timeframe rests at 1.1072, closely shadowed by a channel support, taken from the low 1.0879.
Weekly price, according to our chart studies, remains mostly unchanged:
Technical research has weekly movement extending losses south of long-standing channel resistance, drawn from the high 1.1569. Visible downside objectives on this timeframe fall in at the 2016 yearly opening level at 1.0873 and channel support, taken from the low 1.1109. To the upside, assuming a break of the said channel resistance, price has the 2019 yearly opening level at 1.1445 to target.
In terms of the primary trend, price has been trading lower since topping in early 2018, at 1.2555.
Areas of consideration:
A retest at 1.11 could be something to watch out for today. However, buyers off the current 200-day SMA may hamper downside.
In the event 1.11 re-enters the field, a H4 bullish candlestick signal may prompt a turn higher, knowing the noted 50-day SMA supports the round number. How much of a move will develop from 1.11, though, is difficult to judge – weekly sellers may just be too dominant.
GBP/USD:
The British pound, a reasonably strong outperformer vs. the dollar and euro Thursday, tested highs of 1.3083.
In recent reports, the research team highlighted the following reversal zone:
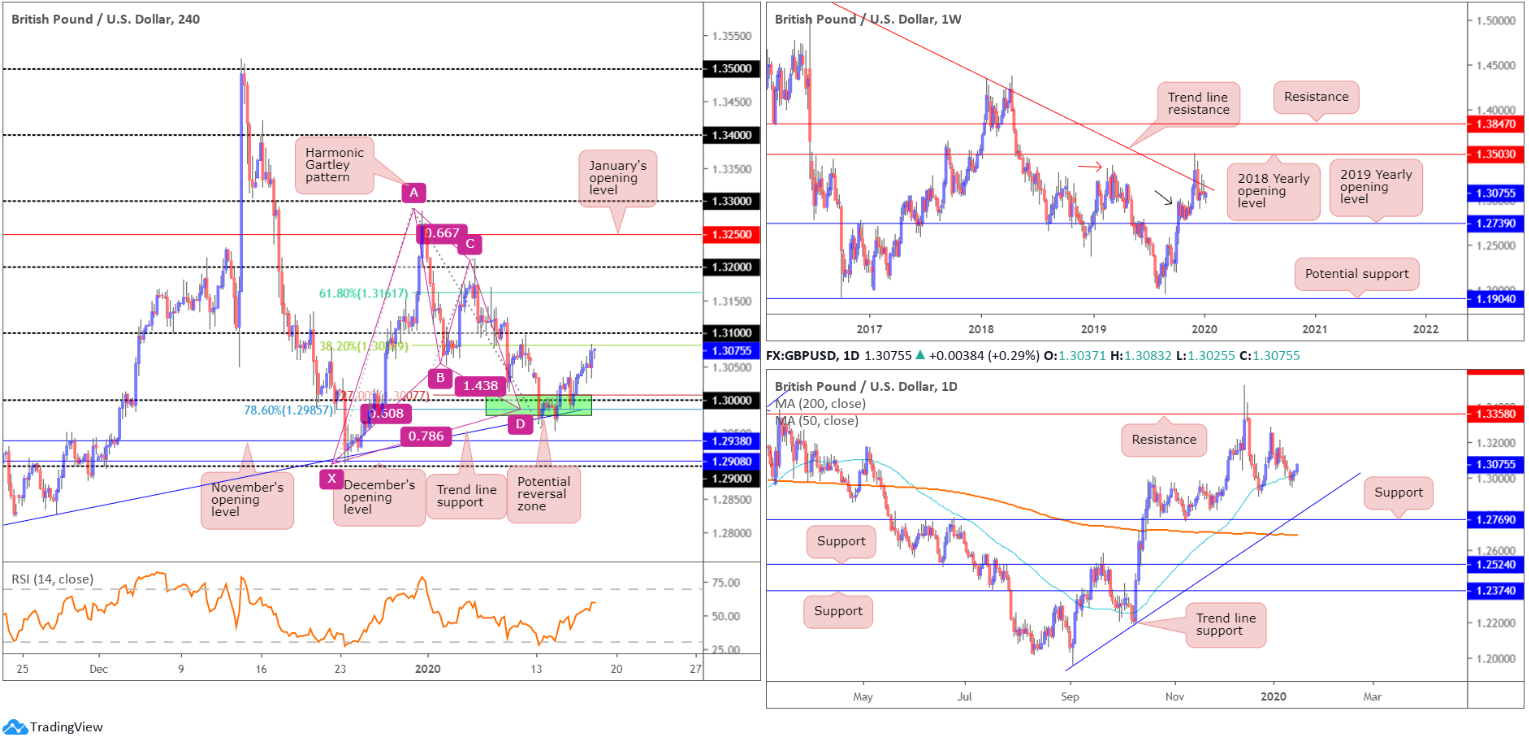
The key figure 1.30. Note (green) this level forms together with a potential H4 harmonic Gartley pattern, boasting an AB=CD equivalent formation and a 78.6% XA retracement at 1.2985 as well as a 127.2% BC projection at 1.3007. Additionally, there’s H4 trend line support, extended from the low 1.2768.
As evident from the H4 timeframe, the harmonic Gartley pattern is holding, with the unit recently testing the 38.2% Fibonacci ratio of legs A-D at 1.3082. This is typically considered the first take-profit target, followed by the 61.8% Fibonacci retracement at 1.3161.
As for the higher timeframes, little change is seen:
Sellers, by way of back-to-back shooting star bearish candlestick patterns, continued to strengthen their grip off long-standing trend line resistance last week, pencilled in from the high 1.5930. This follows a somewhat dominant whipsaw to the 2018 yearly opening level drawn from 1.3503 four weeks ago. Buyers are attempting to defend nearby demand around the 1.2939 region (black arrow), seduced by the recent break of the notable high at 1.3380 (red arrow). The fact we’re holding the current trend line, though, implies we might see a push lower to the 2019 yearly opening level at 1.2739, consequently tripping sell stops from any traders long the aforementioned demand zone.
A closer reading on the daily timeframe shows the 50-day SMA (blue – 1.3016) remains in the frame. Recent movement witnessed a minor breach of the dynamic value to lows of 1.2954, though price is currently attempting to elbow its way north. In the event of a move lower, another layer of support that could eventually enter the fight on the daily chart is 1.2769, which happens to merge closely with trend line support, pencilled in from the low 1.1958 and the 200-day SMA (orange – 1.2687). With respect to resistance, the only level of interest right now sits at the 1.3284 December 31st high and 1.3358, which capped upside since mid-June 2019.
Areas of consideration:
The H4 Gartley pattern highlighted above had an entry point around the 1.30ish region, preferably the 78.6% Fibonacci retracement at 1.2985, with stop-loss order placement set beneath the X point – the 1.29 handle. In terms of take-profit targets, traders have likely reduced risk to breakeven around the 38.2% Fibonacci retracement at 1.3082, with the expectation a run to the 61.8% Fibonacci retracement at 1.3161 will emerge.
AUD/USD:
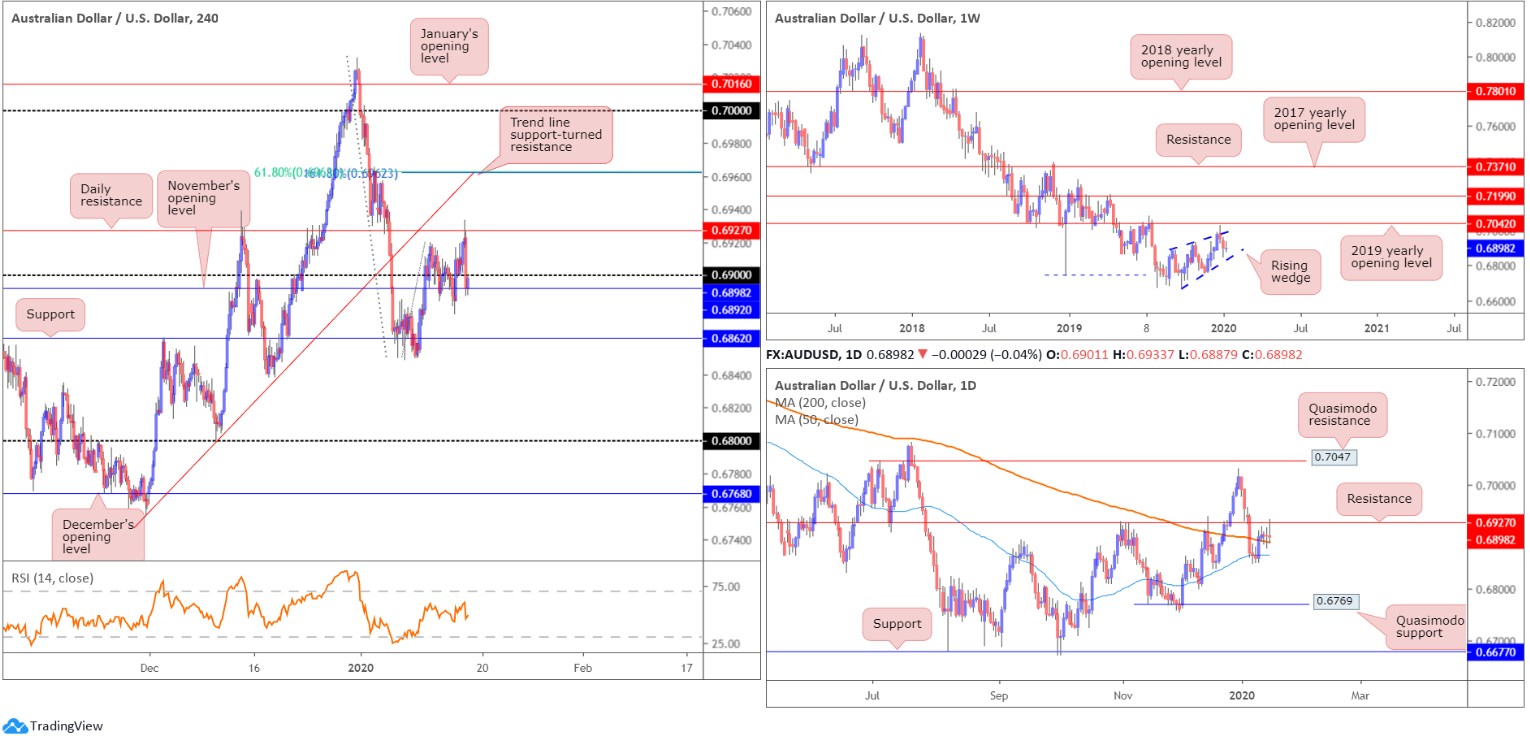
The pair’s upside correction met heavy supply Thursday as the US dollar firmed on solid US retail sales data. This – coupled with daily price crossing swords with resistance at 0.6927 – guided EUR/USD south of the 0.69 handle on the H4 timeframe and connected with November’s opening level at 0.6892.
Resistance – beyond the current daily level at 0.6927 – falls in around a H4 trend line support-turned resistance, extended from the low 0.6754. Retaking November’s opening level could lead to support at 0.6862 entering the fight. Another point of interest on the H4 timeframe is the 161.8% Fibonacci extension at 0.6962 and a 61.8% Fibonacci retracement at 0.6963. Note these levels line up closely with the said H4 trend line resistance.
The situation on the weekly timeframe remains unchanged:
Since registering a bottom in late September at 0.6670, AUD/USD has been busy carving out what appears to be a rising wedge formation, typically considered a continuation pattern. Recent selling witnessed price decline back into the rising wedge, with a break lower possible given the primary downtrend in this market has faced a southerly bearing since early 2018.
Daily price, after finding support off the 200-day SMA (orange – 0.6889), has upside capped by the noted daily resistance at 0.6927. A break higher has the 0.7031 December 31 high and Quasimodo resistance at 0.7047 to target. Beyond the aforementioned 200-day SMA, the 50-day SMA (blue – 0.6865) resides close by, followed by a reasonably clear run to Quasimodo support coming in at 0.6769.
Areas of consideration:
In a nutshell, chart studies suggest further selling on the weekly timeframe, with a break of the rising wedge pattern potentially on the menu. Daily resistance at 0.6927, given its history, is likely to continue holding, causing longs off the 200-day SMA problems.
Shorter-term movement, based on the H4 timeframe, offers limited areas of interest at the moment. A break beneath 0.6862, however, could strike a chord, unlocking potential bearish themes towards the 0.68 handle, followed by daily Quasimodo support at 0.6769.
USD/JPY:
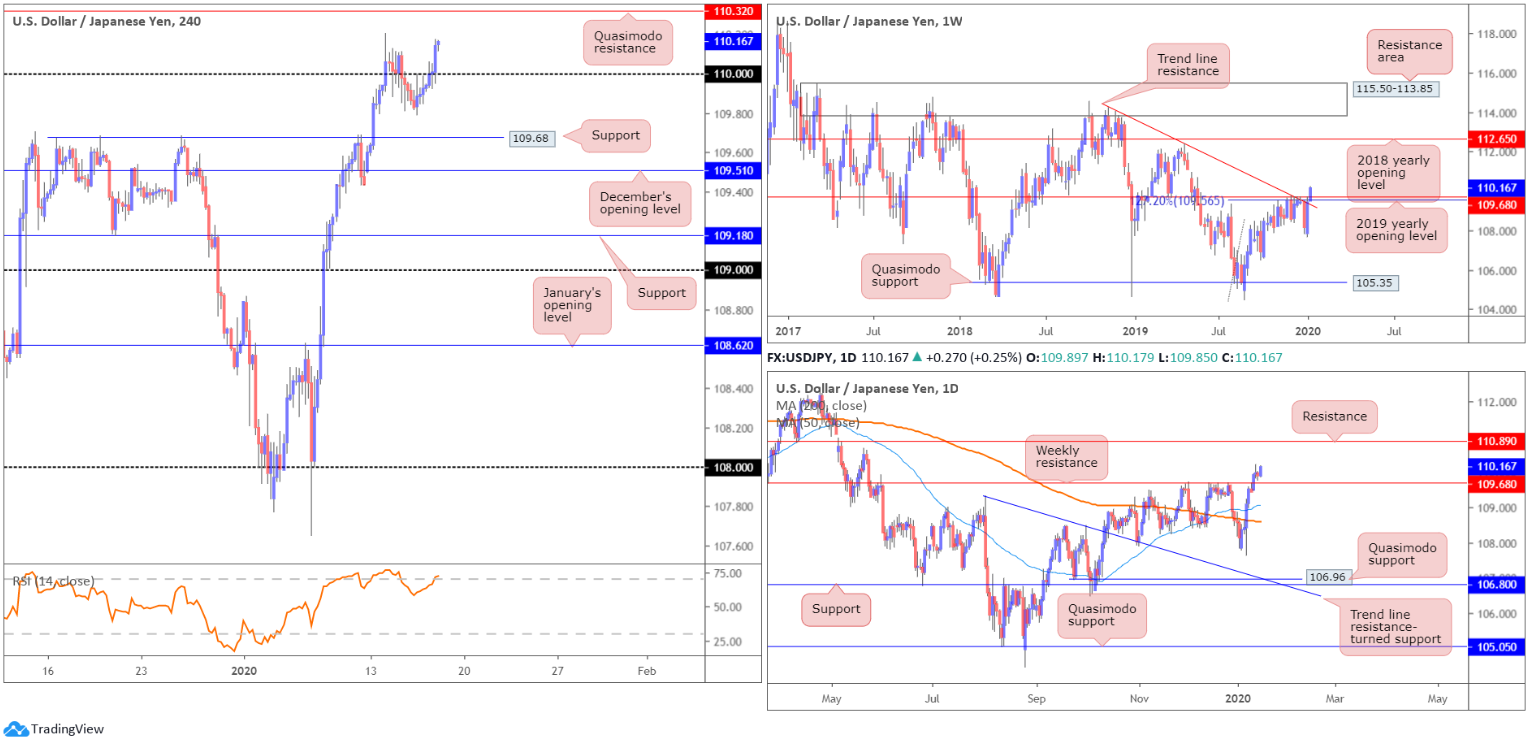
USD/JPY bulls entered a bullish phase Thursday, reclaiming Wednesday’s loss and climbing back above the 110 handle. Broad-based USD bidding, on the back of strong US retail sales, and advancing US equities, lifted the pair to highs of 110.18 yesterday. The next port of call, in terms of resistance on the H4 timeframe, falls in around Quasimodo resistance at 110.32, drawn from mid-May 2019.
On a wider perspective, weekly resistances (comprised of a 127.2% Fibonacci extension at 109.56 [taken from the low 104.44], the 2019 yearly opening level at 109.68 and trend line resistance, extended from the high 114.23) gave way in recent trading, perhaps setting a long-term stage for a run to the 2018 yearly opening level at 112.65. A decisive weekly close above the said resistances adds conviction to this theory.
A closer reading of price action on the daily timeframe shows price crossed weekly resistance in the shape of a near-full-bodied bullish candle Monday. This possibly clears the river north towards resistance at 110.89.
Areas of consideration:
All three timeframes point to further upside today/early next week. That being the case, a retest at 110 could be something to watch out for today. A successful retest, preferably by way of a H4 bullish signal, is likely enough to entice further buying. The idea behind a H4 candlestick confirmation is simply to help identify buyer intent off the round number 110, which, as most already understand, are prone to whipsaws.
Entry and risk can be determined according to the candlestick pattern, while the first take-profit target is seen at the H4 Quasimodo resistance 110.32, with daily resistance 110.89 next on tap.
USD/CAD:
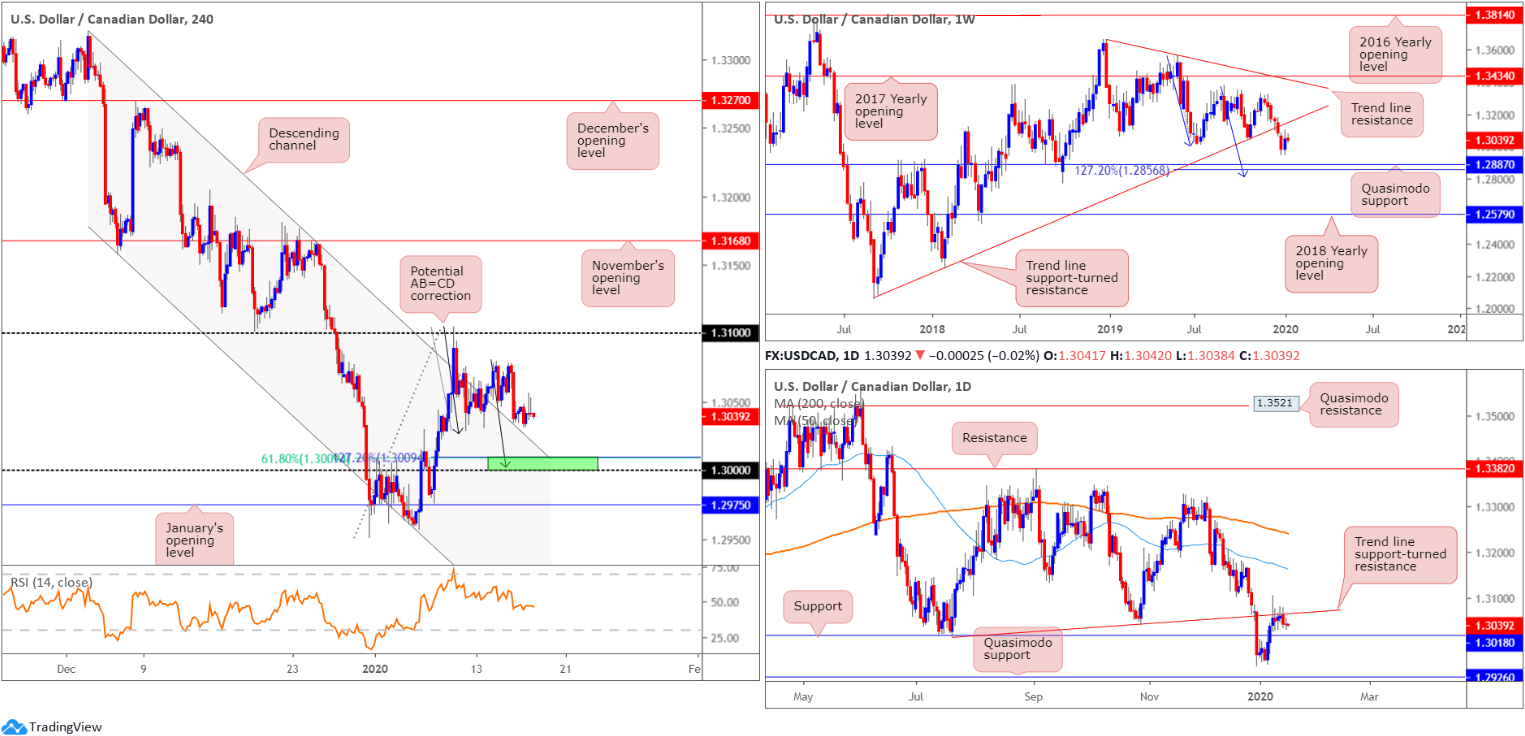
The pair extended its sideways phase Thursday, confined within a tight range south of 1.3050. Crude oil sported a mildly positive tone, testing highs of $58.86/bbl, likely keeping a lid on any USD-led upside movement in USD/CAD.
Technical research has the H4 candles hovering a few points north of channel resistance-turned support, taken from the high 1.3320. Another interesting area of support resides close by around the key figure 1.30, bolstered (green) by a potential AB=CD correction (black arrows), a 61.8% Fibonacci retracement at 1.3009 and a 127.2% Fibonacci extension at the same value.
Structure on the weekly timeframe shows price could potentially swing either way. To the upside, we have trend line support-turned resistance, extended from the low 1.2061. Lower on the curve, the pair exhibits scope to test Quasimodo support at 1.2887, positioned close by a 127.2% AB=CD bullish correction (blue arrows) at 1.2856. The immediate trend has faced north since bottoming in September 2017; however, this move could also be considered a deep pullback in a larger downtrend from the 1.4689 peak in early January 2016.
The story on the daily timeframe has price action fading the underside of a trend line support-turned resistance, taken from the low 1.3015. Sellers from this point, nonetheless, may find active buyers off support at 1.3018.
Areas of consideration:
The key figure 1.30. This level – coupled with H4 AB=CD confluence, H4 Fibonacci studies and daily support at 1.3018 – is likely to entice buyers into the market. Traders threatened by the possibility of a fakeout materialising through 1.30 (common viewing around psychological levels) may wait for additional candlestick confirmation to form before pulling the trigger. Not only will this help recognise buyer intent, the candle signal provides entry and risk levels to work with.
USD/CHF:
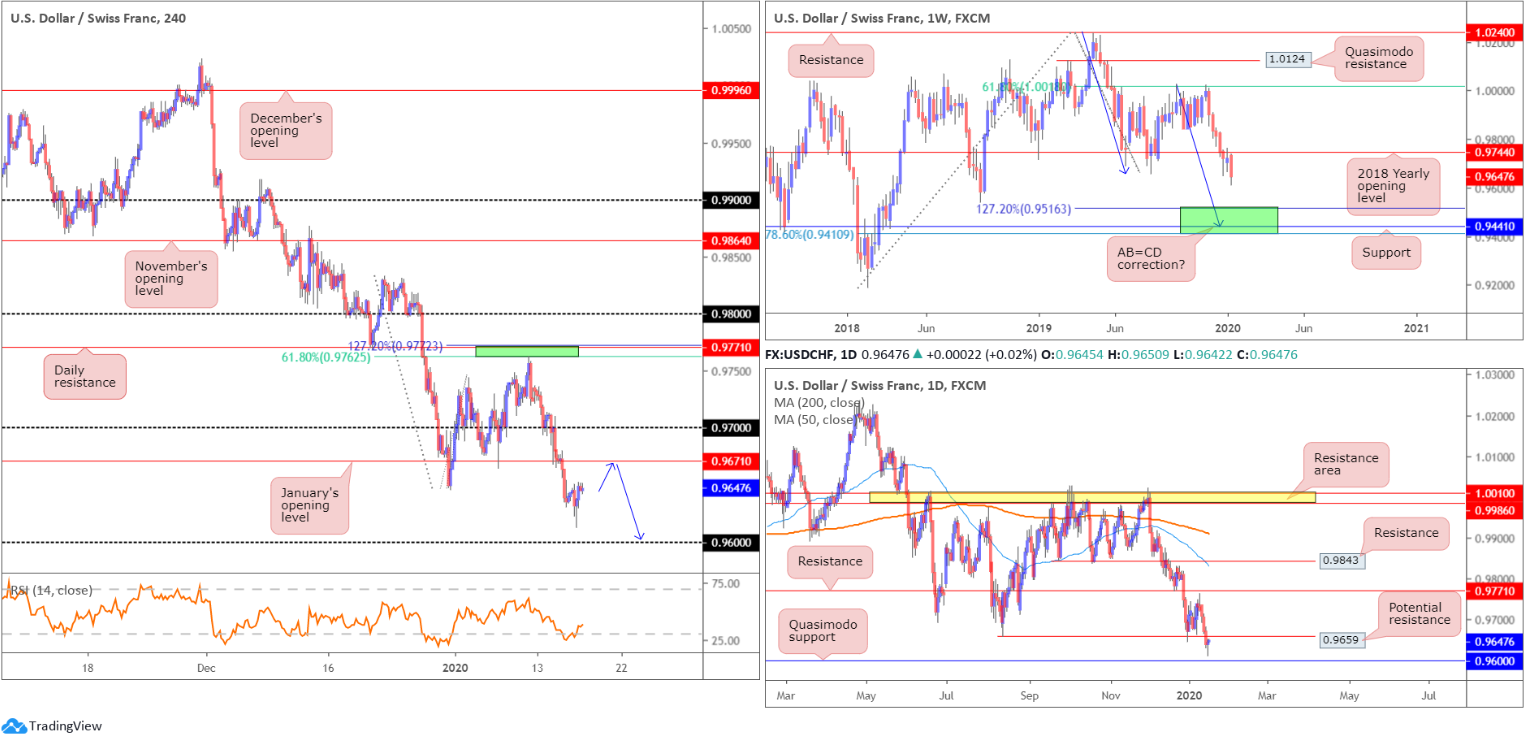
Snapping a four-day bearish phase from 0.9762, USD/CHF turned mildly higher Thursday, adding nearly 0.10%.
Price action bottomed north of the 0.96 handle at 0.9613 as the buck benefitted from upbeat US retail sales figures. Technically, the correction could continue to January’s opening level at 0.9671, as potential resistance.
Daily flow, on the other hand, can be seen hovering a few points beneath possible resistance at 0.9659. This level could hold price lower, leaving January’s opening level unchallenged. Further downside on this scale has Quasimodo support at 0.9600 in sight.
Higher-timeframe technical analysis has weekly price establishing firm ground south of the 2018 yearly opening level at 0.9744. The next downside target sits in the range of 0.9410/0.9516 (comprised of a 78.6% Fibonacci retracement at 0.9410, support at 0.9441 and a 127.2% AB=CD bullish correction [black arrows] at 0.9516 – green]).
Areas of consideration:
Traders short from 0.9772/0.9762 remain in a strong position; the next downside target falls in at 0.9600.
Owing to the noted chart studies, a pullback/retest at January’s opening level 0.9674 may serve as a sell zone for many traders, given daily resistance is also lurking close by at 0.9659. Aggressive stop-loss placement is seen around 0.9682; conservative traders, though, may opt to position risk according to the rejection candle’s structure, if any.
Dow Jones Industrial Average:
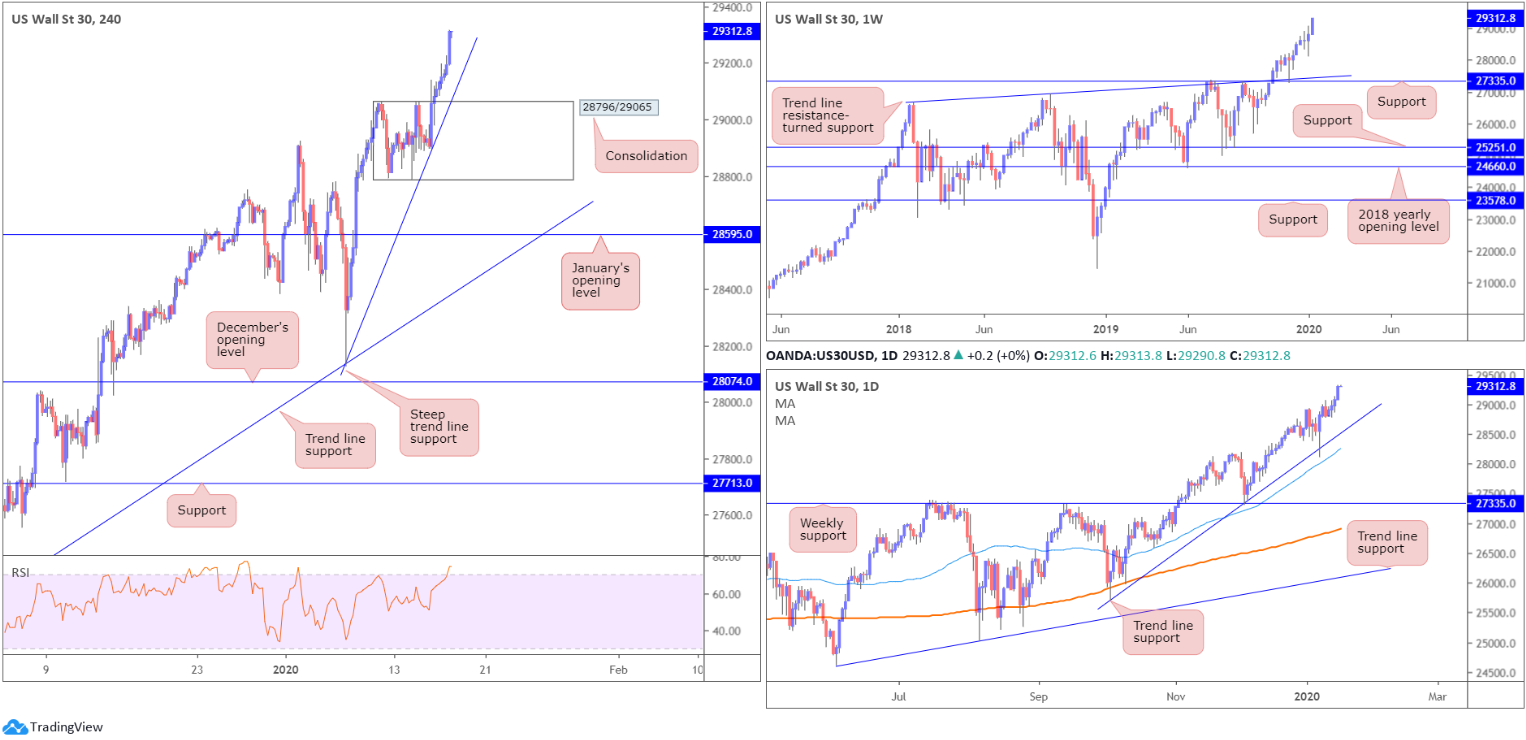
US equities flourished once again Thursday, with all three major US benchmarks concluding at record peaks. Solid economic data injected additional optimism into the markets, following the signing of a trade truce between the US/China on Wednesday. The Dow Jones Industrial Average added 267.42 points, or 0.92%; the S&P 500 advanced 27.52 points, or 0.84% and the tech-heavy Nasdaq 100 ended higher by 83.33 points, or 0.99%.
The breakout through the top edge of the H4 consolidation between 29065 and 28796 saw the candles reach highs of 29315. With limited pullback seen following the push higher, a dip lower may be on the cards today as traders begin liquidating positions into the week’s close. Steep H4 trend line support, taken from the low 28130, is a logical starting point, in terms of probable support. A break of this line, nonetheless, exposes 29065.
Technical research on the weekly timeframe, despite recently registering fresh all-time-highs, enters Friday unchanged:
Following a weekly hammer candlestick pattern (considered a buy signal at troughs), formed six weeks back at the retest of support drawn from 27335, along with trend line support etched from the high 26670, the index continued to advance higher.
The daily timeframe also displays unchanged analysis:
Trend line support, extended from the low 25710, recently entered the fray, bolstered by additional support located nearby from the 50-day SMA (blue – 28255).
Areas of consideration:
With the uptrend remaining strong, and daily price trading from trend line support, traders likely have eyes on a retest of either the noted H4 trend line support, or H4 support at 29065.
A retest, preferably in the shape of a H4 bullish candlestick signal (entry/risk levels can be determined according to this formation), would likely be sufficient for traders seeking to join this seemingly eternal trend.
XAU/USD (GOLD):
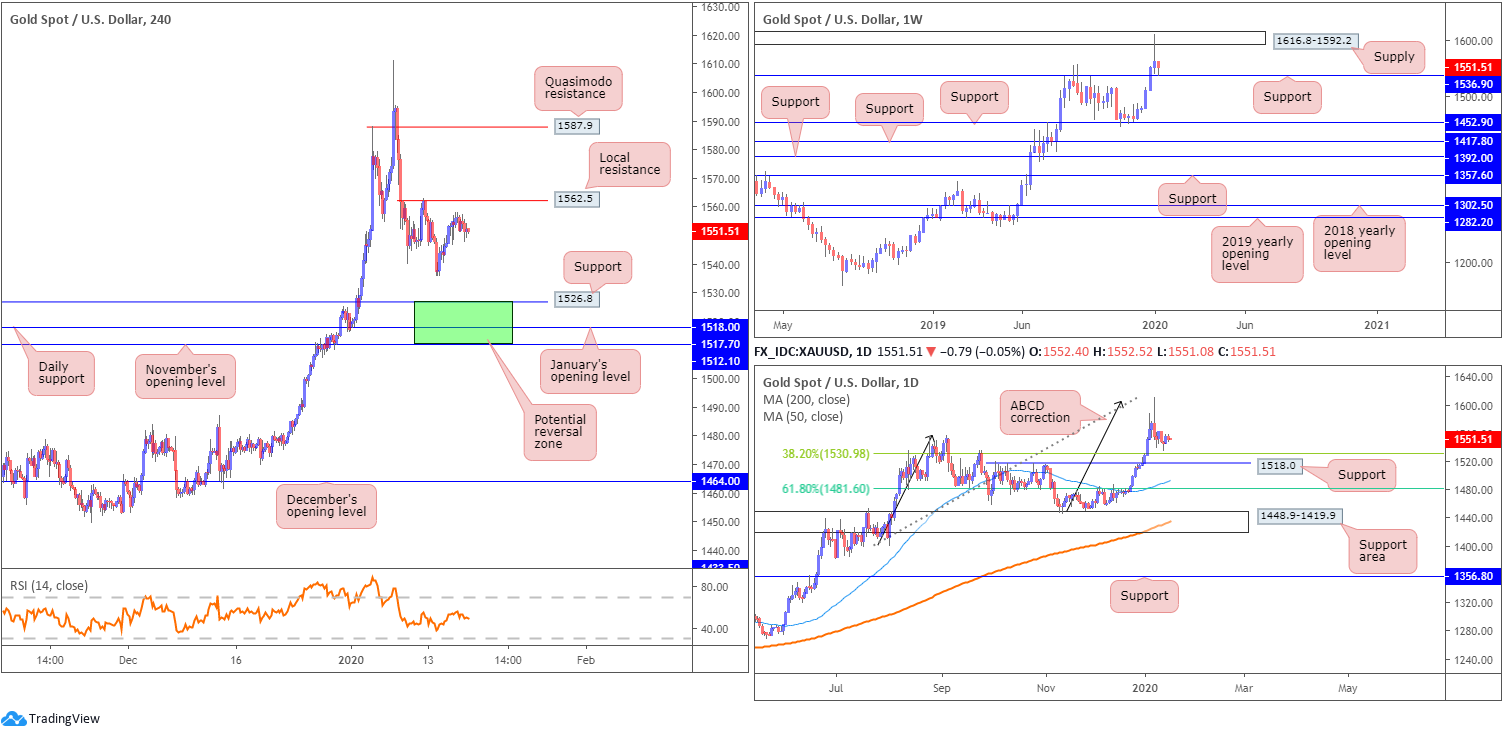
XAU/USD spot prices remained reasonably subdued Thursday, losing a little more than $3, or 0.25% into the close. In view of yesterday’s lacklustre performance, much of the following report will echo thoughts put forward in recent analysis.
The top of the technical pile has weekly price recovering from support at 1536.9, following a dominant rejection out of supply at 1616.8-1592.2. A violation of the said support could prompt additional selling towards another layer of support residing at 1452.9.
A potential point of support worth bearing in mind on the daily timeframe is the 38.2% Fibonacci retracement at 1530.9, closely followed by 1518.0. The former may form an initial take-profit target for traders short the ABCD bearish correction (black arrows) at 1608.0.
H4 structure also displays an area of support (green) between November’s opening level at 1512.1 and support at 1526.8 (daily support at 1518.0 and January’s opening level at 1517.7 seen within). Resistance, on the other hand, may form off 1562.5, though a break of this barrier suggests a run towards Quasimodo resistance plotted at 1587.9.
Areas of consideration:
Should a selloff occur, 1512.1/1526.8 on the H4 timeframe may be a zone worth watching for signs of buyer intent. Not only does it boast a strong mix of confluence, the support zone forms in line with the primary trend.
Continued buying, along with a H4 close north of H4 resistance at 1562.5, also unlocks the door to potential bullish themes, targeting H4 Quasimodo resistance at 1587.9, closely shadowed by the lower edge of weekly supply at 1592.2.
The accuracy, completeness and timeliness of the information contained on this site cannot be guaranteed. IC Markets does not warranty, guarantee or make any representations, or assume any liability regarding financial results based on the use of the information in the site.
News, views, opinions, recommendations and other information obtained from sources outside of www.icmarkets.com.au, used in this site are believed to be reliable, but we cannot guarantee their accuracy or completeness. All such information is subject to change at any time without notice. IC Markets assumes no responsibility for the content of any linked site.
The fact that such links may exist does not indicate approval or endorsement of any material contained on any linked site. IC Markets is not liable for any harm caused by the transmission, through accessing the services or information on this site, of a computer virus, or other computer code or programming device that might be used to access, delete, damage, disable, disrupt or otherwise impede in any manner, the operation of the site or of any user’s software, hardware, data or property.


