
Key risk events today:
China GDP y/y; China Fixed Asset Investment ytd/y; China Industrial Production y/y.
(Previous analysis as well as outside sources – italics).
EUR/USD:
Painful US data by way of unemployment claims (albeit outdid consensus) and another worrying regional Fed survey did little to hamper dollar gains Thursday. The US dollar index powered through 100.00, reaching highs of 100.30, before marginally pulling back into US trade.
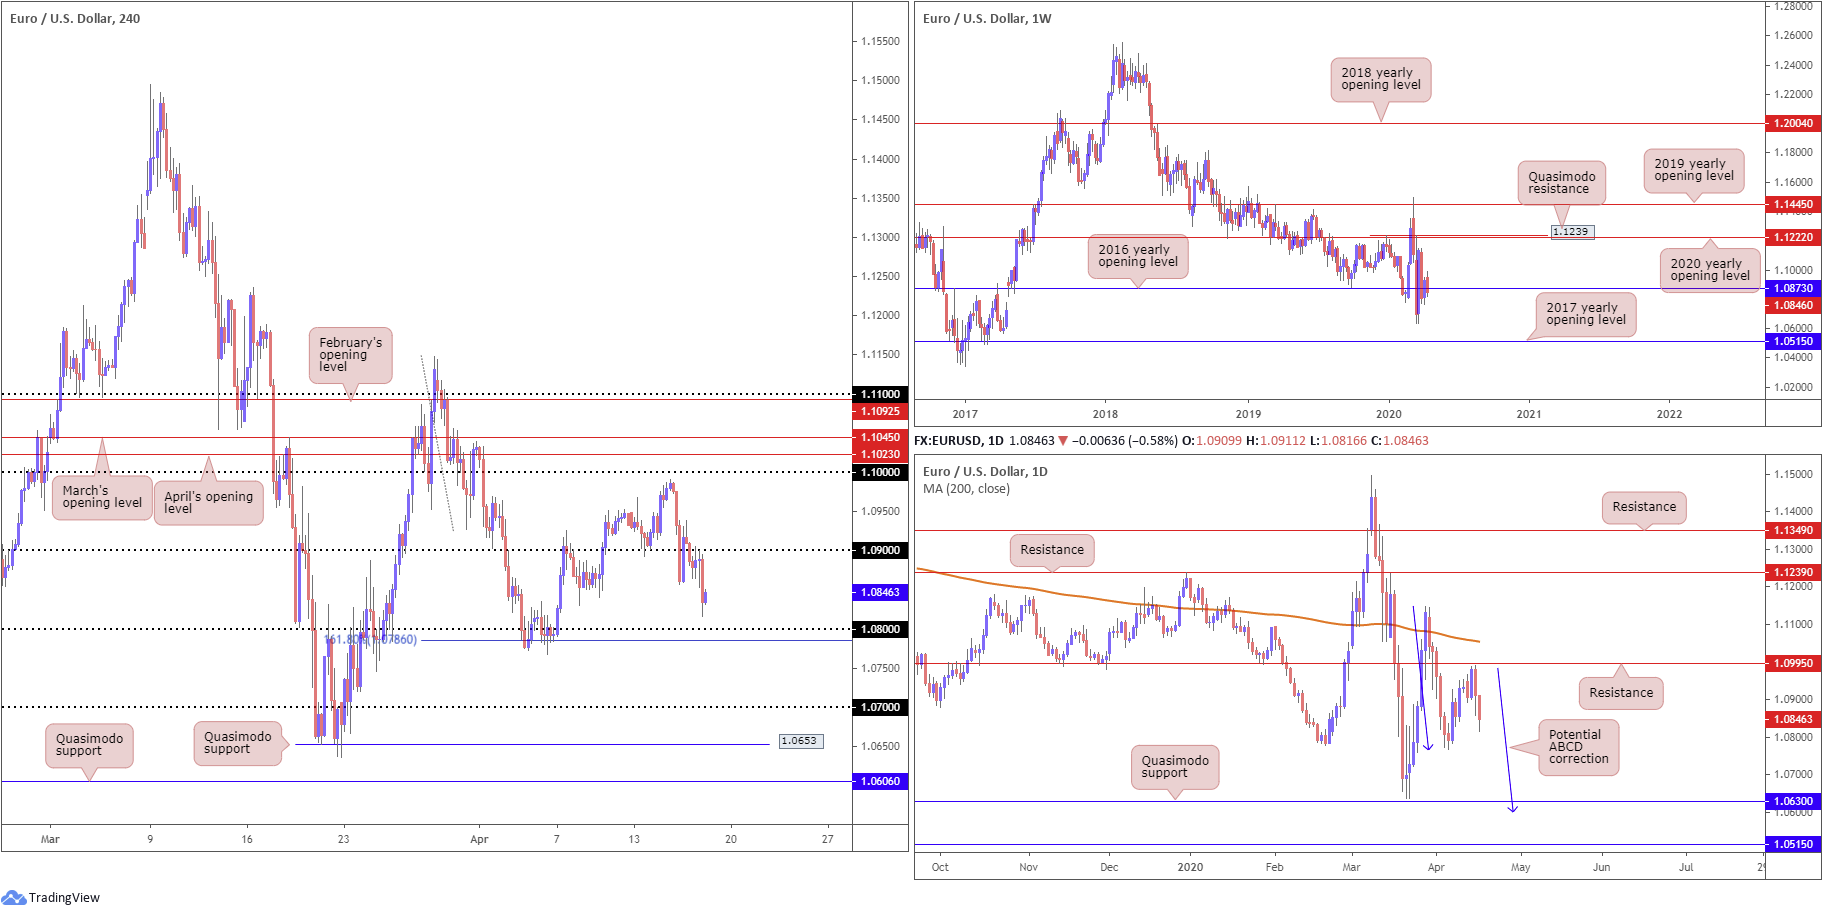
Technical developments on EUR/USD has price action absorbing bids south of 1.09, with the pair gearing up for a test of 1.08, followed closely by a 161.8% Fibonacci extension point at 1.0786. Beyond the said levels, technical eyes are likely fixed on 1.07, owing to the lack of H4 support in between.
Further afield, weekly price is engaging with its 2016 yearly opening level at 1.0873. Skies above here are reasonably blue; a run to the 2020 yearly opening level at 1.1222, shadowed by a Quasimodo resistance at 1.1239 is certainly not out of the question. To the downside, multi-year lows at 1.0635 are seen, with subsequent moves shining the spotlight on the 2017 yearly opening level at 1.0515.
From the daily timeframe, however, price action ran into waters just beneath resistance at 1.0995 in recent trading, which, as you can see, is stationed beneath a 200-day SMA (orange – 1.1054). Continued downside could see the 1.0768 April 6 low come into existence. Beyond here, Quasimodo support at 1.0630 is also a viable floor, closely shadowed by a potential ABCD correction (blue arrows) at 1.0597.
Areas of consideration:
1.08, given its close connection with a 161.8% Fibonacci extension point at 1.0786, could prompt an intraday rebound today. Conservative traders may seek additional candlestick confirmation prior to pulling the trigger, however.
A break of 1.08, nevertheless, may trigger breakout selling. Traders are urged to remain aware of possible support emerging from the 1.0768 April 6 low. Though beyond this base, we appear free to shake hands with 1.07.
GBP/USD:
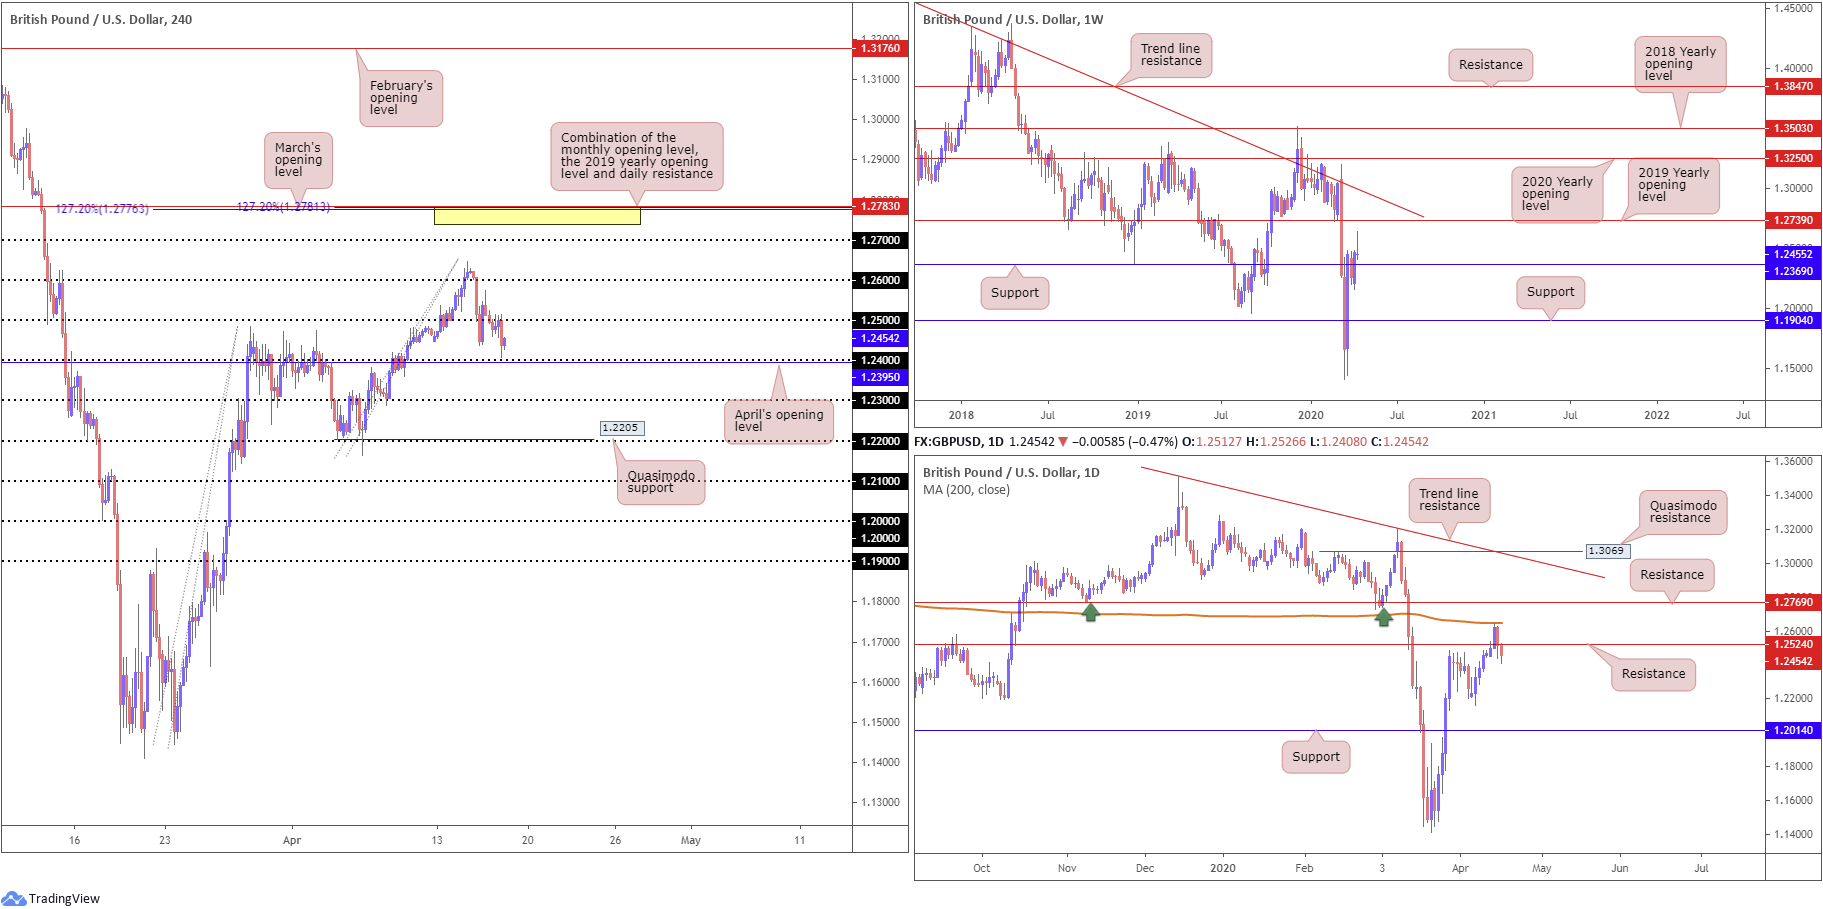
Down for a second consecutive session, GBP/USD relinquished 1.25 (and retested the underside of the base) Thursday leading to a follow-through move to waters just ahead of the 1.24 handle and April’s opening level at 1.2395.
Across the border, higher-timeframe flow on the weekly chart has price action chalking up what appears to be a shooting star candlestick pattern – a strong selling wick. Yet, sellers likely lack conviction here due to support residing around 1.2369. Lower on the curve, daily movement overrun support at 1.2524 yesterday, following Tuesday’s rejection off the 200-day SMA (orange – 1.2648). This may shift focus towards the 1.2163 April 7 low as the next viable base, assuming we overthrow weekly support underlined above at 1.2369, of course.
Areas of consideration:
With weekly support at 1.2369 circulating sub 1.24, a fakeout beneath the said round number to the weekly base is a potential scenario worthy of the watchlist. A close back above 1.24 would, for most price-action traders, likely be considered a buy signal, given the weekly connection.
Breakout selling, despite daily price trading beneath resistance at 1.2524, is a chancy venture for obvious reasons: the current weekly support.
AUD/USD:
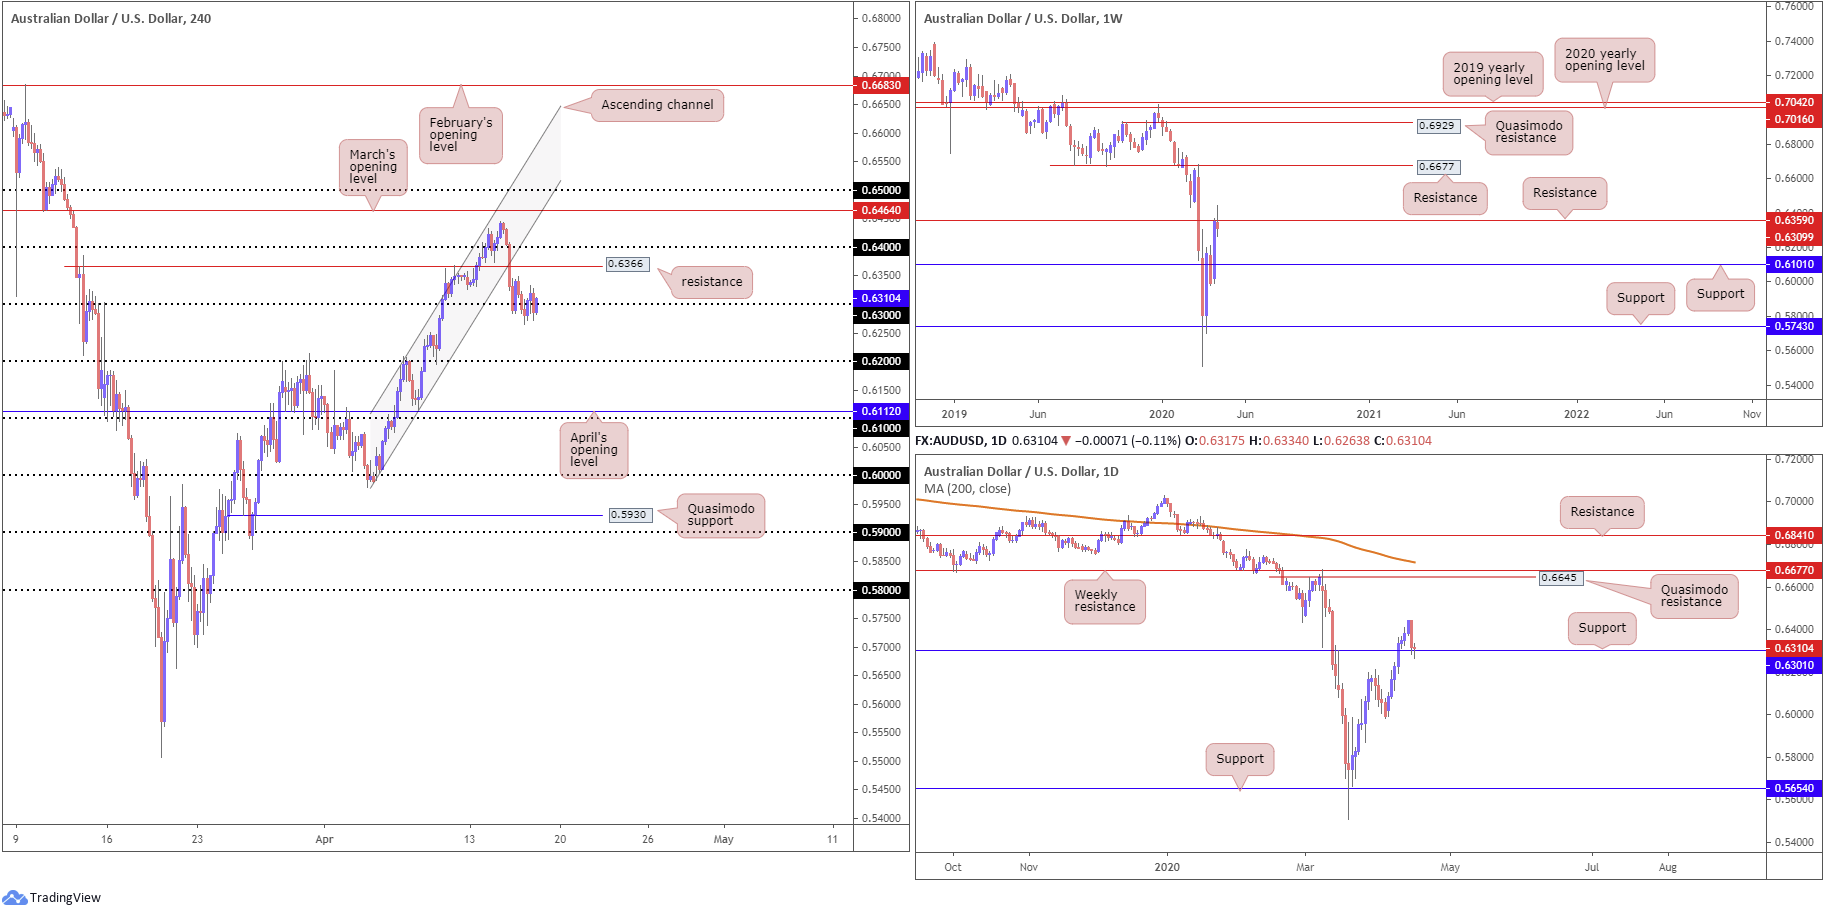
AUD/USD movement concluded relatively unmoved Thursday, clutching to 0.63 around the prior day’s low at 0.6284. In view of yesterday’s lacklustre performance, the following piece will echo points put forward in Thursday’s technical briefing.
Based on the H4 timeframe, price action recently threw itself south of 0.64 and attacked nearby support at 0.6366 as well as channel support, taken from the low 0.5988 (both serving resistances).
H4 price continues to engage with 0.63, bolstered closely with daily support pencilled in at 0.6301. The problem buyers face from here, technically speaking, is weekly sellers are attempting to make a show off resistance at 0.6359, formed by a potential shooting star candlestick pattern – generally considered a bearish signal among candlestick enthusiasts.
Areas of consideration:
Technical studies suggest lower levels could be on the cards from weekly resistance. Due to the theory that higher-timeframe structure tends to overrule the lower timeframes, bearish scenarios sub 0.63 could be in the offing today or early next week, targeting 0.62 as an initial take-profit zone.
USD/JPY:
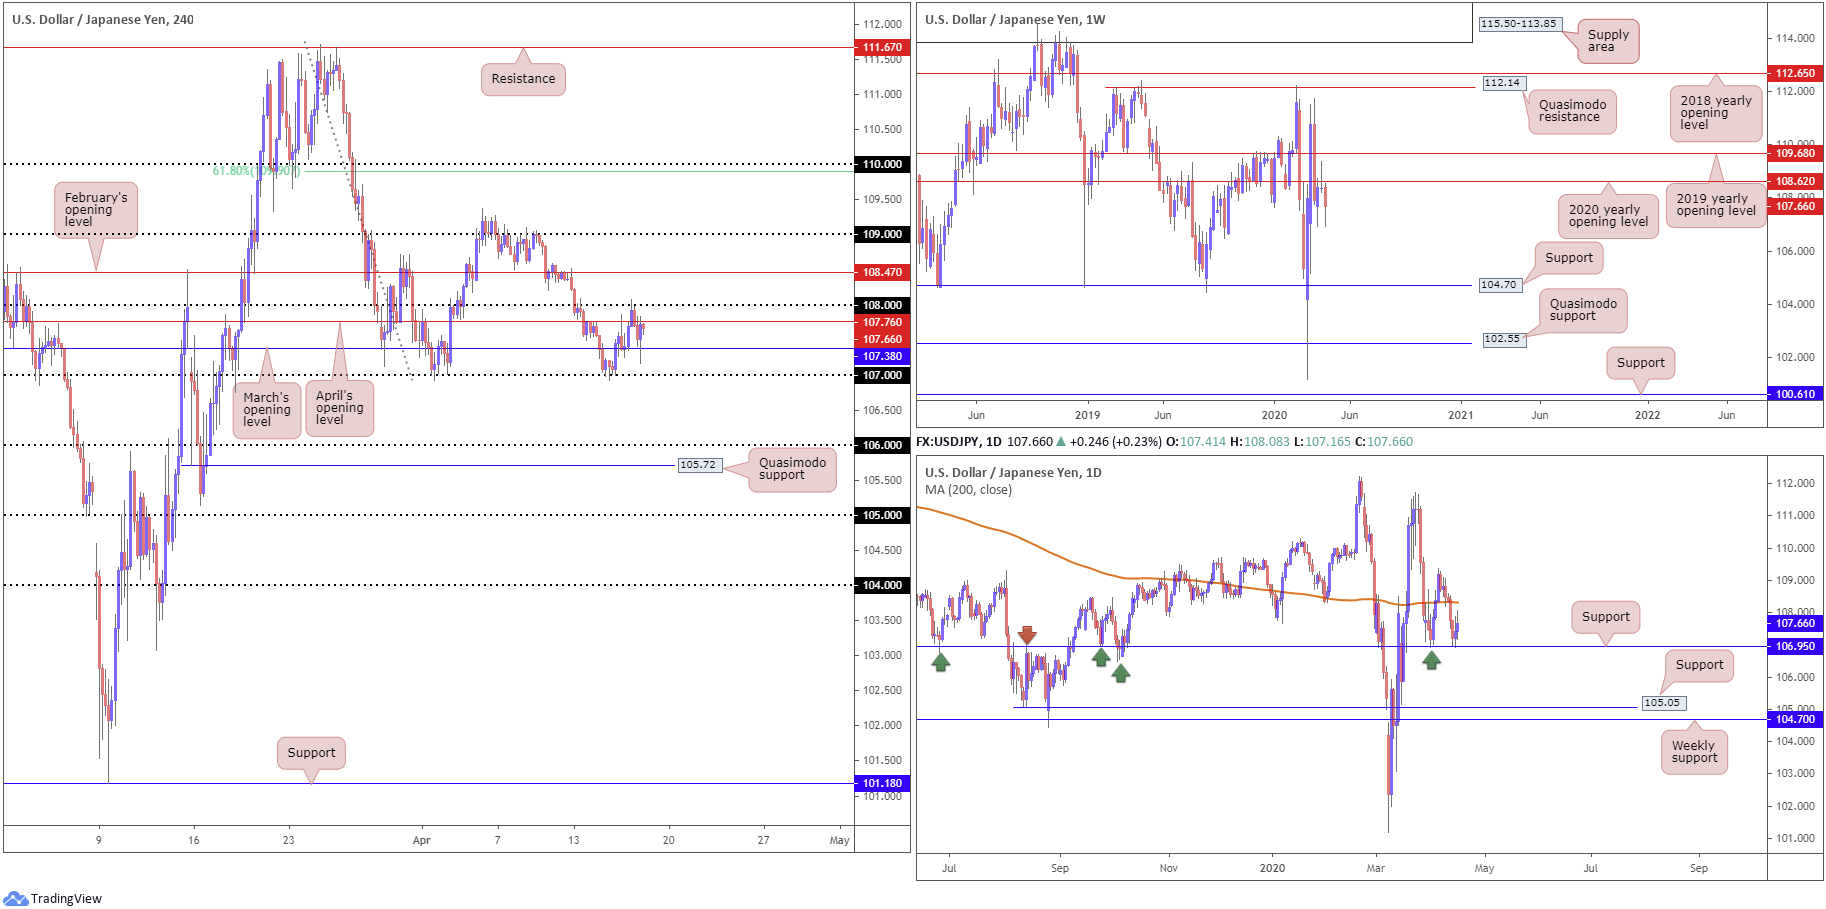
USD/JPY entered Thursday on strong footing, lifted on the back of technical buying from March’s opening level at 107.38 and a broad-based USD bid. We crossed swords with 108 heading into Europe, with the unit failing to sustain gains past 108.08 before turning lower. 107.38 and April’s opening level at 107.76 remain immediate levels to be aware of on the H4 timeframe as we move into Friday. 108/7 are also barriers to keep an eye on.
Daily support at 106.95 comes together with 107, therefore this remains a dominant fixture in this market. Despite this, the vibe on the weekly timeframe communicates a bearish tone – price action concluded last week by way of a clear-cut shooting star candlestick configuration off the 2020 yearly opening level at 108.62, with this week putting in a strong follow-through move to the downside. The next support target is not seen until 104.70. Note this figure also represents the lower boundary of a multi-month range between Quasimodo resistance at 112.14.
Areas of consideration:
Weekly price suggesting lower levels certainly places a question mark on further gains above 108. Although additional upside is not out of the question, traders are urged to pencil in the possibility of moves materialising through 107, perhaps re-opening the door for bearish scenarios to 106.
USD/CAD:
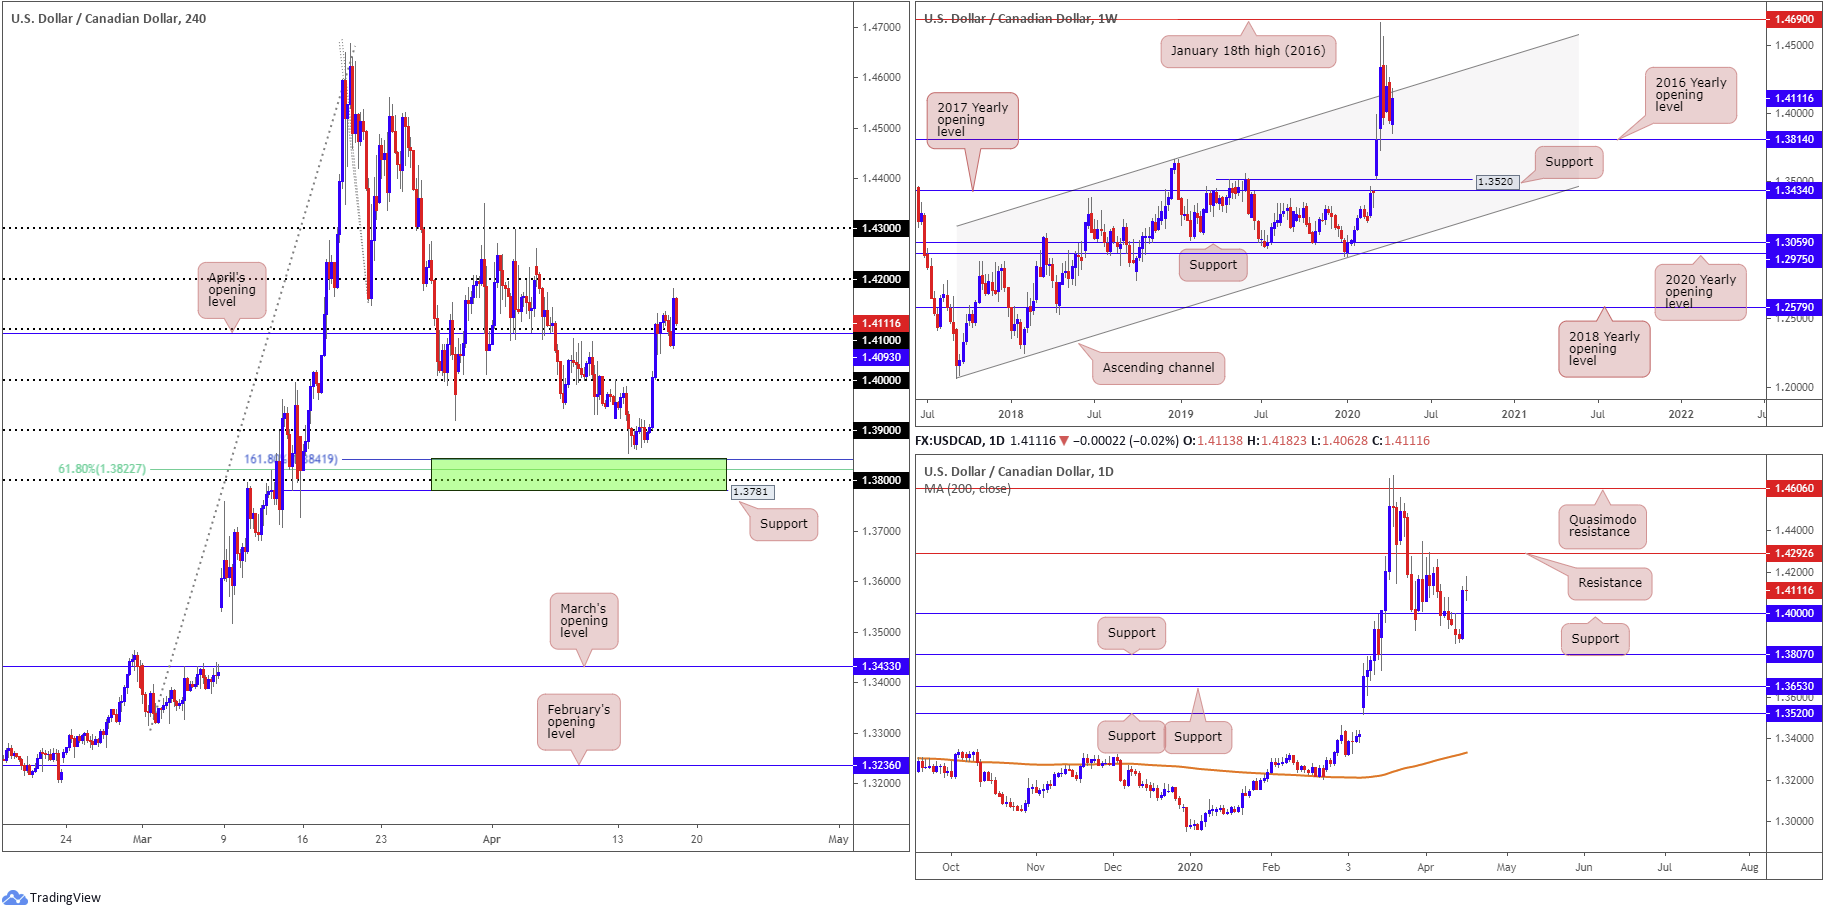
In the form of a clear-cut doji indecision candle, USD/CAD wrapped up Thursday unchanged.
For those who read Thursday’s technical briefing you may recall the following piece (italics):
Until reconnecting with weekly channel resistance, buyers may have the upper hand. Daily price also exhibits scope to track down resistance at 1.4292 and H4 sellers have shown little from 1.41. In fact, a number of buy stops were likely triggered by yesterday’s move to highs at 1.4132.
As a result, we could be heading higher today, shifting focus to possible breakout buying opportunities above 1.41 to 1.42.
As evident from the H4 timeframe this morning, price did indeed explore higher ground above 1.41, reaching highs of 1.4182 and touching gloves with the weekly channel resistance, extended from the high 1.3661. Well done to any readers who managed to the advantage of the recent move higher.
Daily resistance at 1.4292 remains in the frame as a possible medium-term objective to the upside, despite weekly structure entering view.
Areas of consideration:
From a technical standpoint, H4 buyers may look to re-engage with 1.41 as possible support today, based on the daily timeframe showing room to explore higher levels. Traders threatened by weekly price testing channel resistance will likely seek additional confirmation before committing. This could be something as simple as a bullish candlestick signal.
A decisive close through 1.41, on the other hand, indicates sellers may be in the driving seat, seeking the 1.40 handle, which also represents daily support as well.
USD/CHF:
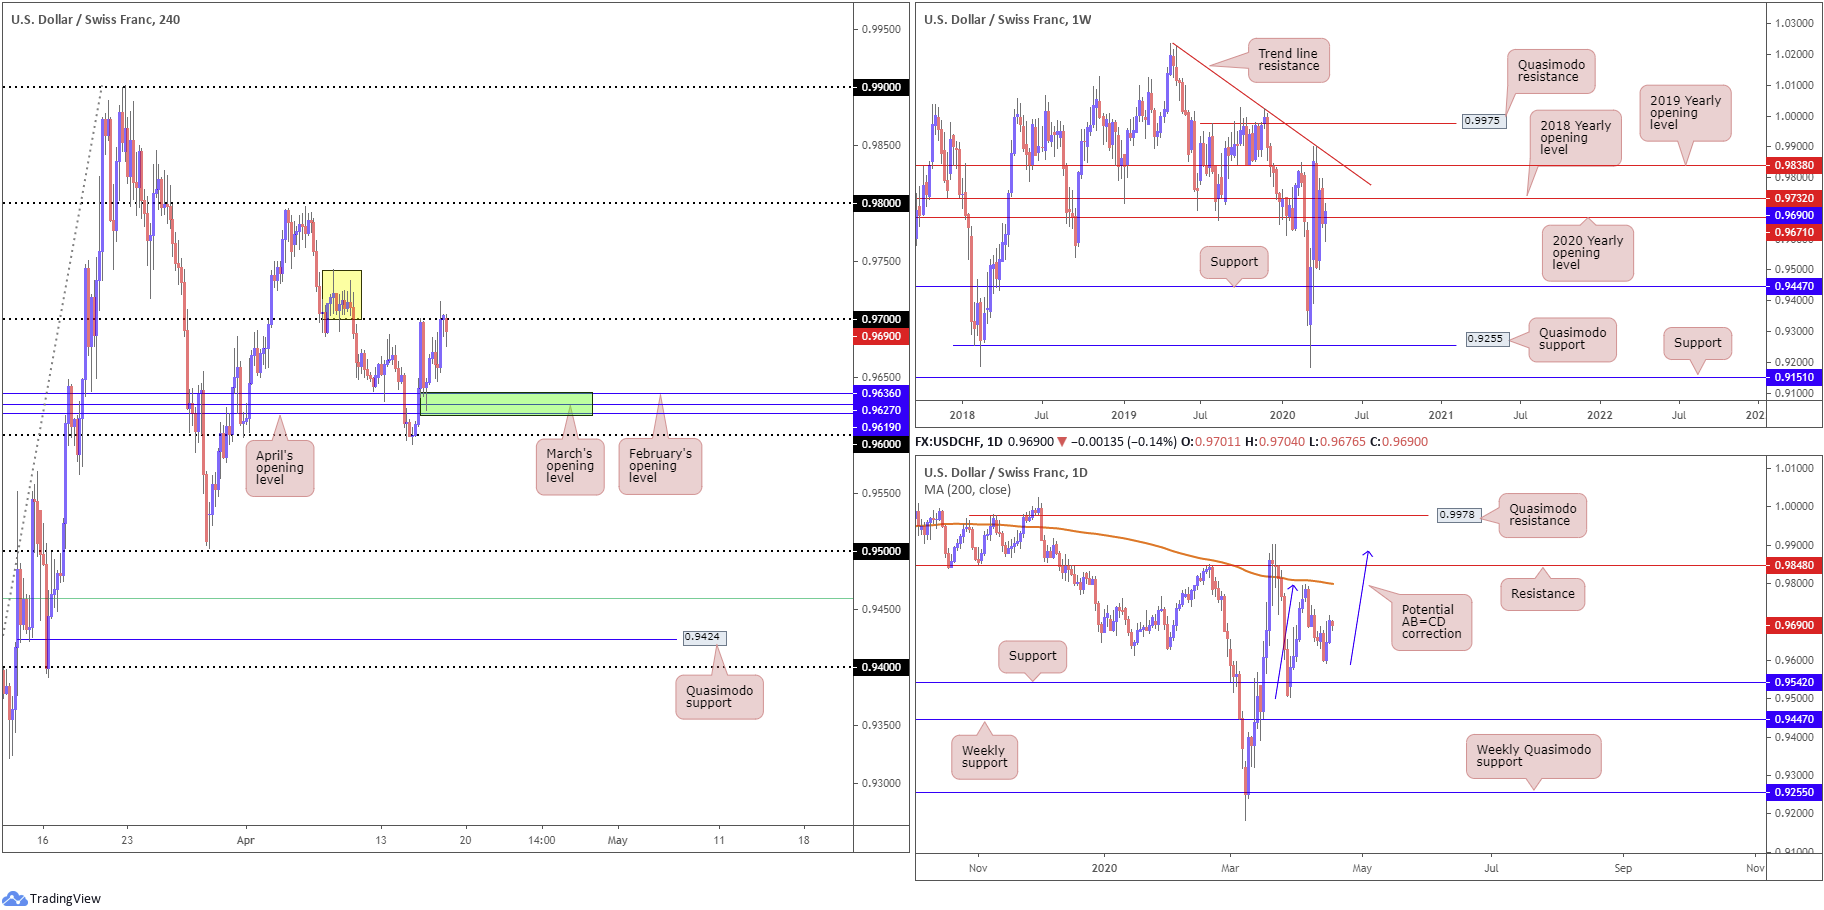
The US dollar finished Thursday higher vs. the Swiss franc, extending recovery gains off 0.9619/0.9636 (an area made up of April, March and February’s opening levels on the H4 timeframe). Adding more than 40 points, or 0.45%, traders will note the pair took a run at 0.97, whipsawing to highs at 0.9715 – enough to trip a portion of buy stops. Hefty supply (yellow) inhabits waters just north of 0.97 with the upper limit stationed around 0.9743. Moves north of here suggests scope towards 0.98.
Further out on the weekly timeframe, technical action has price attempting to establish a position above the 2020 yearly opening level at 0.9671, shifting focus to the 2018 yearly opening level at 0.9732. The daily timeframe, as of current price, offers little in terms of support or resistance. To the upside, resistance is not expected to emerge until reaching the 200-day SMA (orange – 0.9799), followed by 0.9848 and a potential AB=CD correction (blue arrows) at 0.9886, whereas lower on the curve we have support priced in at 0.9542.
Areas of consideration:
Judging by the current H4 candles off 0.97, the round number is unlikely to hold. However, breakout buyers are urged to chalk up 0.9732, the 2018 yearly opening level on the weekly timeframe, as this could hamper upside attempts above 0.97 today.
One possible scenario worthy of attention is a fakeout above 0.97, followed by a test of 0.9732 and a dip back beneath 0.97. Likely fuelled on the back of buy-stop liquidity above 0.97 and weekly sellers, we may see a wave of selling materialise.
Dow Jones Industrial Average:
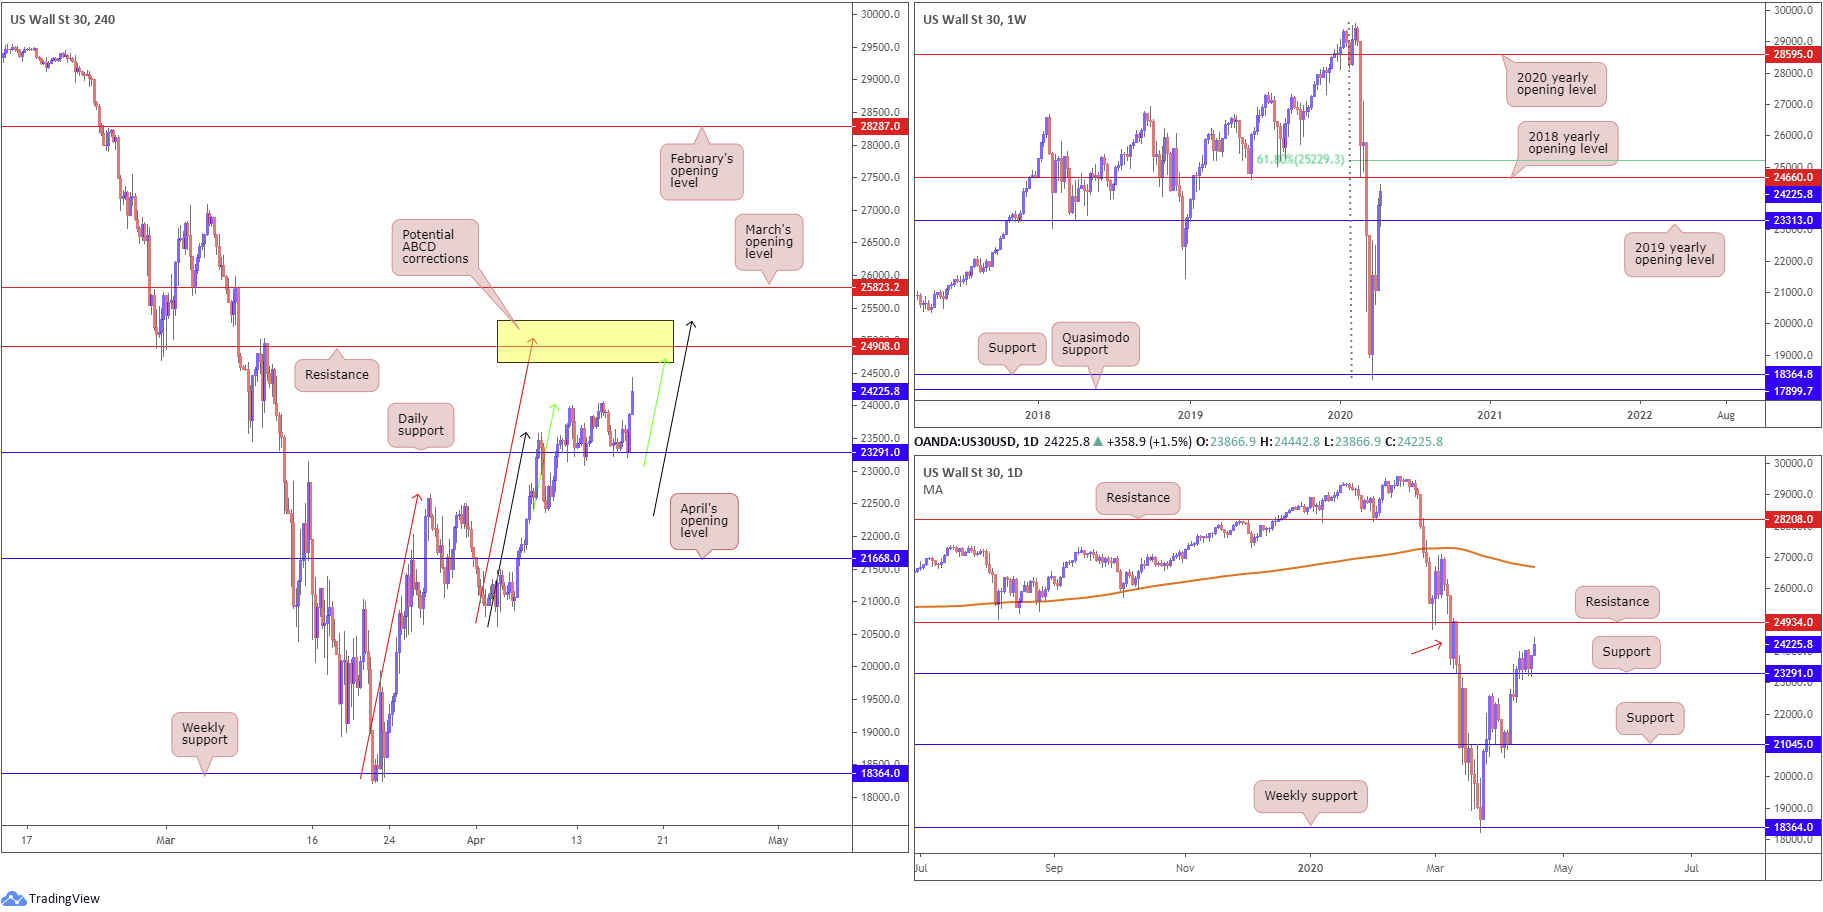
US equities received fresh impetus in recent hours following details of the re-opening guidelines for the US economy, and positive results from clinical trials of Gilead’s Remdesivir for treatment on COVID-19 patients. The Dow Jones Industrial Average added 33.33 points, or 0.14%; the S&P 500 also gained 16.19 points, or 0.58%, and the tech-heavy Nasdaq 100 concluded higher by 165.87 points, or 1.93%.
Technically speaking, the recent boost has positioned the H4 candles within striking distance of 25317/24660. The zone is made up of a H4 resistance level at 24908, three potential ABCD completions at 25028 (red arrows), 25317 (black arrows) and 24759 (green arrows), daily resistance at 24934 and weekly resistance in the form of the 2018 yearly opening level at 24660.
Areas of consideration:
For those who read Thursday’s technical briefing you may recall the following piece (italics):
In view of the technical picture presented here, daily support at 23291 and the 2019 yearly opening level on the weekly timeframe at 23313 denote a potential buy zone today.
Well done to any readers who managed to jump on board the move from daily support at 23291.
Given the number of technical levels converging within 25317/24660, this will likely garner interest today if tested. Not only is the area an ideal take-profit zone for longs off daily support at 23291, the zone also offers a base for potential bearish scenarios.
XAU/USD (GOLD):
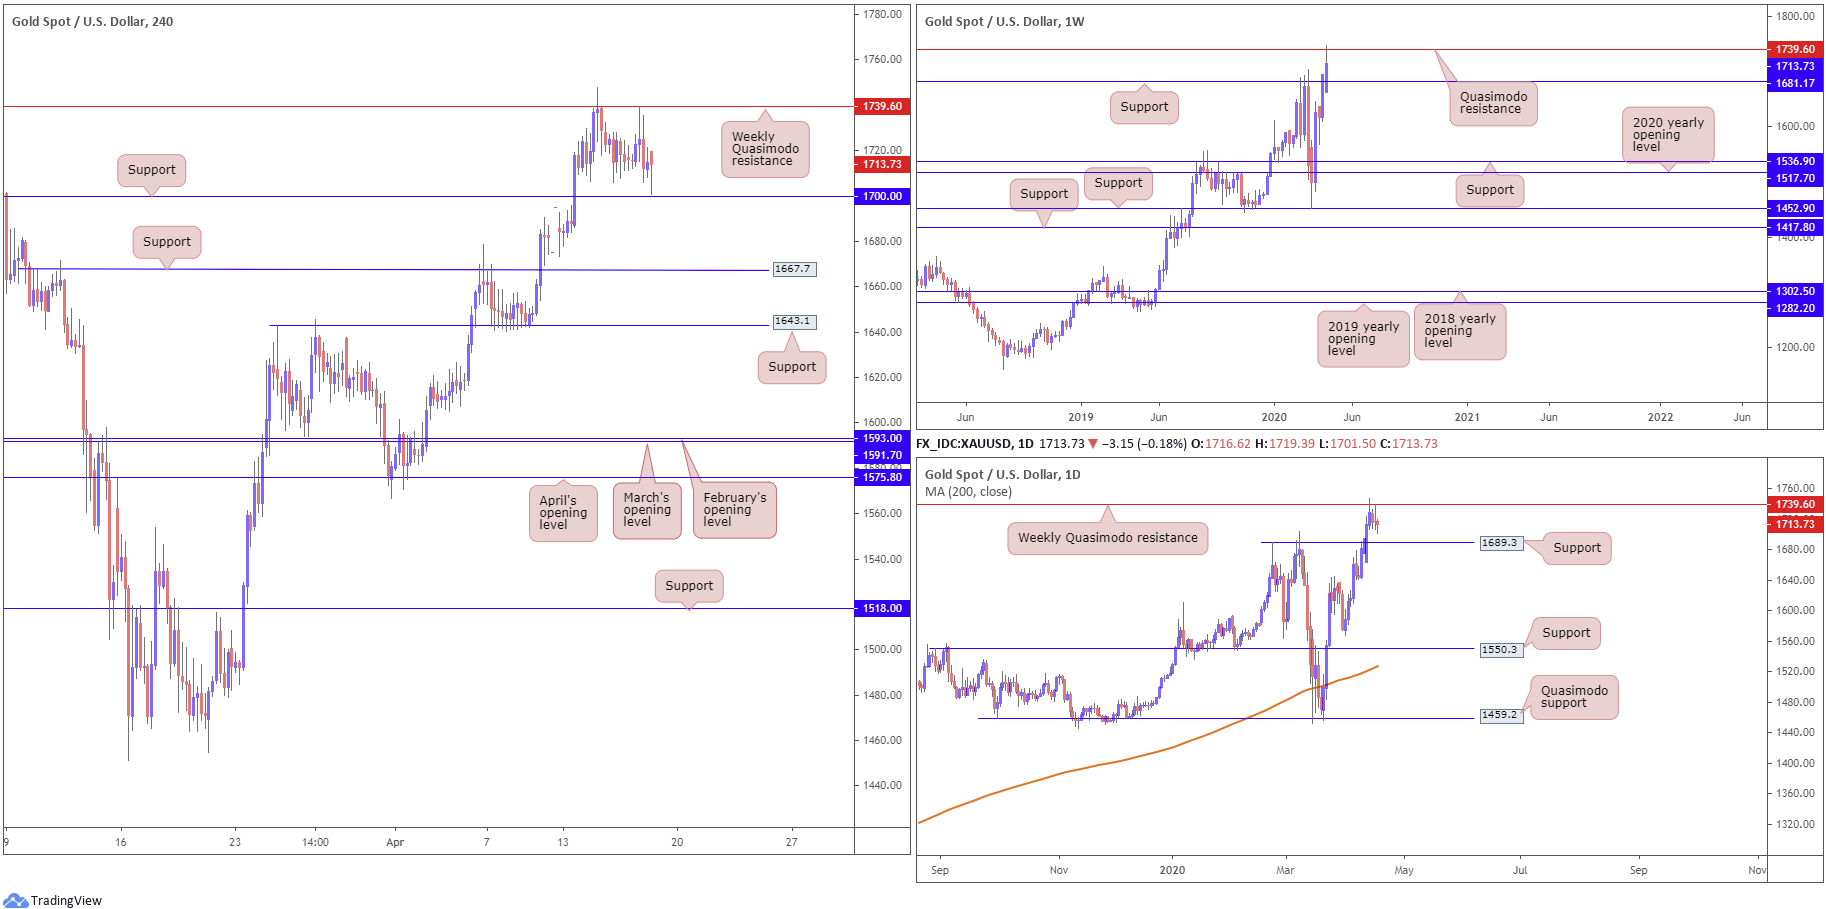
Although retesting weekly Quasimodo resistance at 1739.6 and, in recent hours, coming within touching distance of H4 support at 1700.0, bullion ended Thursday mostly unchanged vs. the buck. Activity beyond the noted support level could see the yellow metal knocking on the door of 1667.7 and 1643.1, both viable support levels.
Upside attempts on the weekly timeframe are limited for now by a Quasimodo resistance at 1739.6, extended from late 2012. This follows a recent move through weekly resistance at 1681.1 (now a serving support).
The reaction from weekly Quasimodo resistance mentioned above at 1739.6, according to the technical landscape on the daily timeframe, could extend losses to support coming in at 1689.3, a prior Quasimodo resistance level.
Areas of consideration:
Having noted a weekly Quasimodo resistance recently entering the fold at 1739.6, buyers may be squeezed out of the market off H4 support at 1700.0.
A whipsaw through 1700.0 could eventually take shape, with price action seeking buy orders from daily support at 1689.3 or, with a little oomph, from weekly support at 1681.1. This not only draws in higher-timeframe buyers, it taps into sell-stop liquidity beneath 1700.0. Therefore, should the higher-timeframe levels come into play and H4 price closes back above 1700.0, this may unlock the door for bullish themes.
The accuracy, completeness and timeliness of the information contained on this site cannot be guaranteed. IC Markets does not warranty, guarantee or make any representations, or assume any liability regarding financial results based on the use of the information in the site.
News, views, opinions, recommendations and other information obtained from sources outside of www.icmarkets.com.au, used in this site are believed to be reliable, but we cannot guarantee their accuracy or completeness. All such information is subject to change at any time without notice. IC Markets assumes no responsibility for the content of any linked site.
The fact that such links may exist does not indicate approval or endorsement of any material contained on any linked site. IC Markets is not liable for any harm caused by the transmission, through accessing the services or information on this site, of a computer virus, or other computer code or programming device that might be used to access, delete, damage, disable, disrupt or otherwise impede in any manner, the operation of the site or of any user’s software, hardware, data or property.


