
Key risk events today:
US Core Retail Sales m/m and Retail Sales m/m; US Prelim UoM Consumer Sentiment.
(Previous analysis as well as outside sources – italics).
EUR/USD:
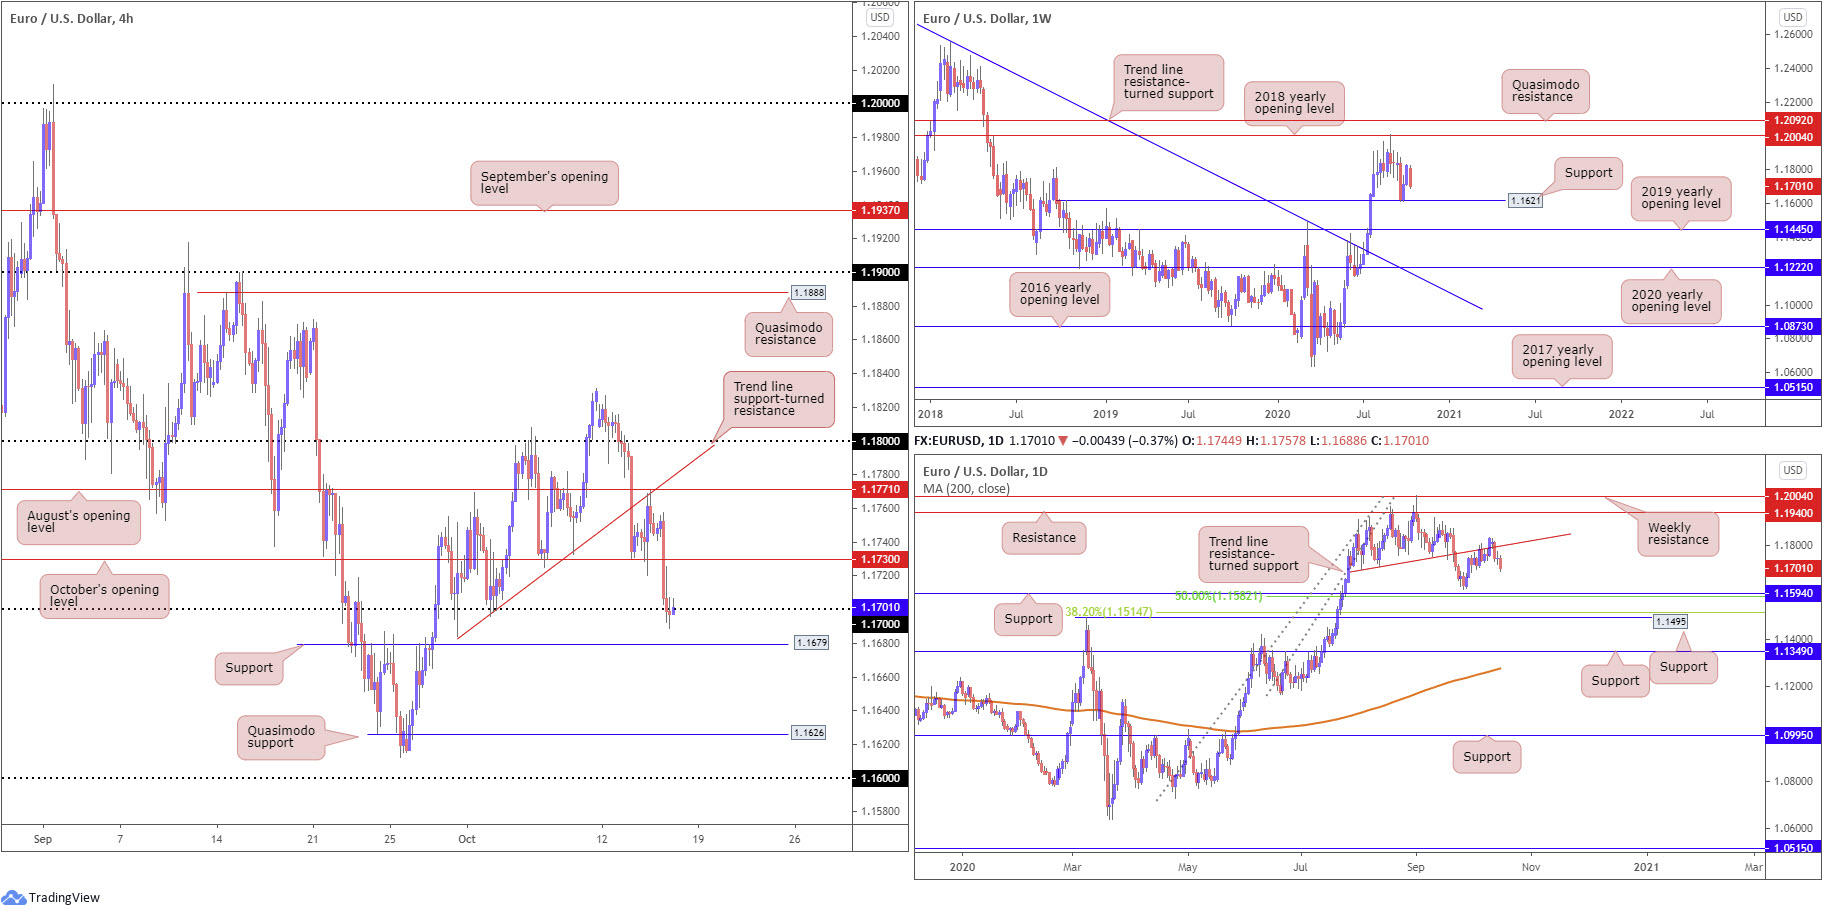
Downbeat risk sentiment bolstered demand for the US dollar Thursday, consequently leading EUR/USD sharply lower. Following a H4 retest at August’s opening value from 1.1771 (and converging trend line support-turned resistance, taken from the low 1.1684), October’s opening value at 1.1730 succumbed to downside pressure and permitted a 1.17 test. The round number, albeit modestly holding during afternoon trading in the US, echoes a fragile tone and shines the spotlight on nearby support at 1.1679.
Higher up on the curve, daily sellers hold trend line support-turned resistance, etched from the low 1.1695. Moves to the downside offer support at 1.1594 (and a 50.0% retracement ratio at 1.1582), whereas resistance at 1.1940 could eventually make an appearance should buying emerge.
The view from the weekly timeframe, however, shows longer-term flow hovers north of minor support from 1.1621, set above the 2019 yearly opening value at 1.1445. Despite the lack of commitment from buyers right now, the 2018 yearly opening value at 1.2004 represents valid resistance.
Areas of consideration:
For those who followed recent analysis on EUR/USD may recall the following (italics):
As evident from the H4 chart, a reaction from the 1.1771 zone has been seen. Should the bearish response lure additional selling, engulfing 1.1730 could be on the horizon.
Those short 1.1771 likely ended Thursday in a good place.
Going forward:
- A fakeout through 1.17 to H4 support at 1.1679 could be worth monitoring today. A H4 close back above 1.17 (off 1.1679) may be enough to generate an intraday bullish push back to at least 1.1730.
- A H4 close under 1.1679, as the daily timeframe suggests, however, puts forward a bearish theme to H4 Quasimodo support from 1.1626.
GBP/USD:
Thursday witnessed another cascade of Brexit headlines develop, consequently bullying GBP/USD to lower levels on Thursday and erasing Wednesday’s gains.
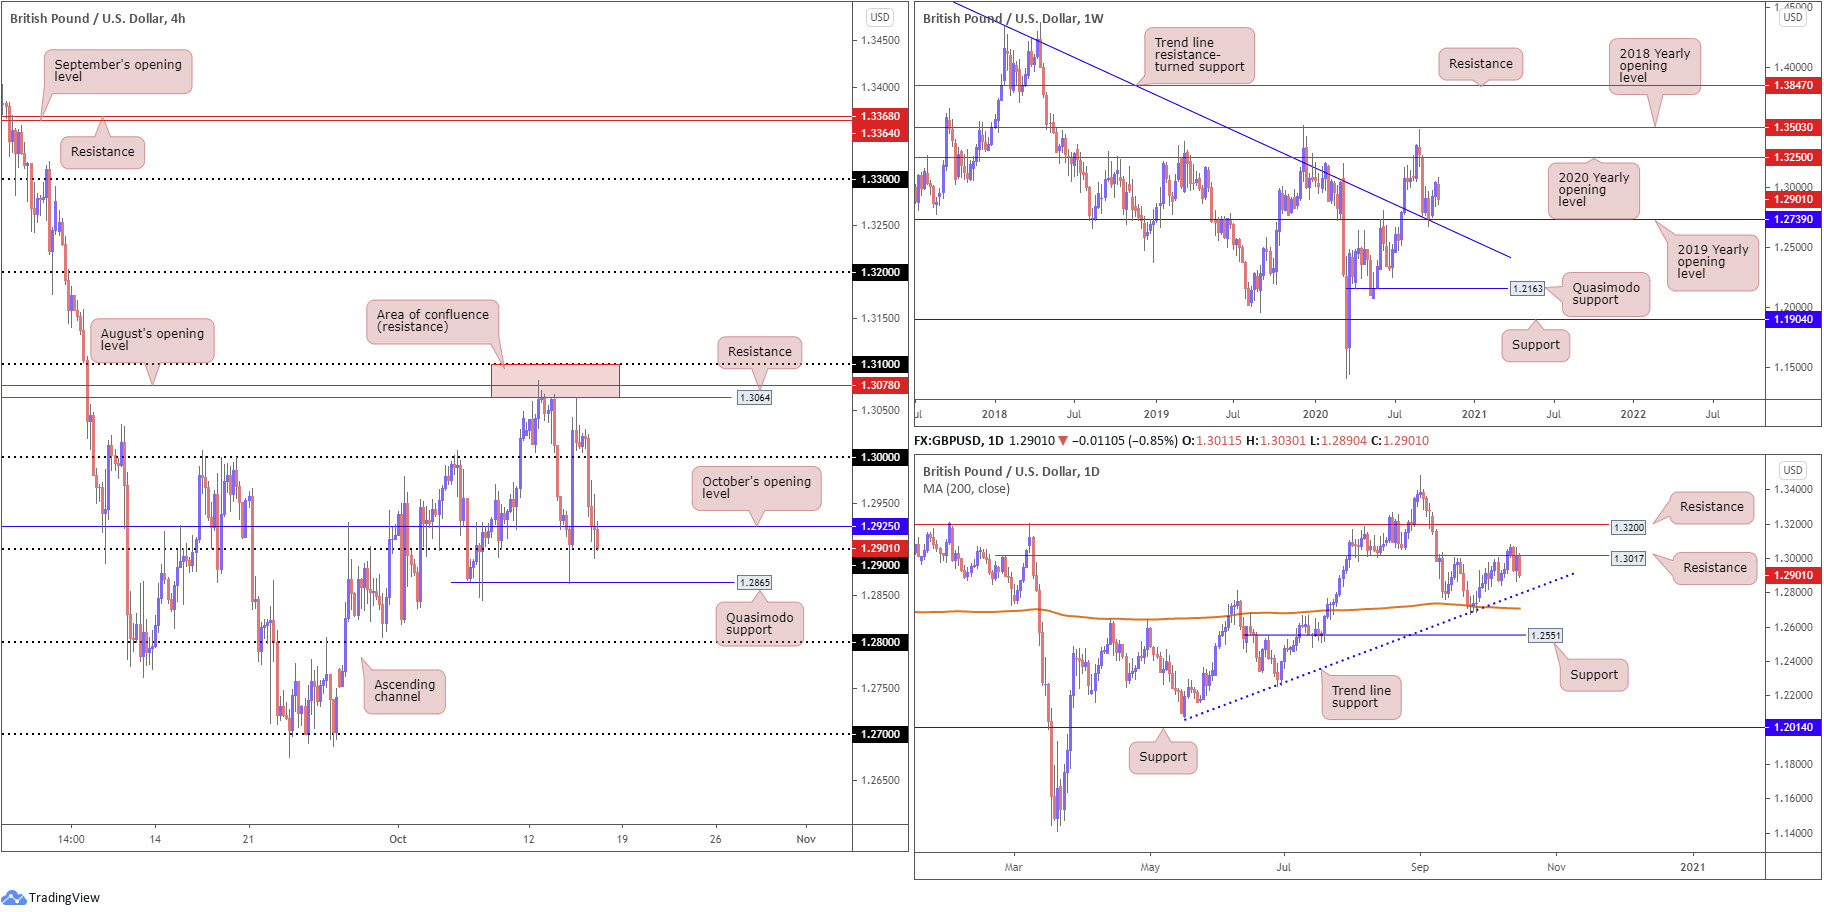
The 1.31/1.3064 resistance zone on the H4 timeframe (red) once again served sellers well, composed of the 1.31 handle, resistance from 1.3064 and August’s opening value at 1.3078. The key figure 1.30 surrendered ground, as did October’s opening value at 1.2925, to challenge 1.29 (located above Quasimodo support at 1.2865). Beyond here, 1.28 offers a reasonable target.
Aiding the H4 resistance zone is a daily resistance level coming in at 1.3017, with downside on the daily timeframe pointing to trend line support, extended from the low 1.2075.
Meanwhile, on the weekly timeframe, last week observed GBP/USD extend recent recovery gains from support at 1.2739 (a 2019 yearly opening value). Technicians will acknowledge 1.2739 blends with trend line resistance-turned support, extended from the high 1.5930. In terms of resistance, price has room to advance as far north as the 2020 yearly opening value at 1.3250.
Areas of consideration:
Taking into consideration both weekly and daily timeframes show room to move lower (weekly could revisit support at 1.2739), breaking 1.29 and 1.2865 to the downside on the H4 could be in the offing, ultimately sparking a bearish theme to 1.28. Traders may also want to acknowledge the aforementioned round number coincides with daily trend line support.
AUD/USD:
Thursday saw AUD/USD suffer at the hands of not only dovish guidance from RBA Governor Lowe, the pair was also weighed on the back of downbeat risk sentiment.
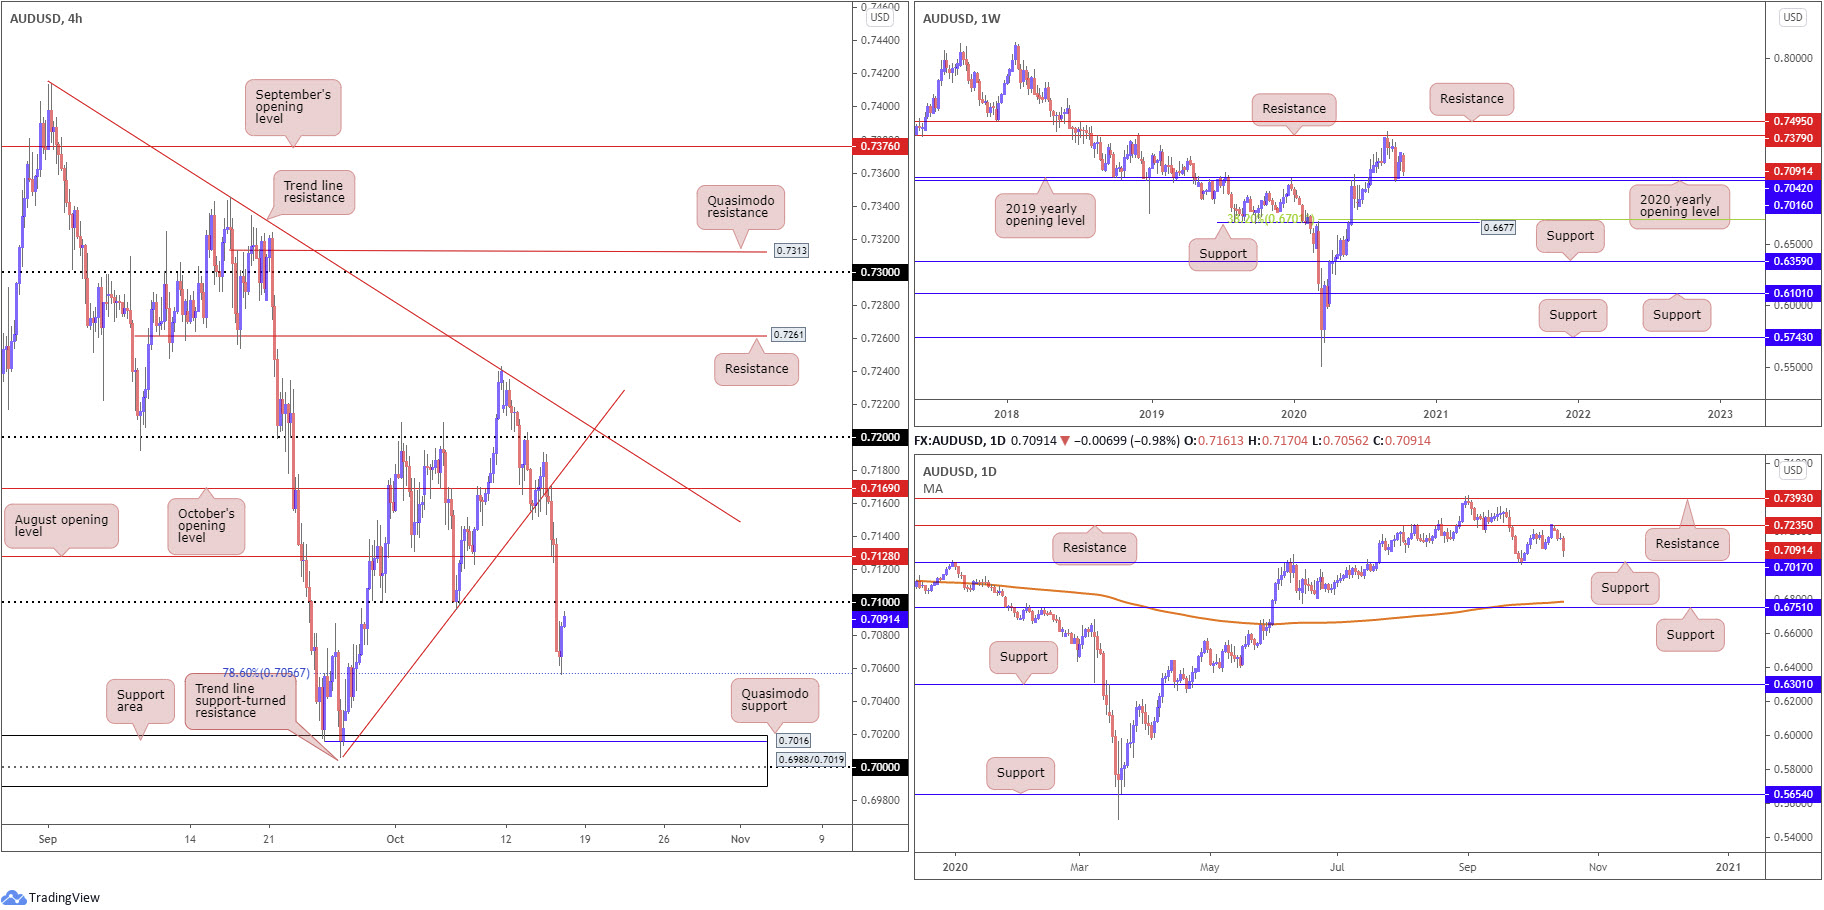
After tunnelling through a number of key supports on the H4 timeframe, the 78.6% Fibonacci retracement ratio at 0.7056 offered some much-needed respite. Current action is now poised to retest the underside of the 0.71 handle. Further downside positions a support area at 0.6988/0.7019 in the mix, which holds the key figure 0.70 within and also a Quasimodo support level at 0.7016.
The bearish tone remains in play below resistance at 0.7235 on the daily timeframe, now taking aim at support from 0.7017. Elsewhere, the weekly timeframe reveals price action to be hovering above the 2020 (0.7016) and 2019 (0.7042) yearly opening values.
Areas of consideration:
With weekly price showing room to trade lower until reaching at least 0.7042, and daily flow eyeing support at 0.7017, retesting 0.71 as resistance on the H1 timeframe today could have sellers make an appearance. However, although the above could encourage bearish scenarios, do bear in mind the trend in this market has been trekking northbound since early this year.
USD/JPY:
Leaving the 105 handle unchallenged on the H4 timeframe, USD/JPY gained on Thursday amid increased safe-haven USD demand as global equities plunged.
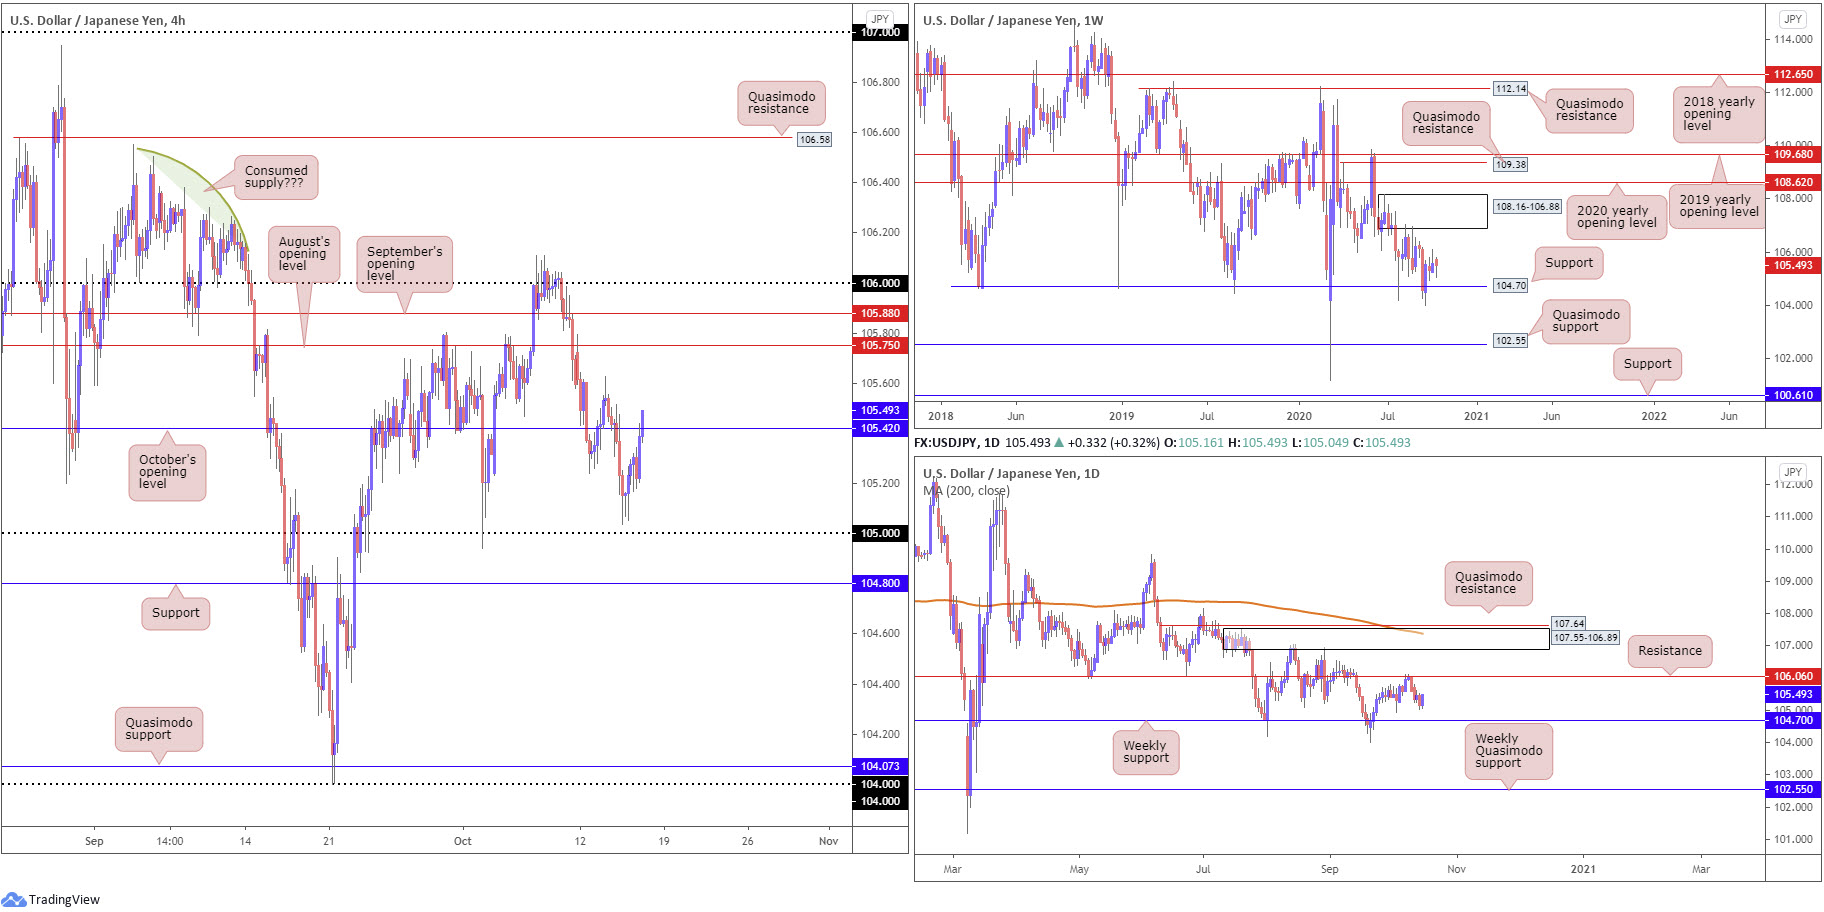
Technically, H4 recently glanced above October’s opening value at 105.42. Should follow-through buying unfold here, further upside towards August and September’s opening values at 105.75 and 105.88, respectively, could be on the cards.
Support at 104.70 remains a watched level on the weekly and daily timeframes, particularly after recently welcoming a 1% rebound.
Supply at 108.16-106.88 also remains prominent from the weekly chart, capping upside since early August. Weekly Quasimodo support at 102.55 offers a feasible target beyond current support in the event we turn south, while removing supply draws the 2020 yearly opening value at 108.62 into the fight.
Daily price, on the other hand, is caught between resistance at 106.06 (a level mostly ignored since serving as support during May and June) and the aforementioned weekly support level.
Areas of consideration:
A decisive H4 close above 105.42 today highlights 105.88/75 as potential upside targets (followed by the 106 handle which also represents daily resistance at 106.06). Conservative buyers, however, may seek a 105.42 retest as support (preferably in the shape of a H4 bullish candlestick formation) before committing to a bullish theme.
USD/CAD:
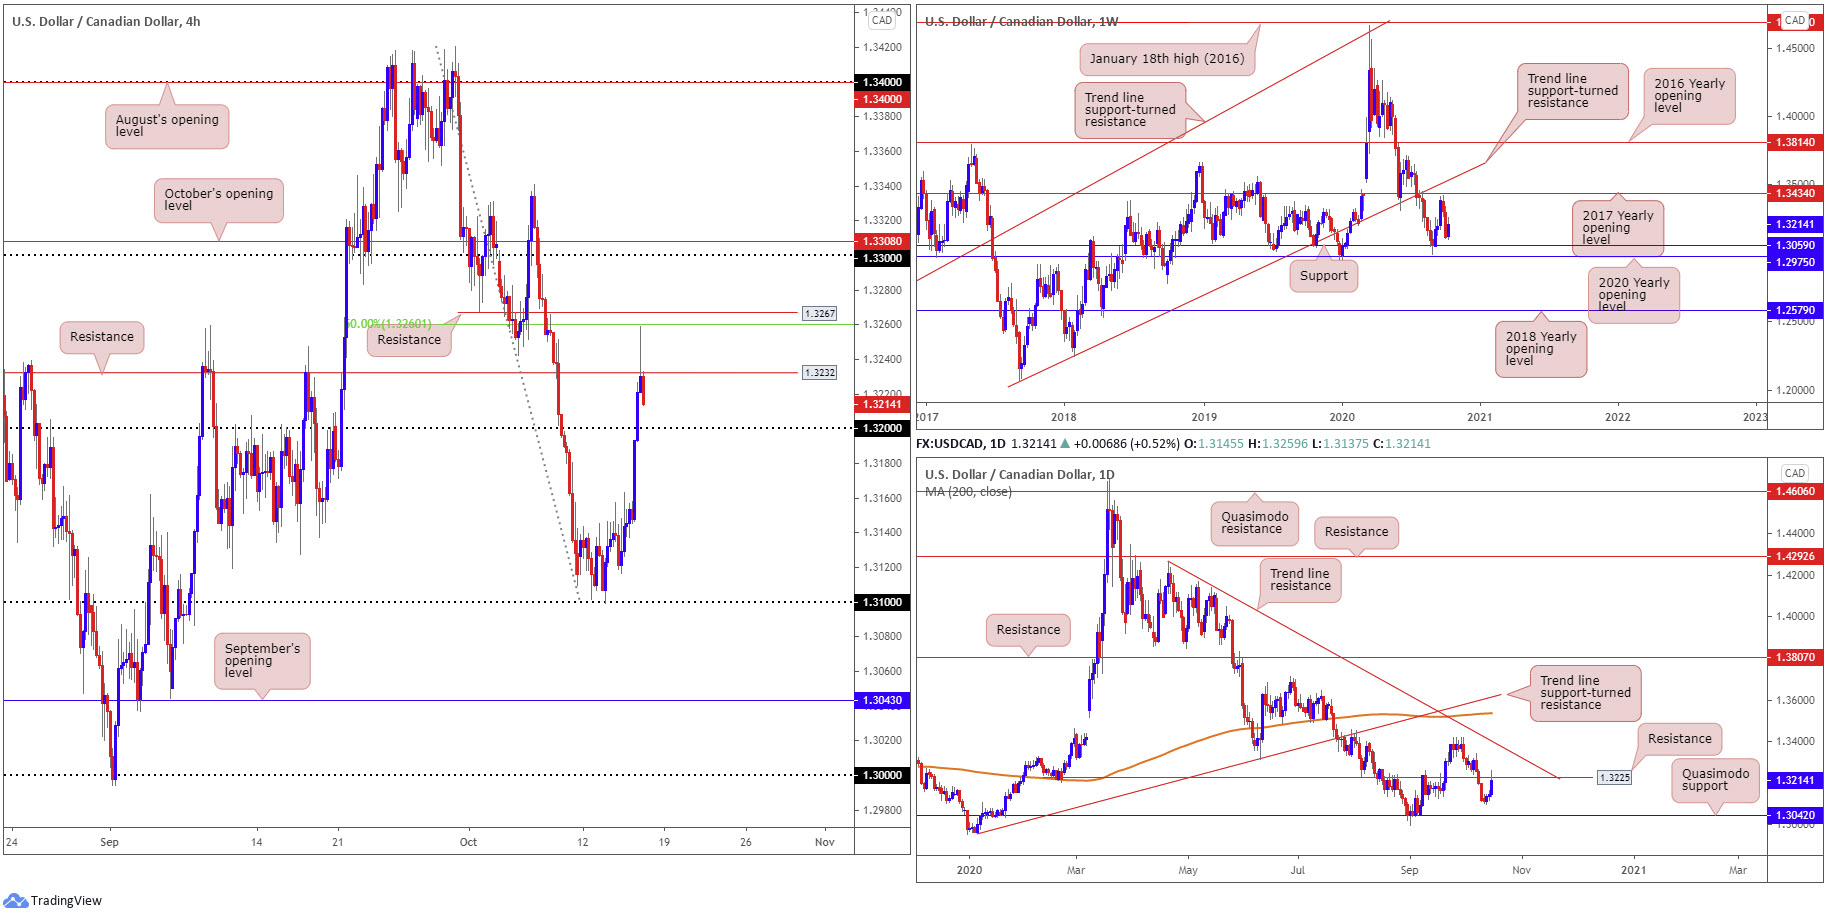
Weekly price discovered a floor ahead of support at 1.3059 in recent dealings (arranged above the 2020 yearly opening value at 1.2975), with continued upside to perhaps hone in on the 2017 yearly opening value at 1.3434. Resistance at 1.3225 on the daily timeframe, however, nudged its way into the spotlight yesterday, which for the time being is holding. Sustained buying here, nevertheless, could lead candle action to trend line resistance, taken from the high 1.4265.
H4, after shaking hands with the 1.31 handle earlier in the week, demolished 1.32 resistance on Thursday and charged into resistance at 1.3232 (missing the 50.0% retracement ratio at 1.3260 by a point, sited just south of another layer of resistance at 1.3267). Note that not only does the latter merge closely with daily resistance, price action on the H4 established a shooting star candlestick pattern (bearish signal).
Areas of consideration:
A H4 close south of 1.32 today, knowing we’re coming from daily resistance at 1.3225 (and H4 resistance at 1.3232), could motivate a bearish presence to target 1.31. Should 1.32 prove stubborn, nonetheless, H4 resistance at 1.3267 might make an appearance.
USD/CHF:
USD/CHF modestly rallied Thursday amidst broad USD strength. However, as you can see, gains were limited as risk aversion also underpinned the safe-haven Swiss franc.
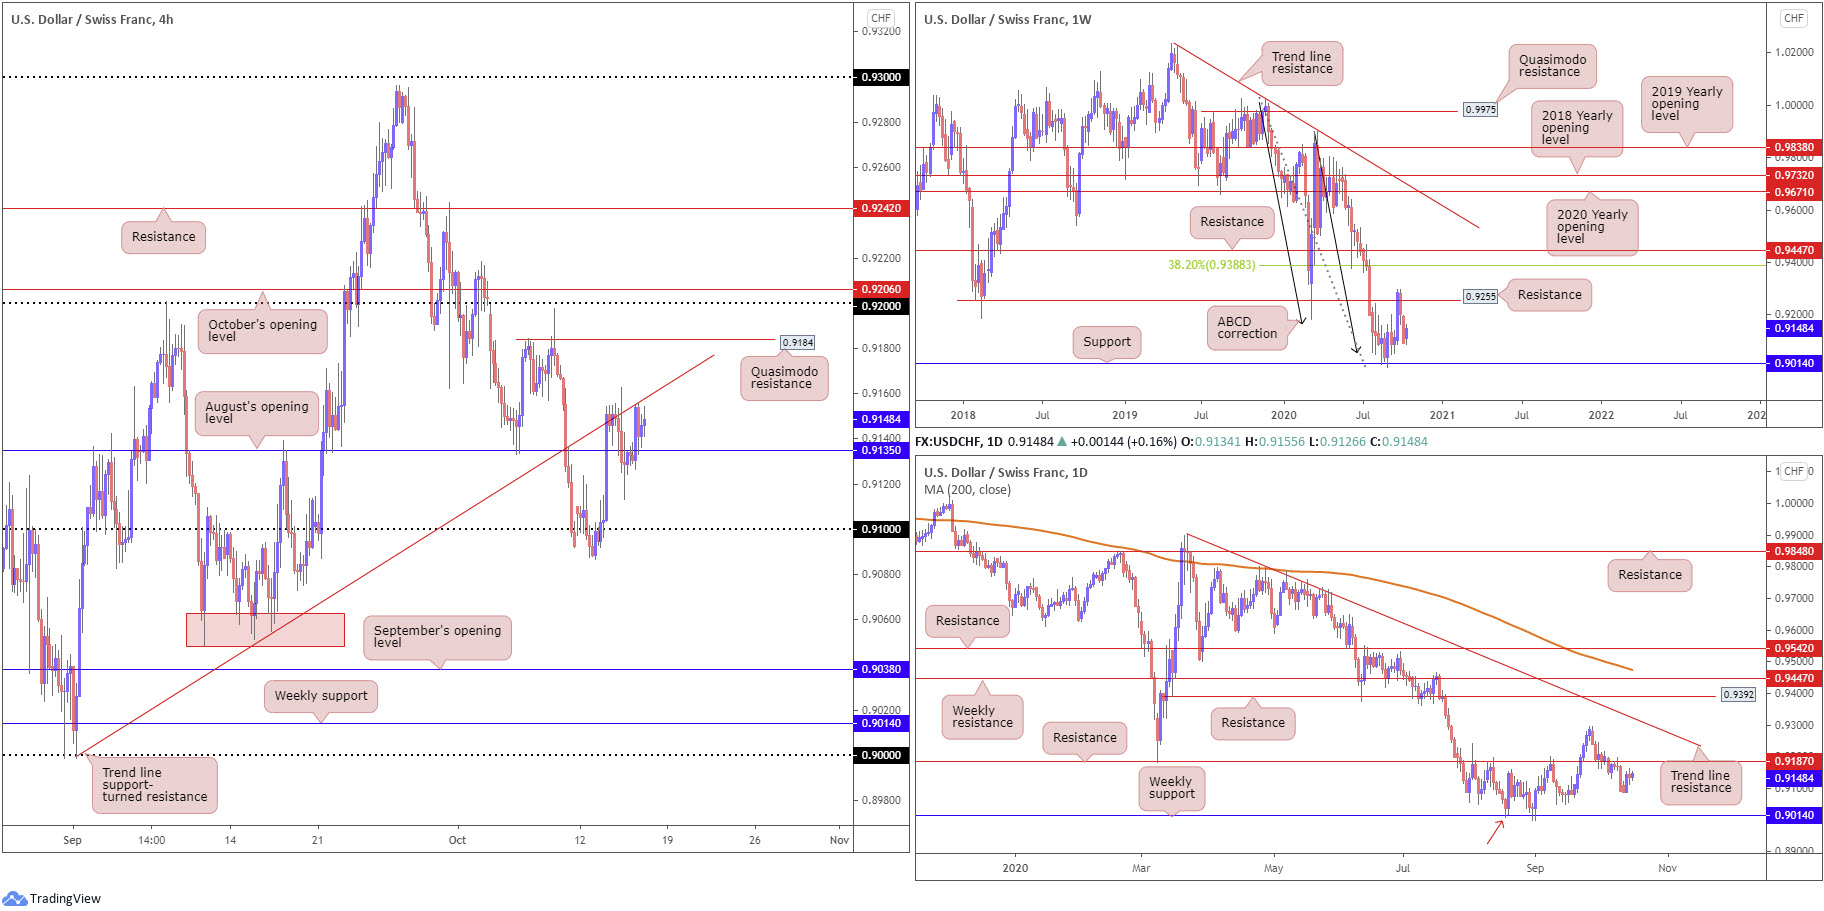
On the technical front, buyers and sellers are battling for position between trend line support-turned resistance, based on the H4 timeframe from the low 0.8998, and August’s opening value at 0.9135. To the upside, Quasimodo resistance at 0.9184 is in sight, followed by the 0.92 handle and October’s opening value at 0.9206, whereas space under 0.9135 shows room to target the 0.91 handle.
Further out on the weekly timeframe, the closing stages of September had price retest resistance at 0.9255 (a previous Quasimodo support level) which, during the first half of October, established two back-to-back near-full-bodied bearish candles. As a result, support at 0.9014, as well as ABCD support at 0.9051 (black arrows), is turf that may be retested. It is also worth noting USD/CHF has traded lower since topping in April 2019.
A closer reading of price action on the daily timeframe reveals the unit is stationed within striking distance of resistance from 0.9187. What’s also interesting is weekly support at 0.9014 on the daily chart represents a Quasimodo support (red arrow).
Areas of consideration:
October’s opening value at 0.9206 on the H4, the 0.92 handle and daily resistance at 0.9187, forms an area of resistance to be mindful of should we reach this far north.
H4 securing ground under 0.9135 today signals a possible move to 0.91, though conservative sellers will likely want to see a 0.9135 retest form before pulling the trigger.
Dow Jones Industrial Average:
US equities slipped Thursday as investors digested ongoing stimulus talks and a larger-than-anticipated weekly unemployment claims print. The Dow Jones Industrial Average fell 19.80 points, or 0.07%; the S&P 500 dipped 5.33 points, or 0.15% and the Nasdaq traded lower by 54.86 points, or 0.47%.
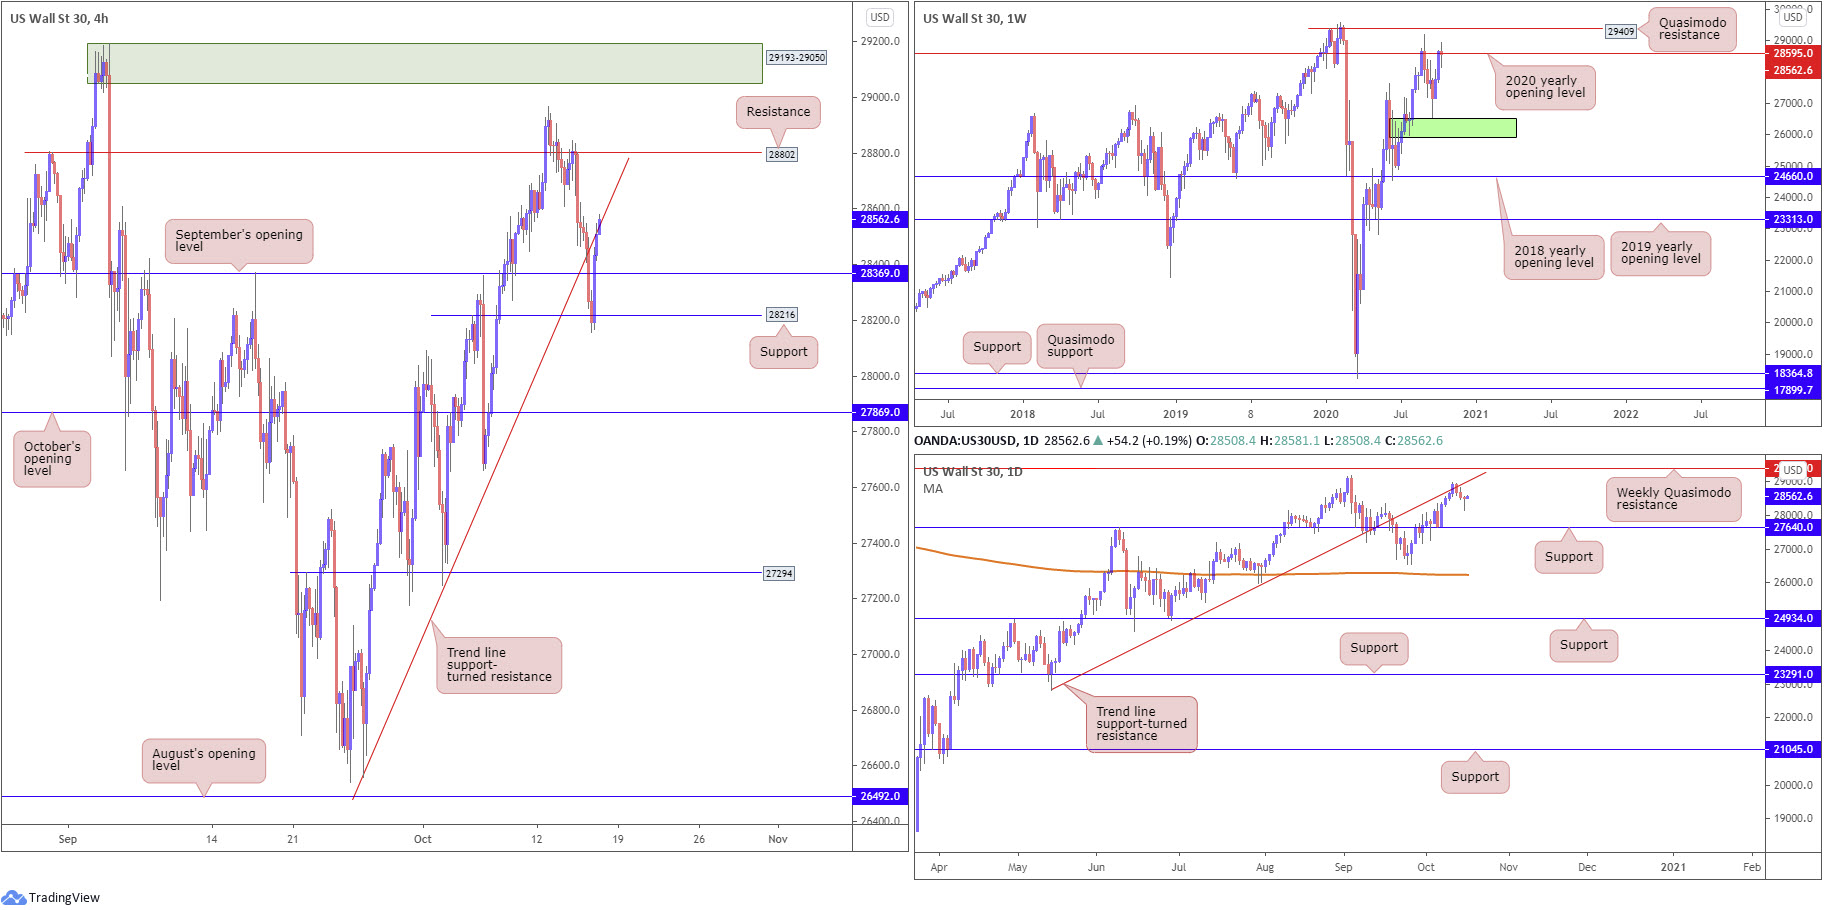
The DJIA fell sharply amid European hours yesterday, driving through H4 trend line support, extended from the low 26558, and September’s opening value at 28369. As you can see, however, support at 28216 (a prior Quasimodo resistance level) received the candles and encouraged a strong recovery with price retesting trend line support-turned resistance (26558).
Higher, we can see weekly price engaging with the 2020 yearly opening value at 28595, set a touch under Quasimodo resistance at 29409. Meanwhile, the daily timeframe shows the unit faded trend line support-turned resistance, extended from the low 22803, at the beginning of the week, though Thursday saw a hammer candlestick pattern emerge (bullish signal).
Areas of consideration:
Traders likely view the H4 testing trend line support-turned resistance as a low-probability setup, having seen daily price form a bullish candlestick pattern yesterday and weekly price yet to show much bearish intent around 28595. Therefore, a retest at September’s opening value from 28369 on the H4 could come about today, a move that may inspire a bullish theme.
XAU/USD (GOLD):
The yellow metal finished Thursday a shade higher against the buck, yet was unable to print anything substantial as downbeat market sentiment bolstered the US dollar.
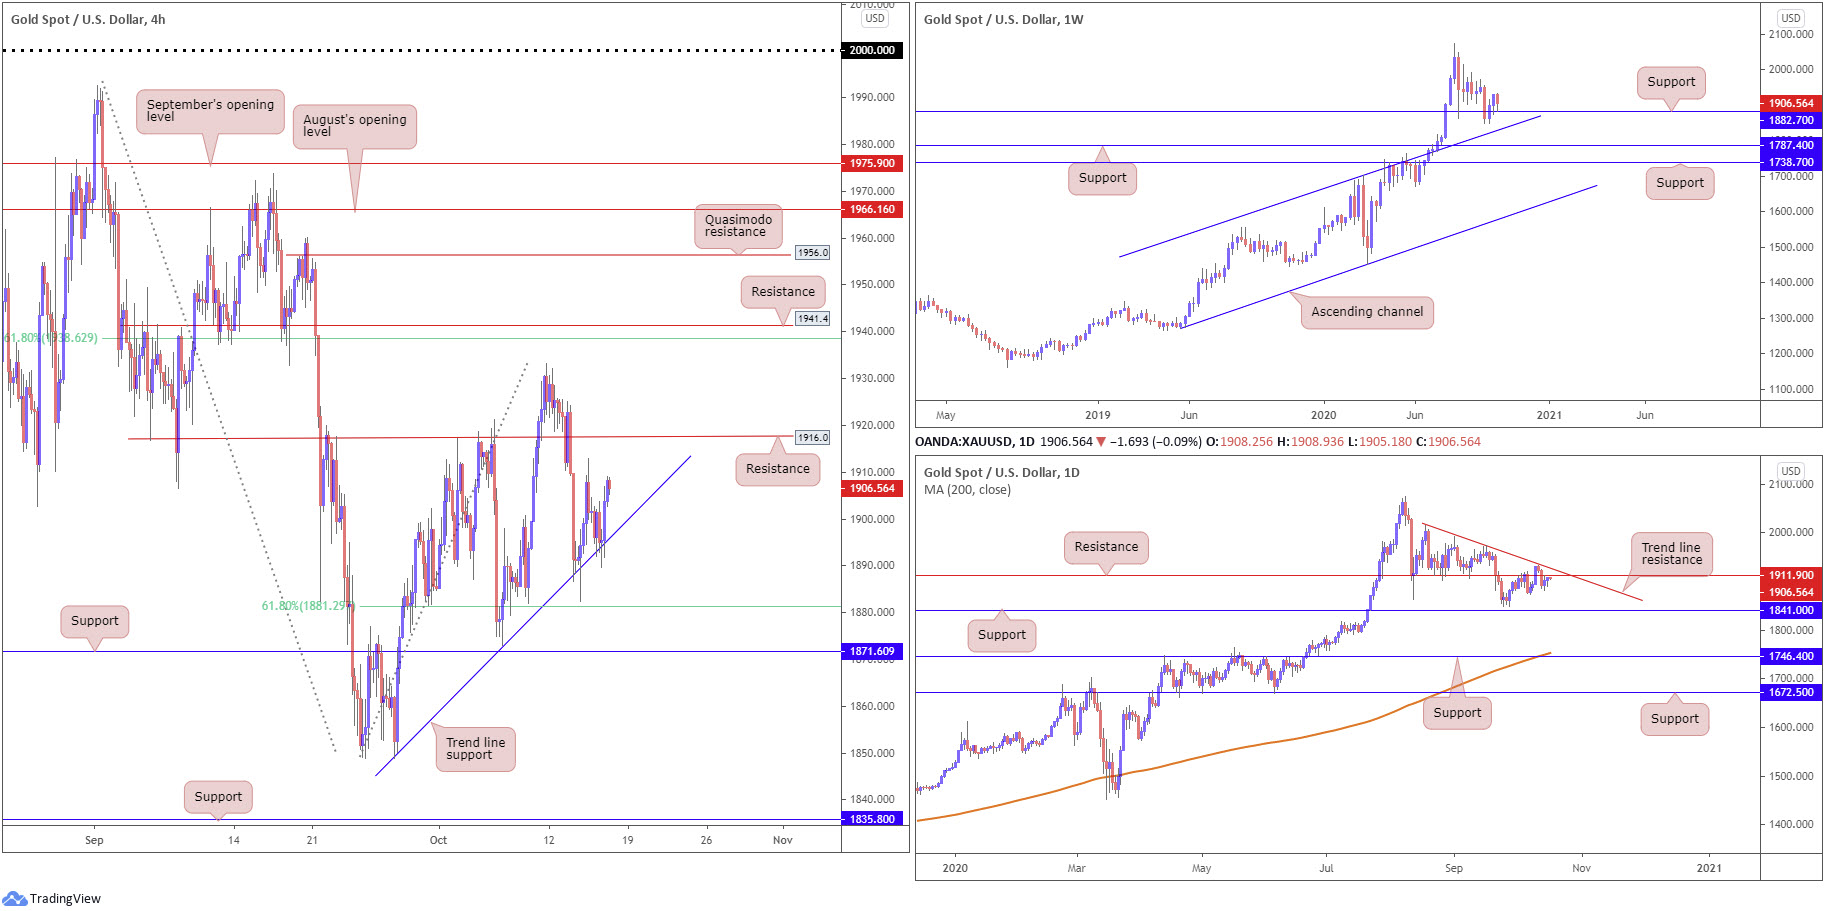
Technicians will acknowledge the H4 trend line formation, extended from the low $1,848, continues to forge support, bringing to light the possibility of H4 resistance at $1,916 entering the fold today. A break here also uncovers the $1,933 October 11 peak, followed by H4 resistance at $1,941 and a 61.8% Fibonacci retracement ratio at $1,938.
Interestingly, weekly price also exhibits scope to advance after addressing support at $1,882. On the other side of the field, however, we can still see daily price holding under resistance at $1,911, a level fusing closely with a trend line resistance, taken from the high $2,015. Additional selling from this region could take the precious metal as far south as support at $1,841.
Areas of consideration:
With the trend on gold higher since 2016, and the weekly timeframe demonstrating active support at $1,882, buyers still likely have a strong hand in this fight.
Traders may interpret chart structure as a cue to begin pursuing bullish themes off the current H4 trend line support, while conservative buyers might prefer to wait and see if the unit conquers H4 resistance at $1,916 before taking action.
The accuracy, completeness and timeliness of the information contained on this site cannot be guaranteed. IC Markets does not warranty, guarantee or make any representations, or assume any liability regarding financial results based on the use of the information in the site.
News, views, opinions, recommendations and other information obtained from sources outside of www.icmarkets.com.au, used in this site are believed to be reliable, but we cannot guarantee their accuracy or completeness. All such information is subject to change at any time without notice. IC Markets assumes no responsibility for the content of any linked site.
The fact that such links may exist does not indicate approval or endorsement of any material contained on any linked site. IC Markets is not liable for any harm caused by the transmission, through accessing the services or information on this site, of a computer virus, or other computer code or programming device that might be used to access, delete, damage, disable, disrupt or otherwise impede in any manner, the operation of the site or of any user’s software, hardware, data or property.


