
A note on lower timeframe confirming price action…
Waiting for lower timeframe confirmation is our main tool to confirm strength within higher timeframe zones, andhas really been the key to our trading success. It takes a little time to understand the subtle nuances, however, as each trade is never the same, but once you master the rhythm so to speak, you will be saved from countless unnecessary losing trades. The following is a list of what we look for:
- A break/retest of supply or demand dependent on which way you’re trading.
- A trendline break/retest.
- Buying/selling tails – essentially we look for a cluster of very obvious spikes off of lower timeframe support and resistance levels within the higher timeframe zone.
- Candlestick patterns. We tend to only stick with pin bars and engulfing bars as these have proven to be the most effective.
EUR/USD:
Going into yesterday’s London open, the EUR currency sold off six pips from below psychological resistance 1.1500. This, as can be seen on the 4hr chart, saw price touch gloves with the ignored Quasimodo level at 1.1440. It was around this point; however, positive U.S. data hit the docket, thus forcing price to break below not only 1.1440, but also psychological support 1.1400 as well.
At the time of writing, we can see that price is currently consolidating between the underside of 1.1400 and a swap demand base seen at 1.1366-1.1349. Alongside this, a difference of opinion is being seen on the higher timeframes at the moment. On the one hand, the weekly chart has painted a nice-looking selling wick deep within supply at 1.1532-1.1278, and on the other, daily action is now flirting with an ignored Quasimodo level drawn from 1.1372.
Given the points made above, here is what we have jotted down so far:
- We have no interest in trading between 1.1400/1.1366-1.1349.
- A break above 1.1400 will likely see price tackle supply at 1.1450-1.1424, which may provide a nice base in which to look for confirmed shorts from today.
- A push below the current swap demand area on the other hand, may open the floodgates for price to challenge psychological support 1.1300 (sitting only thirty pips above daily demand at 1.1211-1.1268). For us to be permitted to trade this potential breakout south, this pair would need to retest 1.1366-1.1349 as supply together with corresponding lower timeframe selling confirmation.
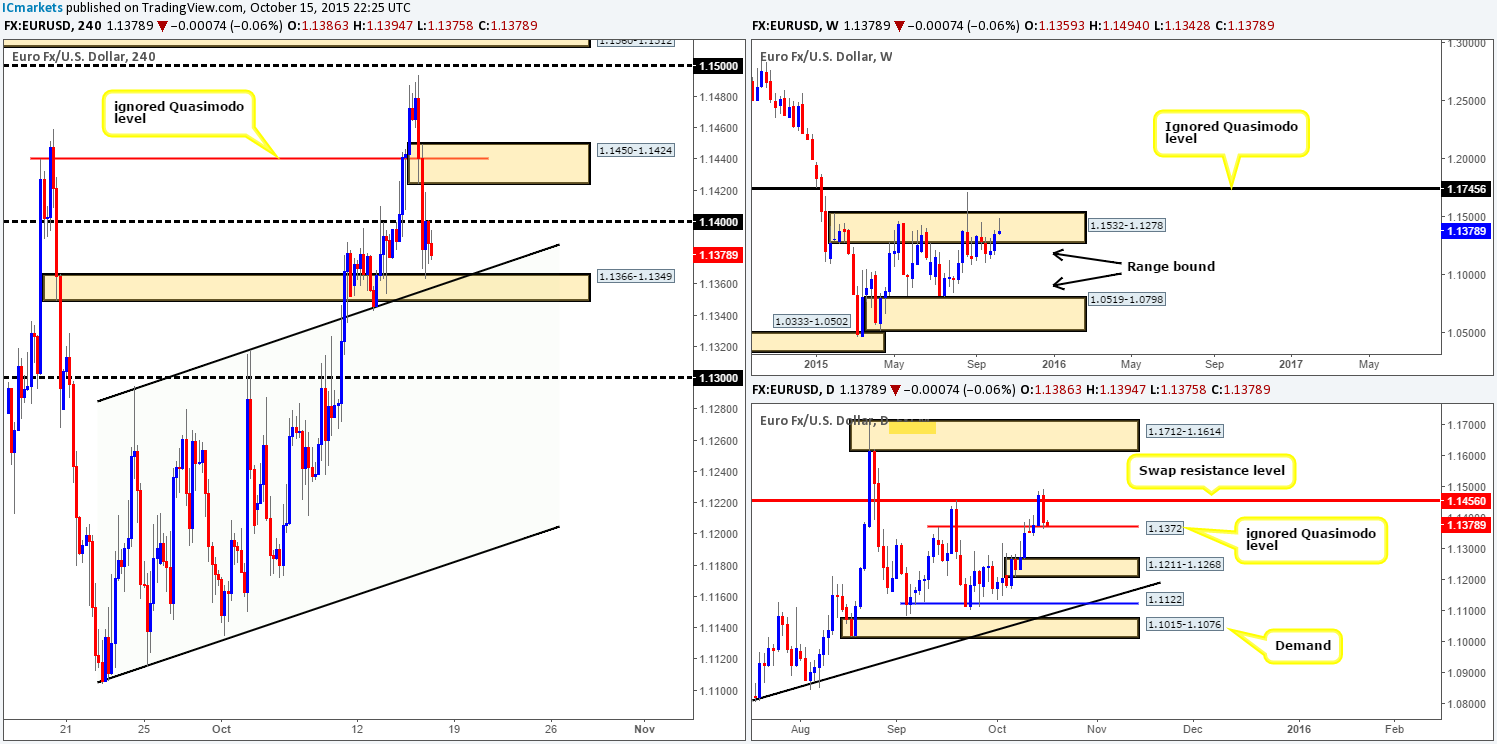
Levels to watch/live orders:
- Buys: Flat (Stop loss: N/A).
- Sells:1.1450-1.1424 [Tentative – confirmation required] (Stop loss: dependent on where one confirms this area) Watch for bids at 1.1366-1.1349 to be consumed and look to enter on any retest seen at this area (confirmation required).
GBP/USD:
For those who read our previous report on Cable (http://www.icmarkets.com/blog/thursday-15th-october-daily-technical-outlook-and-review/) you may recall that we placed a pending sell order at 1.5506. Around yesterday’s London close, this order was filled beautifully with no more than a two-pip drawdown. 50% of our position is now locked in with our stop set at breakeven, and we’re now eyeing psychological support 1.5400 to take further profits.
It was also noted in our earlier analysis that price is now firmly trading within the jaws of a weekly supply drawn from 1.5658-1.5425. By the same token, down on the daily chart, Cable continues to flirt with the underside of a swap resistance barrier given at 1.5484. Therefore, as there has been little change seen, our bias remains short for the time being.
However, should our breakeven stop be hit today, and price continues to advance higher, our team will then be watching to see if price connects with the Harmonic Bat completion point sitting around psychological resistance 1.5600. This, like the current area of supply at 1.5528-1.5510 and its converging structures, is another strong sell zone we are interested in trading, be it today, or next week.
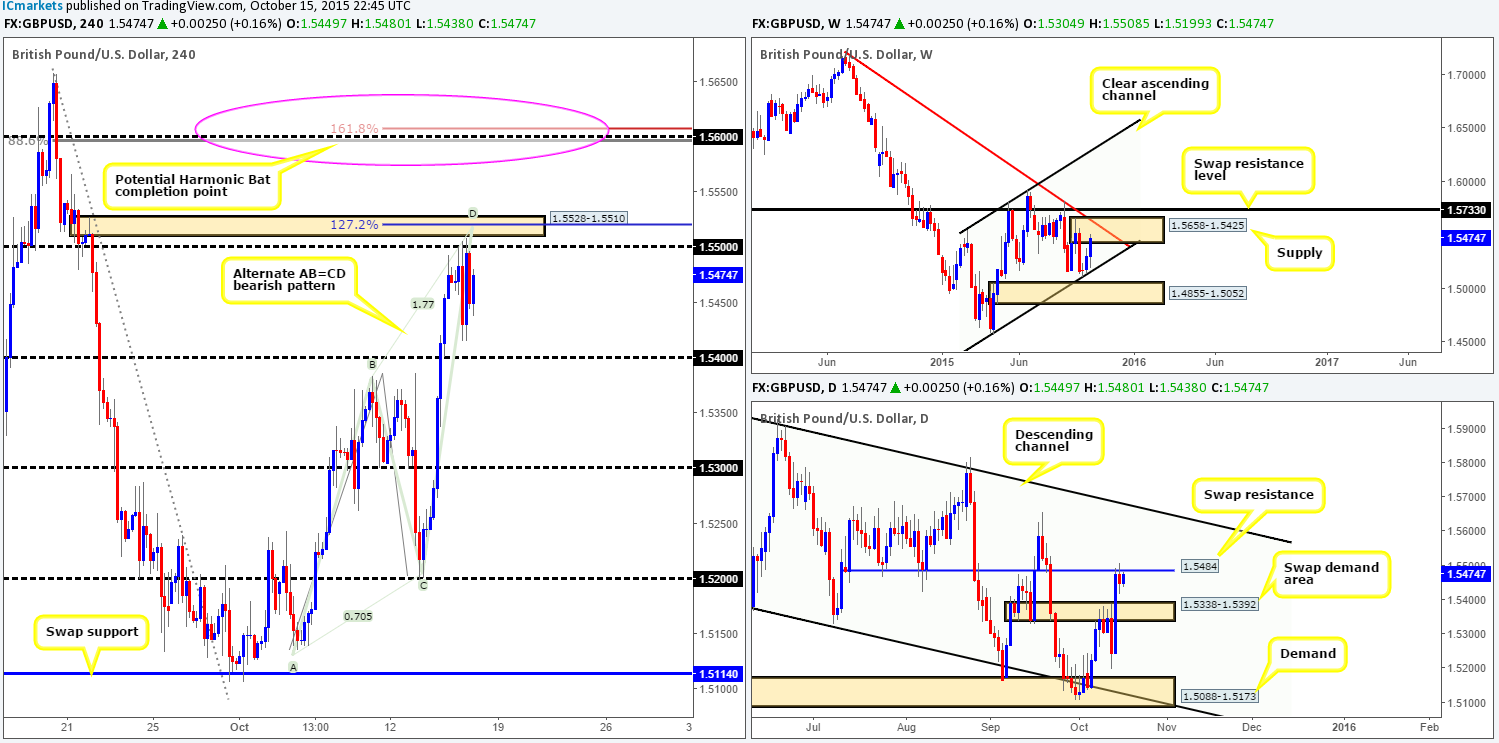
Levels to watch/ live orders:
- Buys: Flat (Stop loss: N/A).
- Sells: 1.5506 [LIVE] (Stop loss: Breakeven) 1.5600 [Tentative – confirmation required] (Stop loss: dependent on where one confirms this level).
AUD/USD:
The AUD/USD pair, as you can see, ran into a strong ceiling of offers at mid-level resistance 0.7350 going into early trade yesterday. This eventually dragged price lower, surpassing psychological support 0.7300 and driving into the jaws of demand at 0.7245-0.7273, which was clearly enough to support a rapid counter-attack back up to just below 0.7350.
Given the above, and the fact that this market is still entrenched in a severe downtrend dating back as far as 2011, where do we go from here? Well, seeing as both weekly and daily charts are currently trading around supplies right now (0.7438-0.7315/0.7371-0.7335), which also boasts a Harmonic Gartley sell zone positioned within the aforementioned daily supply, our technical bias still remains south on this pair. In all honesty, however, the only place we’d feel comfortable selling this market right now would be on a fake above 0.7350 into the 4hr stacked formation seen at 0.7408-0.7382/0.7382-0.7366. Despite this, our team has also pointed out that due to the somewhat lackluster response being seen at the above said weekly supply right now, we will only consider the 4hr stacked formation a tradable zone should lower timeframe confirmation be seen.
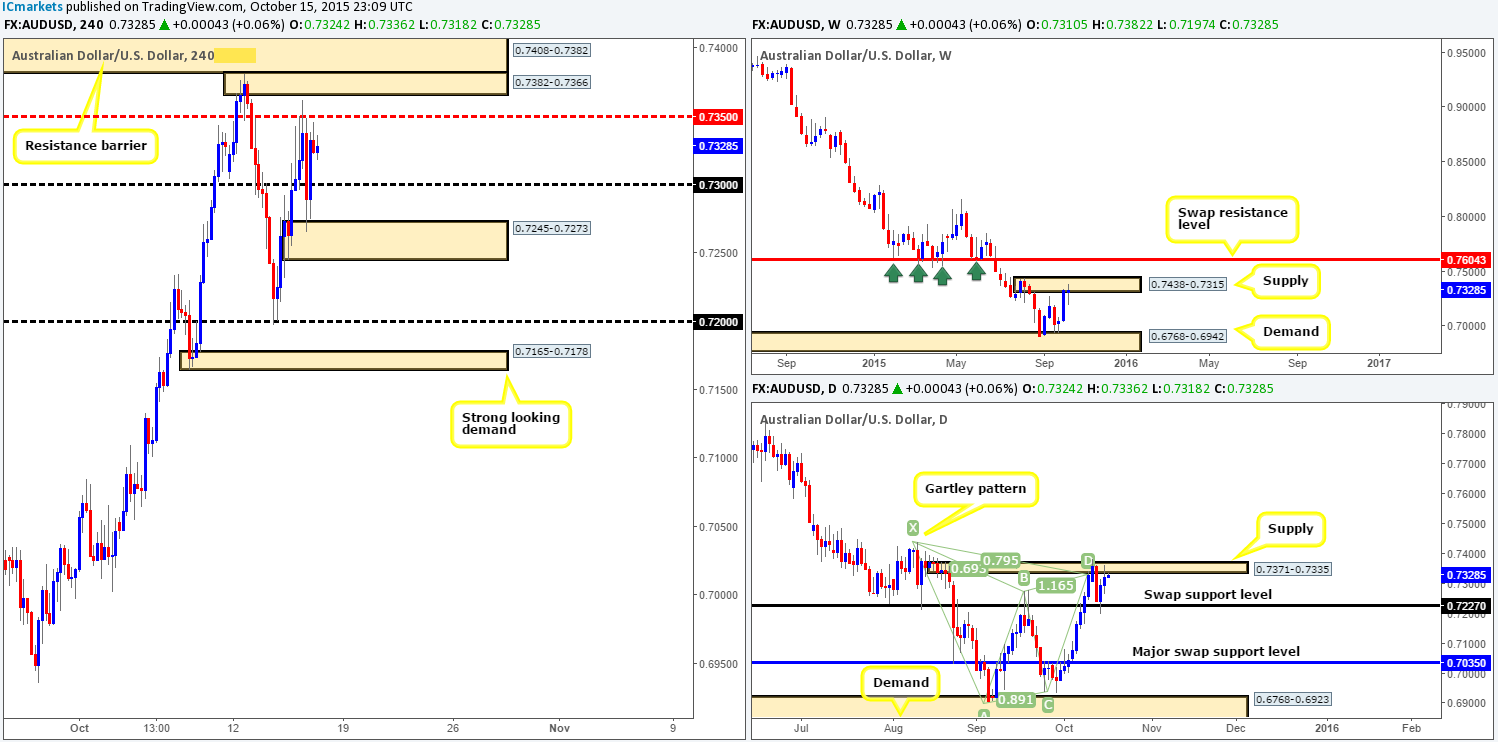
Levels to watch/ live orders:
- Buys:Flat (Stop loss: N/A).
- Sells:0.7408-0.7382/0.7382-0.7366 [Tentative – confirmation required] (Stop loss: dependent on where one finds confirmation within this area).
USD/CAD:
Starting from the top this morning, the weekly chart shows that the USD/CAD continues to drive lower following the retest of an ignored Quasimodo swap level at 1.3014. Assuming that the sellers remain in this dominant position, we see very little reason why this market will not connect with the ignored Quasimodo support sitting at 1.2797 sometime in the near future. Down on the daily chart, however, we can see that price has recently spiked below a Quasimodo barrier at 1.2859-1.2915, potentially clearing the path south for further downside towards demand at 1.2716-1.2804 (converges nicely with trendline support taken from the low 1.1918).
4hr action on the other hand, broke below Quasimodo support at 1.2910 amid trade yesterday, and aggressively drove into mid-level support 1.2850. Taking into consideration where price is currently trading on the higher timeframe picture (see above), we do not see 1.2850 holding for much longer.
Should our analysis be correct and price does indeed break lower, psychological support 1.2800 will likely be the next limit to reach. Now, considering that 1.2800 ties in with both the top-side of daily demand at 1.2716-1.2804 and the ignored weekly Quasimodo level at 1.2797, this is somewhere our team has expressed a great deal of interest in this morning as a base to enter long from.
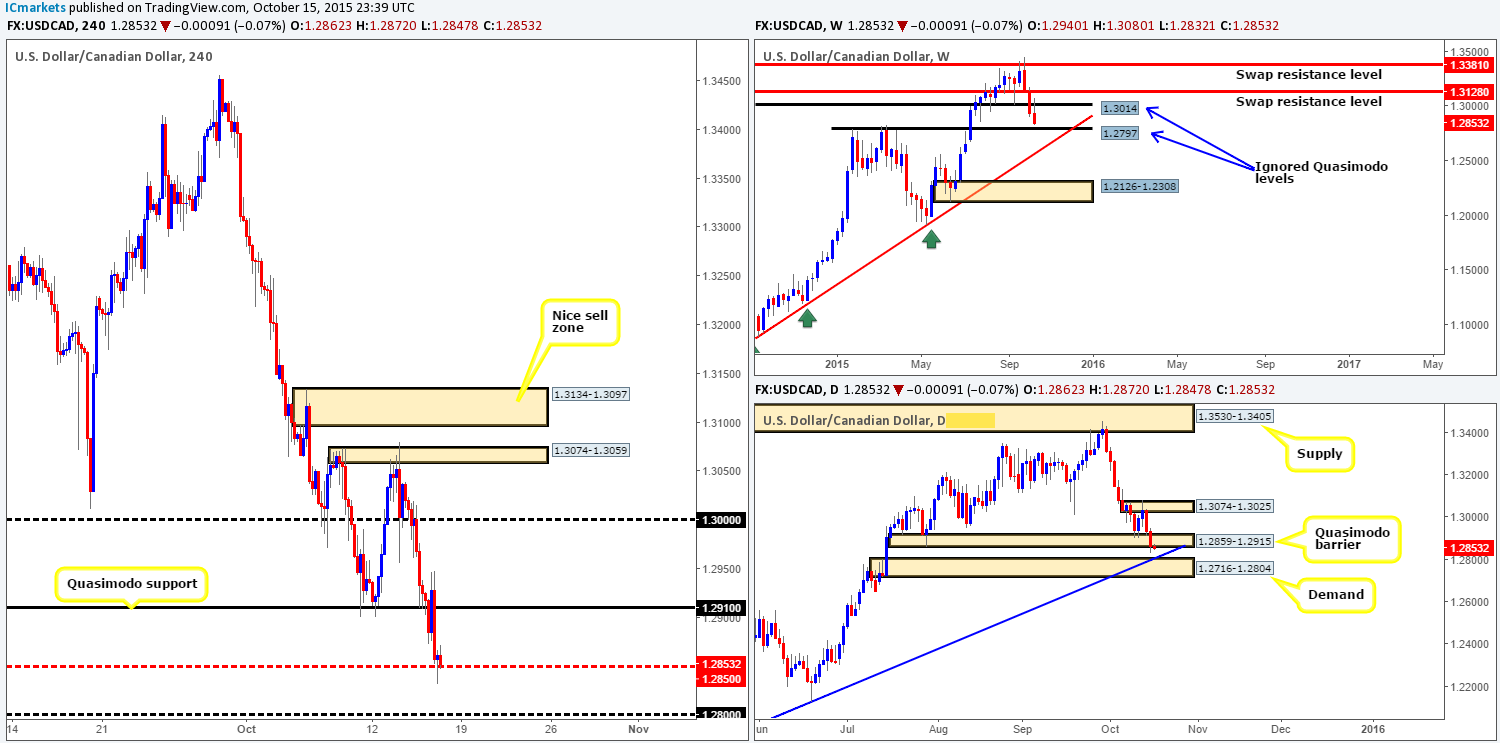
Levels to watch/ live orders:
- Buys: 1.2800 region [Tentative – confirmation required] (Stop loss: dependent on where one confirms this level).
- Sells: Flat (Stop loss: N/A).
USD/CHF:
Coming at you directly from the weekly timeframe this morning, we can see that price still sits firmly in the red this week from the recent rebound off the underside of a swap resistance level at 0.9796. Daily action also still remains loitering beneath a recently broken swap demand area at 0.9597-0.9502, consequently forming a nice-looking pin wick in the process. Should the sellers manage to continue holding this market lower, a trip down to the swap support level at 0.9397 is certainly not out of the question.
From the pits of the 4hr timeframe, nevertheless, price was holding nicely below psychological resistance 0.9500 yesterday until positive U.S. data hit the line. An aggressive push north was seen, smashing through 0.9500 and hitting mid-level resistance 0.9550. This surge higher, as you can see, was relatively short-lived, as price just as aggressively sold off from 0.9550 back down to the 0.9500 region by the days end.
Despite this recent spike higher, we feel this market is still heading lower in the near-term due to what we’re seeing on the higher timeframes at the moment (see above). As such, similar to yesterday’s report, we’re going to be watching for price to break below and retest 0.9500 as resistance and then look to enter short alongside lower timeframe confirming price action. In regards to targets, we see very little in the way of support until demand given at 0.9382-0.9407, which, as noted on the chart, ties in beautifully with the above said daily swap (support) level.
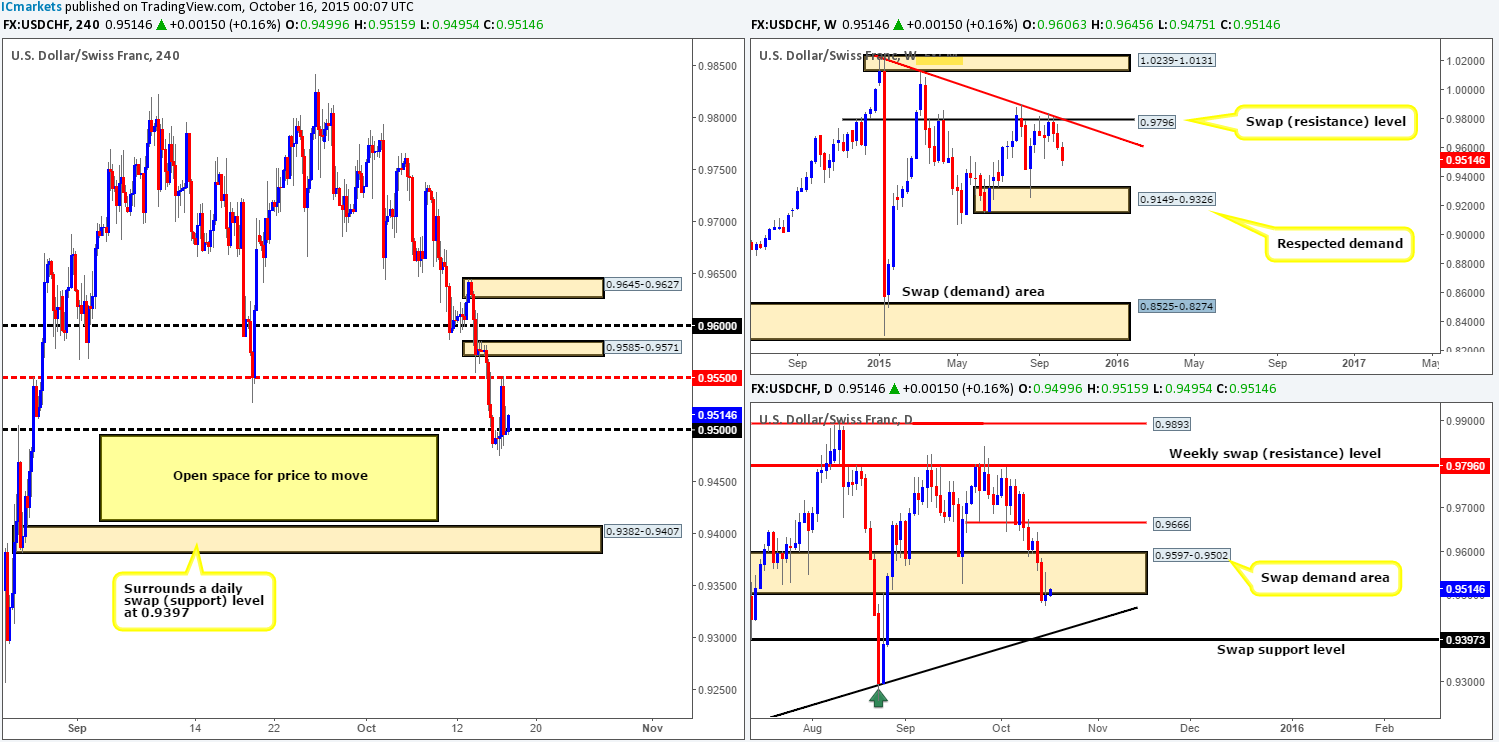
Levels to watch/ live orders:
- Buys: Flat (Stop loss: N/A).
- Sells: Watch for bids at 0.9500 to be consumed and look to enter on any retest seen at this level (confirmation required).
DOW 30:
How the tables have turned in one day’s trade! Right now, the weekly swap (resistance) level at 17135, which was holding firm as of yesterday’s report, appears to be struggling at the time of writing. The next upside target from here, in our opinion, falls in around supply coming in at 17628-17486. Rolling a page lower to the pits of the daily timeframe, market action has in actual fact closed above the aforementioned weekly swap resistance level. This could, everything else being equal, potentially encourage further buying in this market up to supply drawn from 17574-17475 (positioned just within the above said weekly supply zone).
Moving down to the 4hr timeframe, price is now lodged firmly within supply seen at 17237-17159. Therefore, we have no interest in buying this market right now until offers within this zone are consumed, no matter what the higher timeframes are suggesting at the moment. On the other side of the coin, we also have no interest in selling from this supply due to where this market is trading on the higher timeframe picture (see above). With that, our team’s position will remain flat going into today’s sessions.
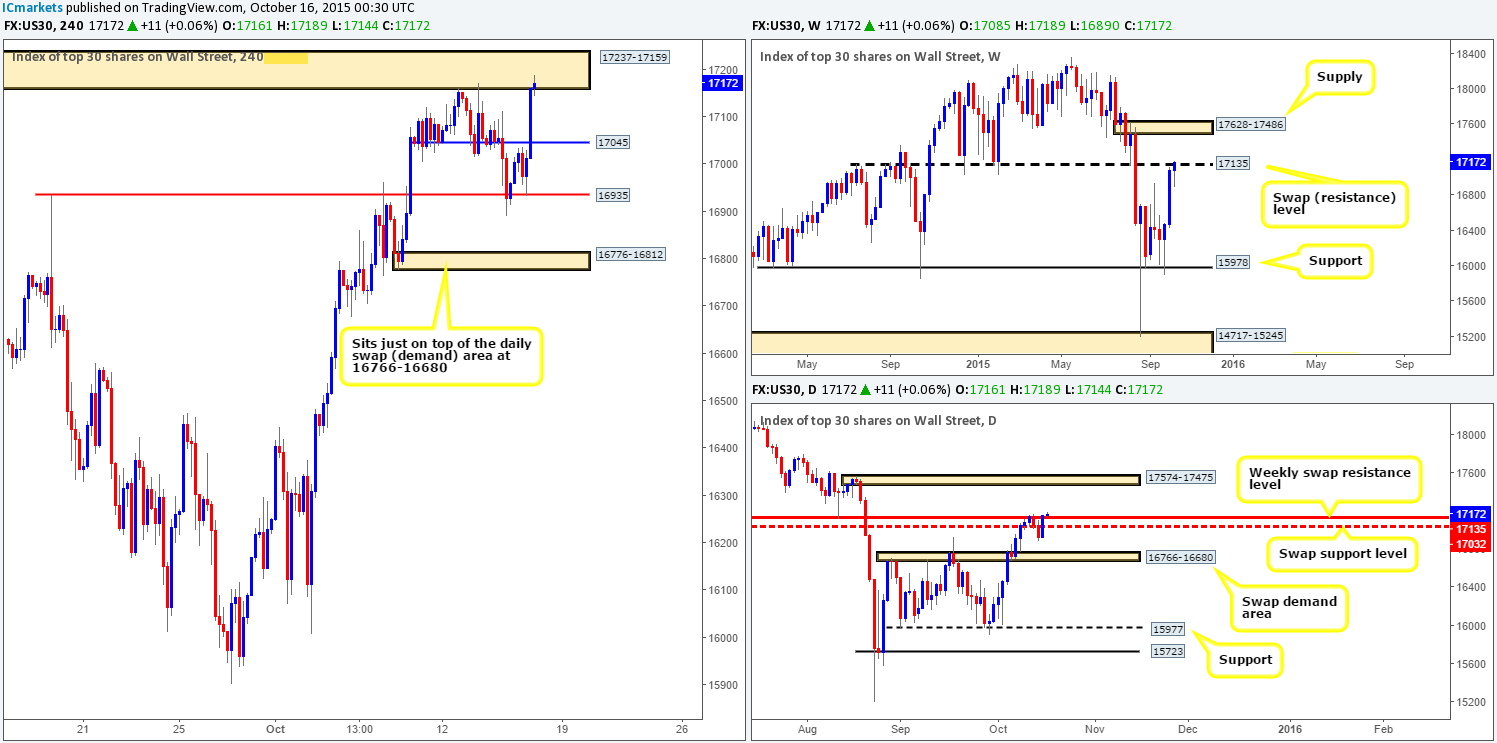
Levels to watch/ live orders:
- Buys: Flat (Stop loss: N/A).
- Sells:Flat (Stop loss: N/A).
XAU/USD: (Gold)
For anyone who read our previous report on our favorite yellow metal (http://www.icmarkets.com/blog/thursday-15th-october-daily-technical-outlook-and-review/), you may recall us highlighting to watch for a lower timeframe sell setup below the 4hr swap (resistance) level at 1187.5. As we can all see, price did in fact sell-off from here and as a result connected beautifully with our first take-profit target – the swap support level at 1174.4. Well done to any of our readers who managed to lock in some green pips from this move!
Now, considering that higher timeframe structures still exhibits overall supply in this market (weekly: 1205.6-1181.2 daily: 1187.6-1179.6) our bias for Gold still remains southbound. With that, here is what we have logged so far:
- Should price attack 1187.5 once again today, our team will be watching the lower timeframes like a hawk for a suitable setup to short this market. Like yesterday’s analysis, take-profit areas from here fall in at the swap support level at 1174.4, followed closely by the swap demand base at 1162.5-1169.8.
- In the event that 1187.5 gives way, however, we’d then be looking for price to rally up to 4hr supply coming in at 1205.6-1200.4 for a possible short trade. This area has absolutely stunning confluence from both the weekly and daily timeframes. It not only converges with the tip of a weekly bearish Harmonic AB=CD pattern (1199.4), but also sits deep within both the current weekly supply at 1205.6-1181.2 and daily supply seen at 1205.6- 1198.3.
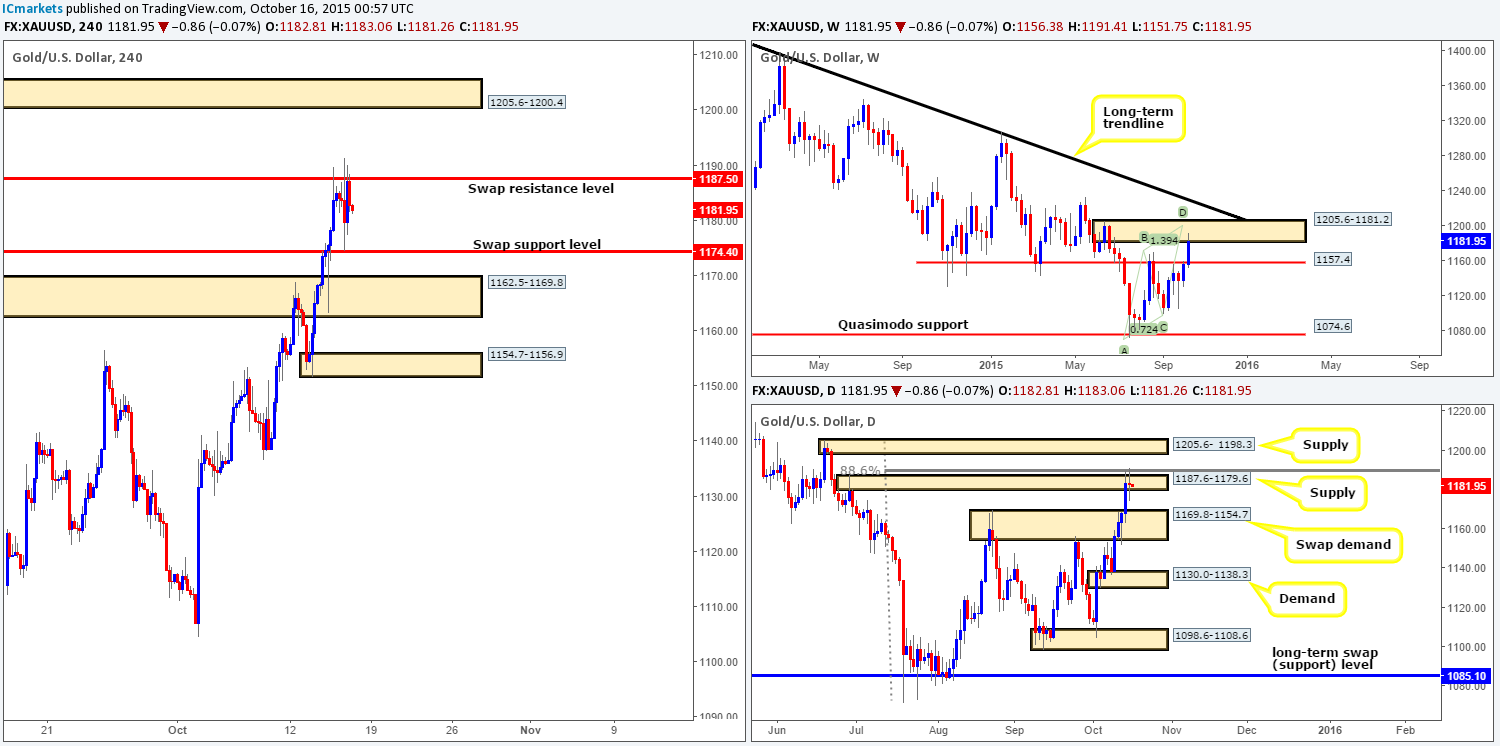
Levels to watch/ live orders:
- Buys: Flat (Stop loss: N/A).
- Sells:1187.5 [Tentative – confirmation required] (Stop loss: dependent on where one confirms this level) 1205.6-1200.4[Tentative – confirmation required] (Stop loss: 1206.9).


