A note on lower timeframe confirming price action…
Waiting for lower timeframe confirmation is our main tool to confirm strength within higher timeframe zones, andhas really been the key to our trading success. It takes a little time to understand the subtle nuances, however, as each trade is never the same, but once you master the rhythm so to speak, you will be saved from countless unnecessary losing trades. The following is a list of what we look for:
- A break/retest of supply or demand dependent on which way you’re trading.
- A trendline break/retest.
- Buying/selling tails – essentially we look for a cluster of very obvious spikes off of lower timeframe support and resistance levels within the higher timeframe zone.
- Candlestick patterns. We tend to only stick with pin bars and engulfing bars as these have proven to be the most effective.
EUR/USD:
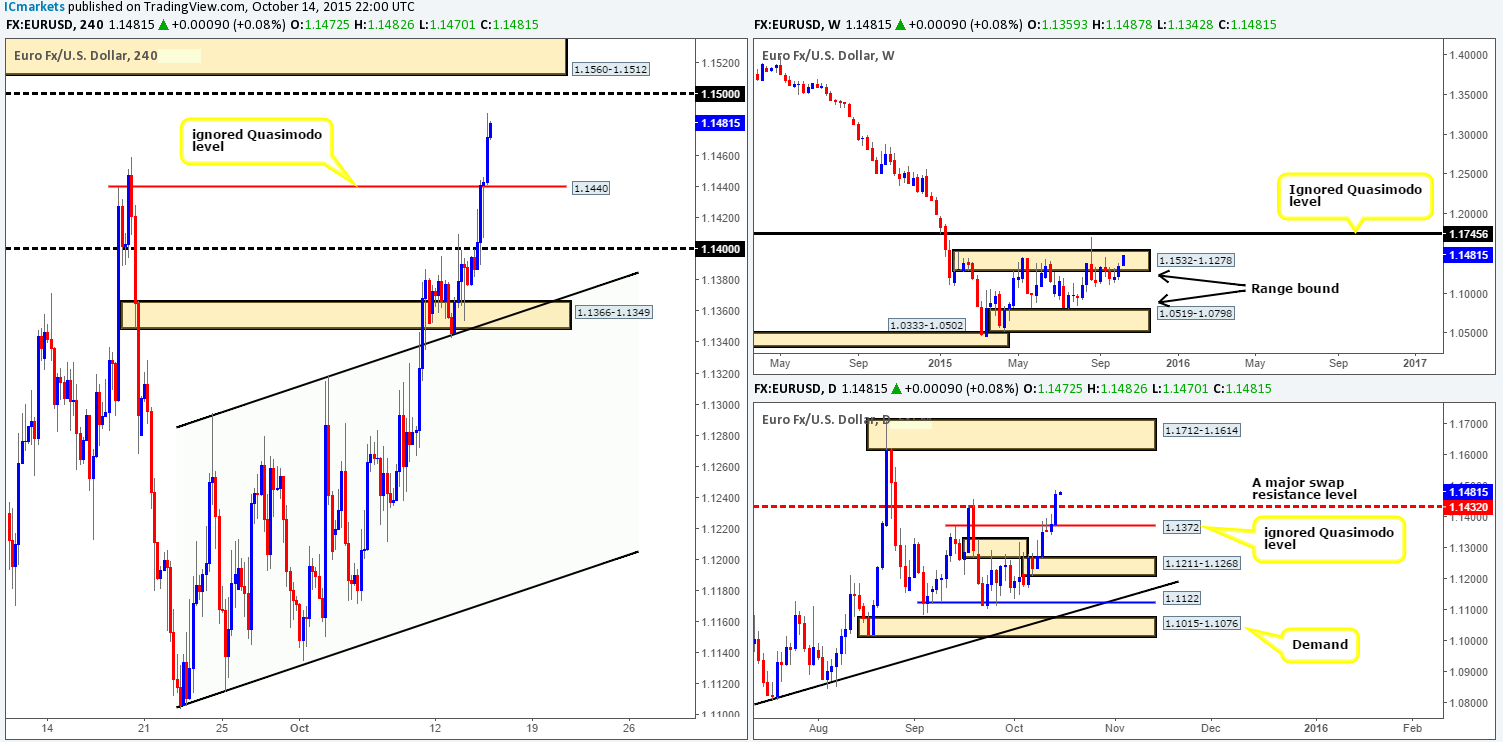
Despite the bounce from psychological resistance 1.1400 on Tuesday, the EUR pair aggressively rallied following a wave of disappointing U.S. data released mid-way through London. 1.1400 was consumed and although there were active sellers around the Quasimodo resistance line just above it at 1.1440, it was clearly not enough to withstand the flow of bids at that time.
With price reaching highs of 1.1487 yesterday, we see very little reason why this pair will not continue northbound today up to at least psychological resistance 1.1500, followed closely by supply at 1.1560-1.1512. Building on this, daily action shows that price recently broke above a major swap resistance level at 1.1432, thus potentially clearing the pathway north up to supply given at 1.1712-1.1614. In spite of the recent surge in buying, however, we mustn’t forget that the weekly timeframe is still loitering within supply at 1.1532-1.1278.
Given the above, here is what our team has jotted down so far for today’s upcoming trade:
-
Buying at current prices is out the question. Risk/reward would be totally skewed! In the event of a pullback to the ignored Quasimodo line at 1.1440 before hitting 1.1500 (our target), there could be an opportunity to buy this market from here should lower timeframe support hold firm.
- Assuming the market continues to rally early on in Asia, we will be looking to short into this momentum from supply at 1.1560-1.1512, in the hope that stops taken from 1.1500 would be enough to fuel an intraday bounce lower (lower timeframe confirmation required).
Levels to watch/live orders:
- Buys:1.1440 [Tentative – confirmation required] (Stop loss: dependent on where one confirms this level).
- Sells:1.1560-1.1512 [Tentative – confirmation required] (Stop loss: dependent on where one confirms this area).
GBP/USD:
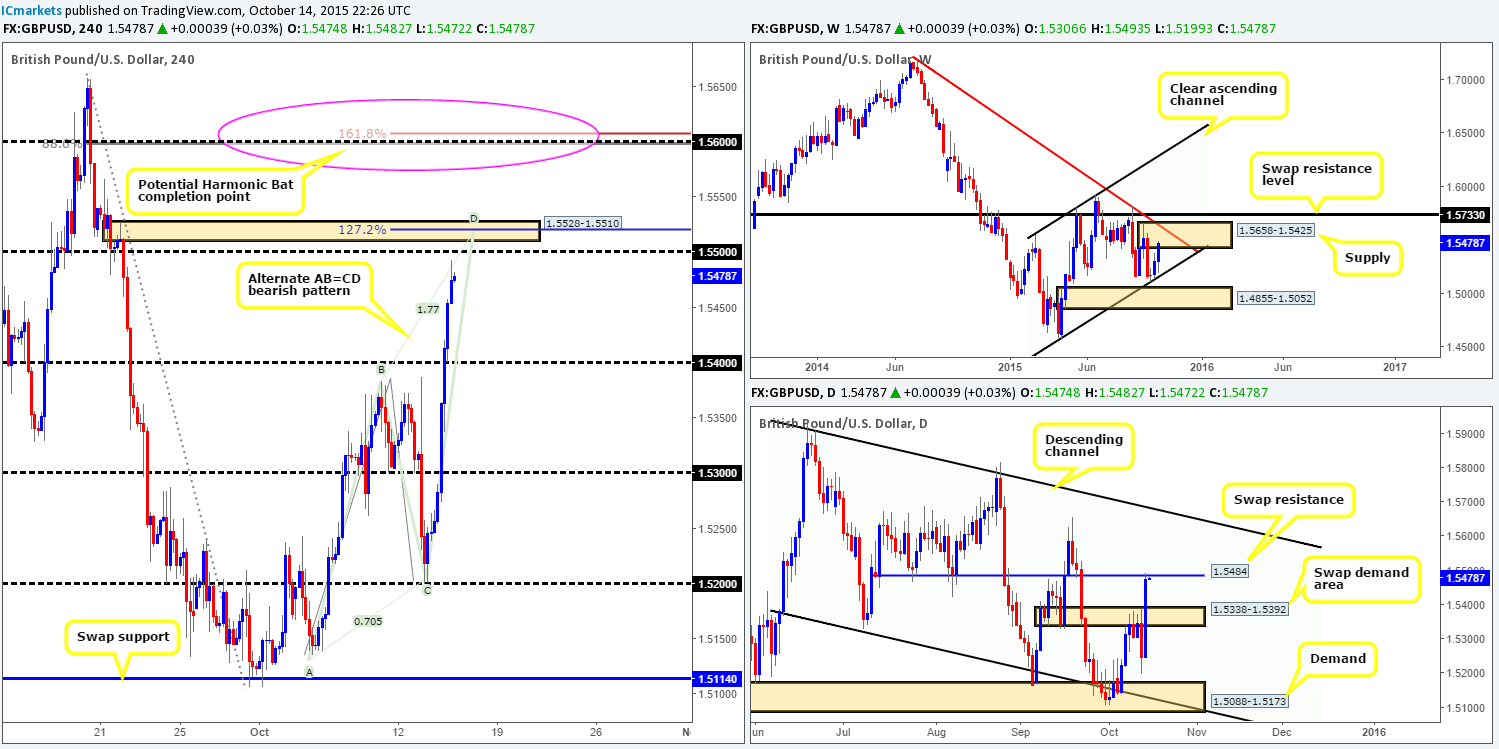
Despite weak GBP data, an unrelenting 200-pip squeeze to the upside took place amid trade yesterday, taking out several 4hr technical levels in the process and managing toreach highs of 1.5493 on the day.
In that price is lurking just below psychological resistance 1.5500 and supply just above it at 1.5528-1.5510, let’s take a peek at what this recent surge of buying looks like on the bigger picture. Up on the weekly chart, it is clear to see that price is now firmly trading within the jaws of a supply drawn from 1.5658-1.5425. Meanwhile, down on the daily chart, Cable is now flirting with the underside of a swap resistance barrier given at 1.5484.
Consequent to this, the weekly, daily and 4hr timeframes are either crossing swords with some form of resistance, or hovering very close. That being the case, our team currently has their eye on the aforementioned 4hr supply zone, since it not only converges with the above said higher timeframe areas, but also boasts an alternate AB=CD correction point within. We have placed a pending sell at 1.5506, with a small stop above at 1.5534. Should the order get filled and move in our favor, we’ll be eyeing 1.5400 as our first take-profit zone.
In the event we get taken out of this trade and price closes higher, our team will then be watching to see if price advances to connect with a Harmonic Bat completion point sitting around psychological resistance 1.5600.
Levels to watch/ live orders:
- Buys: Flat (Stop loss: N/A).
- Sells: 1.5506 (Stop loss: 1.5534) 1.5600 [Tentative – confirmation required] (Stop loss: dependent on where one confirms this level).
AUD/USD:
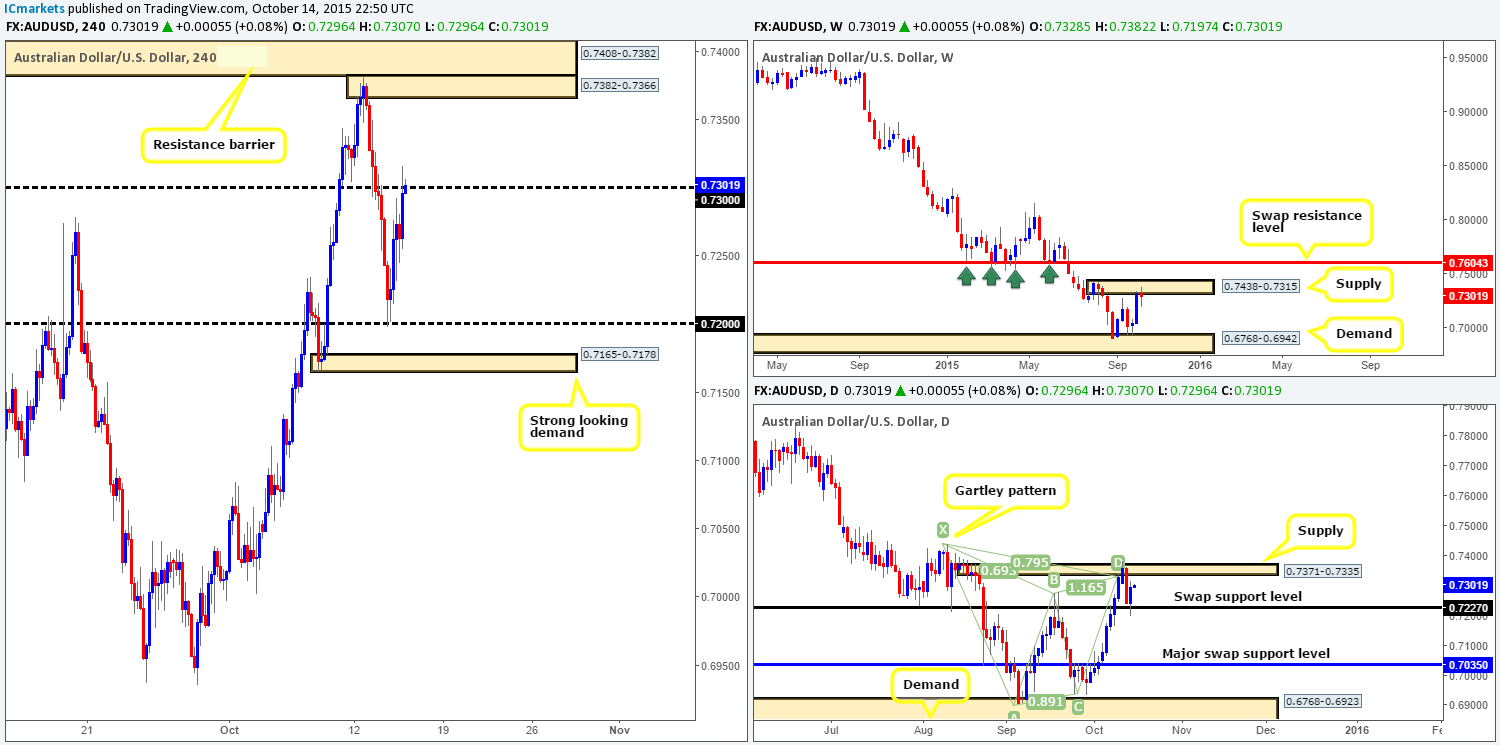
During the course of yesterday’s sessions, the AUD corrected sharply higher from psychological support 0.7200, which, as you can see, saw price rally up to psychological resistance 0.7300 by the days end. This buying, at least from a technical standpoint, likely stems from both bids at 0.7200, but also because price was, at that time, trading from a daily swap (support) level at 0.7227.
With the above in mind, we still believe this pair to be technically overbought right now with supply on both the Weekly and daily timeframes still looming over this market like a black rain cloud (0.7438-0.7315/0.7371-0.7335). Moreover, let’s not forget about the Harmonic Gartley sell zone positioned within the aforementioned daily supply.
Ultimately though, our team is not too comfortable shorting at 0.7300 due to the daily timeframe showing room yet to appreciate up to the above said supply zone. We’d much prefer to wait and see if price rallies north up to a small stacked formation (0.7408-0.7382/0.7382-0.7366), which is where, dependent on the how the lower timeframe reacts of course, we plan on shorting into this market.
Levels to watch/ live orders:
- Buys:Flat (Stop loss: N/A).
- Sells:0.7408-0.7382/0.7382-0.7366 [Tentative – confirmation required] (Stop loss: dependent on where one finds confirmation within this area).
USD/JPY:
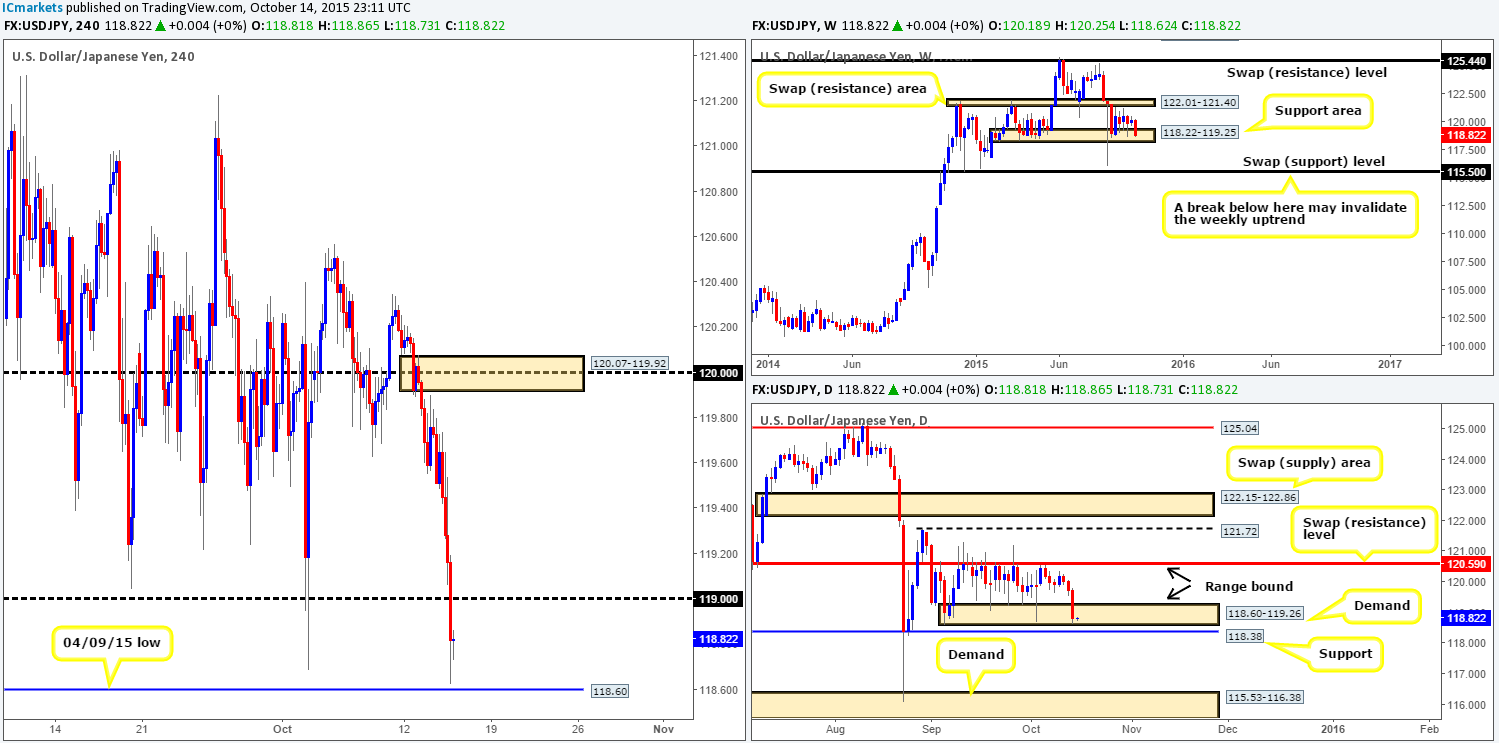
Starting from the top this morning, the weekly timeframe shows price is now trading within the lower limits of its current range –a support area taken from118.22-119.25. By the same token, the daily timeframe is also trading deep within the lower limits of its present range at demand drawn from 118.60-119.26.
Moving down into the pits of the 4hr timeframe, nonetheless, it’s quite clear to see that it was not a good day for anyone long this pair as prices tumbled around 100 pips yesterday. It was only once buyers found supportive pressure a few pips shy of the 04/09/15 low did this market really begin to stabilize.
Given that both the weekly and daily charts are in potential buy zones right now (see above); would we deem current price on the 4hr chart to be a possible buy? At current price, most certainly not. However, should we see this market close above psychological resistance 119.00 today; this will be enough for us to be convinced bulls are actively participating in the market. Just to be clear here though traders, we have no intention in buying any breakout above 119.00. What we plan on doing is waiting to see if price retests 119.00 as support and only buying if we seea lower timeframe confirming setup form.
Levels to watch/ live orders:
- Buys:Watch for offers at 119.00 to be consumed and look to enter on any retest seen at this level (confirmation required).
- Sells:Flat (Stop loss: N/A).
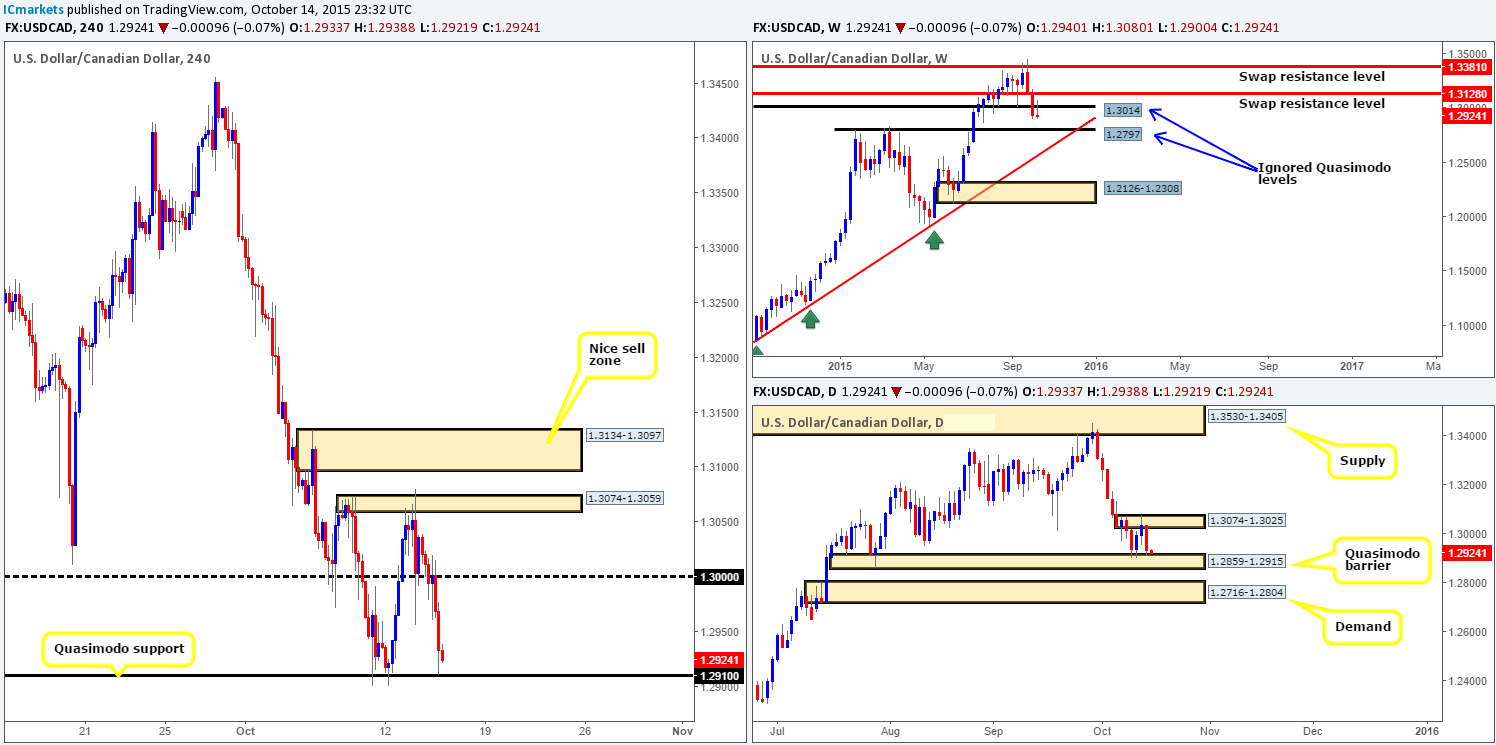
USD/CAD:
This morning’s USD/CAD analysis will kick-off with a look at weekly structure, which, as you can see, shows price so far respecting the underside of the ignored Quasimodo swap level at 1.3014. Should the sellers remain dominant here; this market could continue south down towards another ignored Quasimodo level given at 1.2797. Daily action on the other hand, reveals that price is once again flirting with the top-side of demand coming in at 1.2859-1.2915.
Moving into the pits of the 4hr timeframe, however, we can see that the large psychological support 1.3000 was broken and retested as resistance before price plummeted down to Quasimodo support at 1.2910. We do hope some of our readers took advantage of this move as this was noted to watch for in our previous report.
So, where do we go from here? Well, with the weekly indicating lower prices are possible, the daily suggesting to be wary of shorts right now and the 4hr timeframe is seen lurking just above a Quasimodo support (see above for levels), we’re unfortunately left relatively unsure of this market. As such, with this mish-mash of signals here, opting to stand on the sidelines may very well be the best path to take for the time being.
Levels to watch/ live orders:
- Buys: Flat (Stop loss: N/A).
- Sells: Flat (Stop loss: N/A).
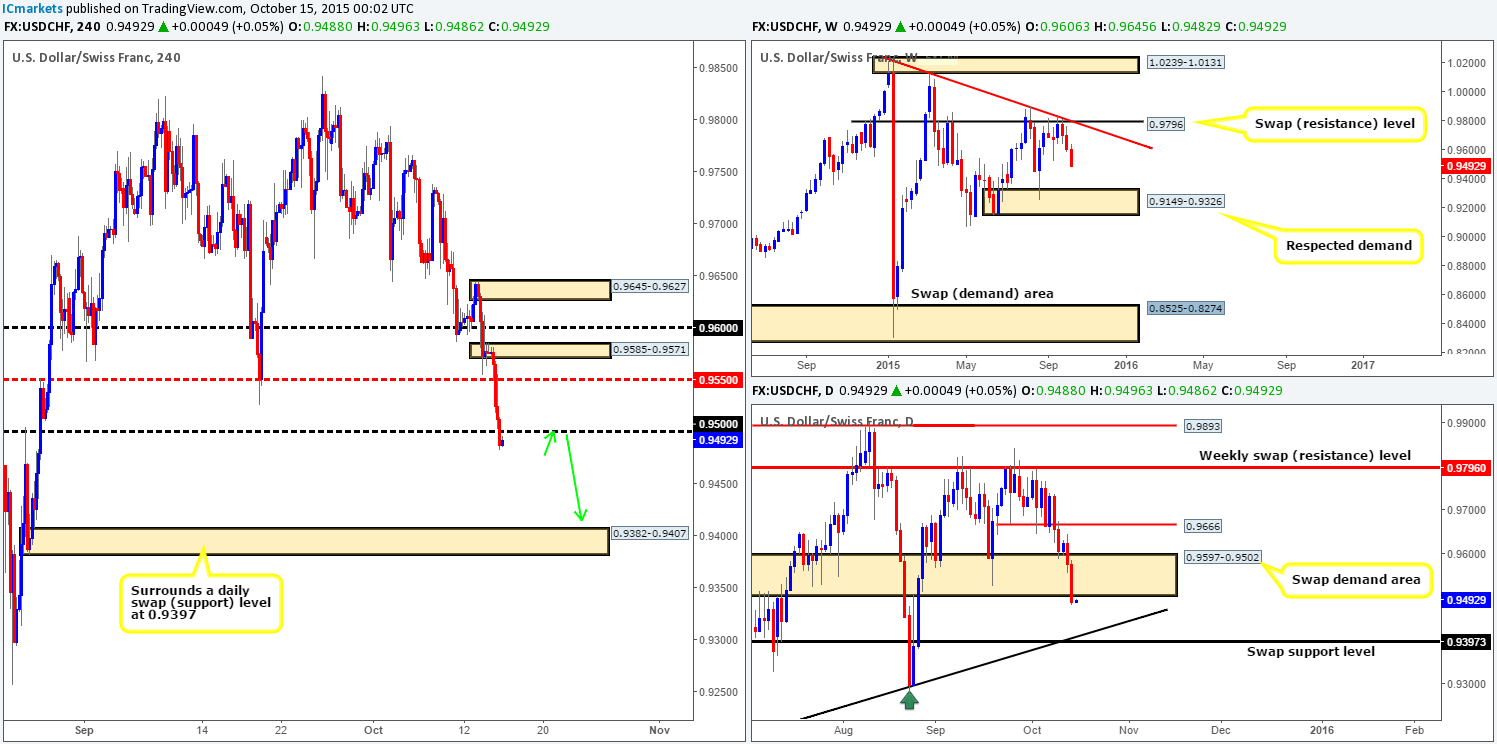
USD/CHF:
A few hours into yesterday’s trade the pair began aggressively selling off, eventually erasing bids at both mid-level support 0.9550 and also just recently at psychological support 0.9500. This latest decline in value has not only extended price lower from the weekly swap (resistance) barrier at 0.9796, it has also engulfed a daily swap (demand) area at 0.9597-0.9502, potentially clearing room for further downside towards the 0.9397 mark.
Taking the above into account, our objective for this pair is relatively simple today. Watch for price to retest 0.9500 as resistance and then look to enter short alongside lower timeframe confirming price action (green arrows). In regards to targets, we see very little in the way of support until demand given at 0.9382-0.9407, which, as noted on the chart, ties in beautifully with the above said daily swap (support) level.
Levels to watch/ live orders:
- Buys: Flat (Stop loss: N/A).
- Sells: 0.9500 [Tentative – confirmation required] (Stop loss: dependent on where one confirms this level).
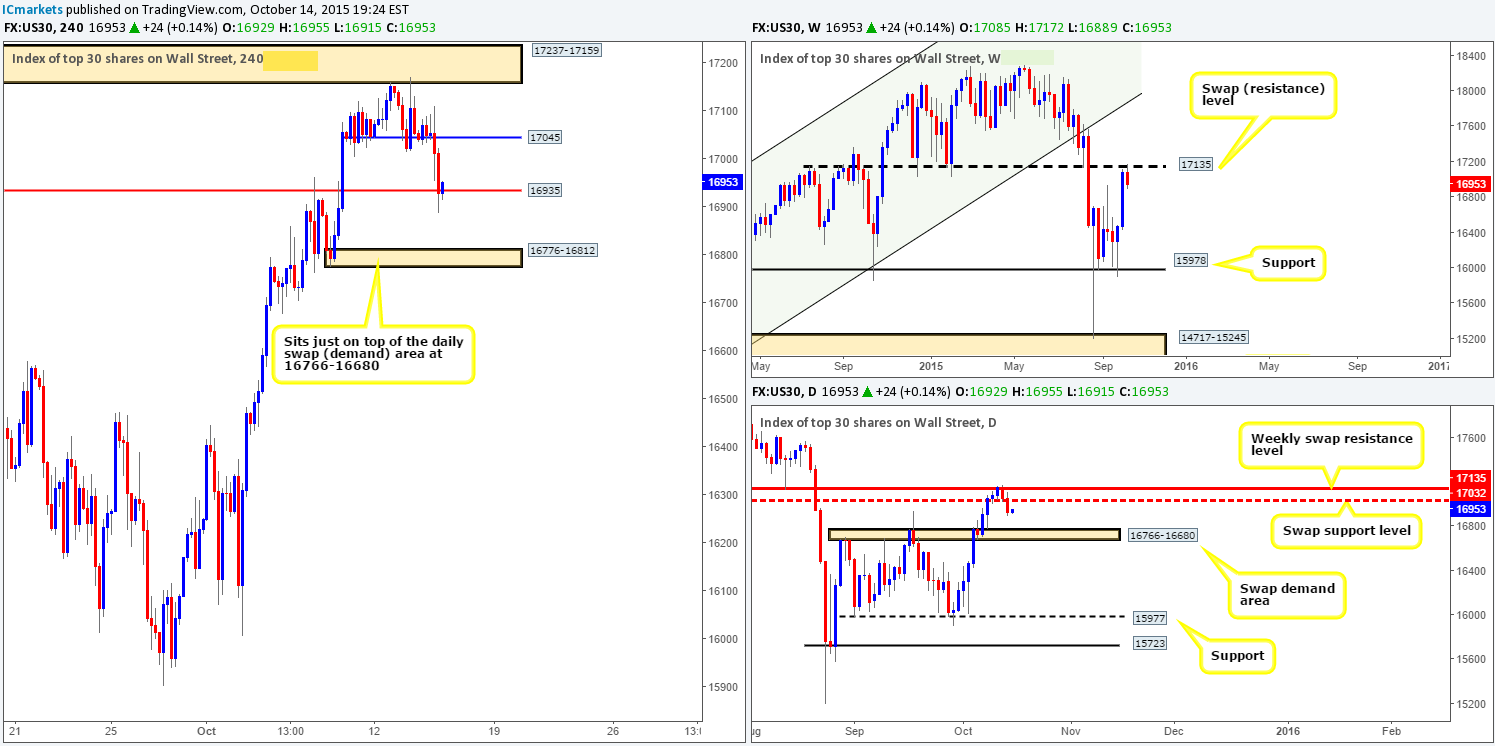
DOW 30:
For those who read our previous report on the DOW (http://www.icmarkets.com/blog/wednesday-14th-october-heavy-action-expected-in-the-markets-at-8-30ammidday-gmt-remain-vigilant/), you may recall us mentioning to watch for a potential sell on the break/retest of 17045. As can be seen from the chart, a break lower was indeed seen, but unfortunately there was no concrete retest, so we missed this entire move down to the swap support level at 16935 yesterday, which is where current price is holding as we write.
With the above in mind, how do things stand on the higher timeframe picture? Well, weekly action has respected the swap resistance level at 17135 just beautifully, whilst on the daily timeframe, we can see price recently broke below swap support at 17032, possibly clearing room for further selling down to swap demand seen at 16766-16680.
Given what is being seen on the higher timeframes right now, our team believes the 4hr swap support (level) at 16935 may give way, and likely head in the direction of demand taken from 16776-16812 (sits just above the daily swap [demand] area at 16766-16680). Therefore, our prime focus today will be on watching for a break below and retest of 16935, which in effect, will be our cue to begin watching for a lower timeframe confirmed sell, targeting the aforementioned 4hr demand.
Levels to watch/ live orders:
- Buys: Flat (Stop loss: N/A).
- Sells:Watch for bids at 16935 to be consumed and look to enter on any retest seen at this level (confirmation required).
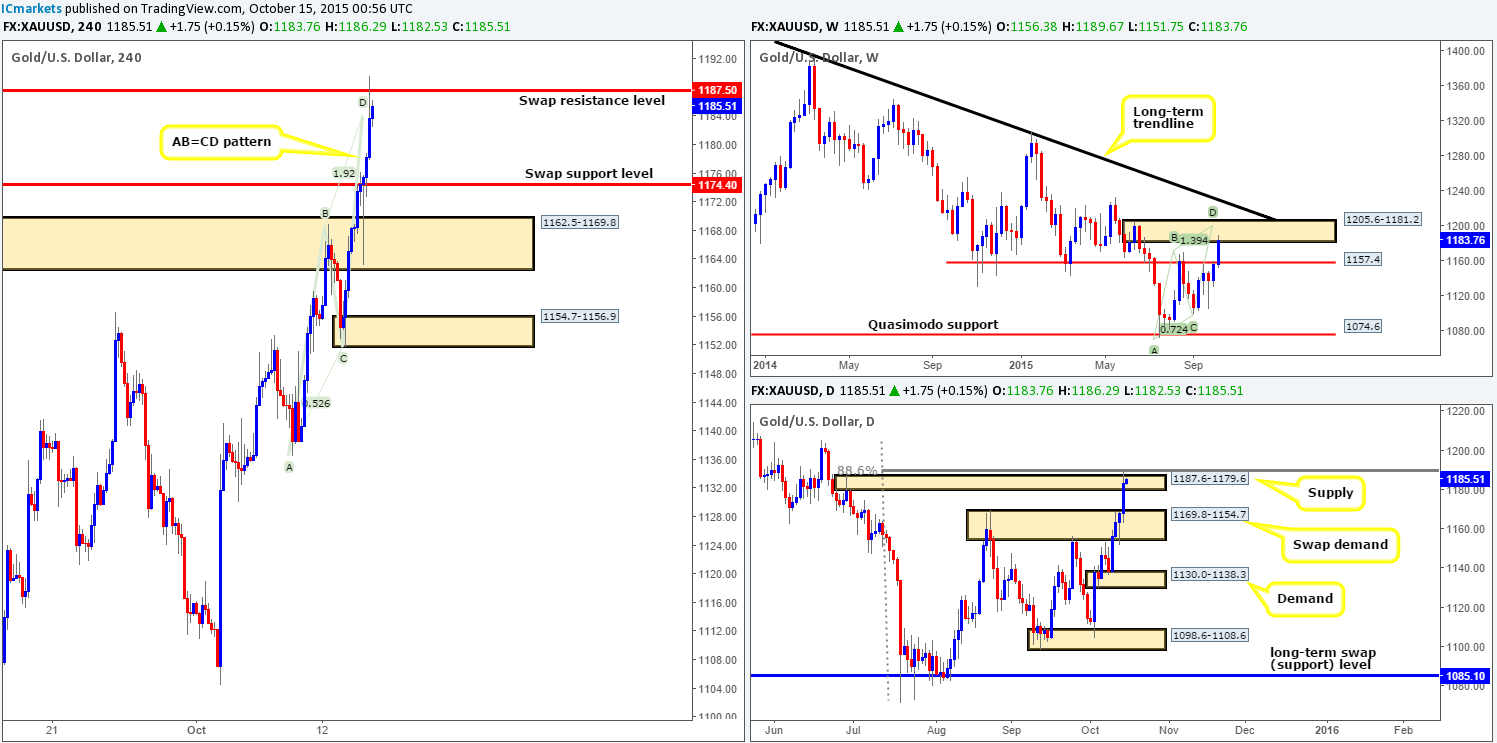
XAU/USD: (Gold)
Using a top-down approach this morning, we can see that market action on the weekly timeframe has now crossed swords with the weekly supply zone coming in at 1205.6-1181.2. This area, as we mentioned in yesterday’s report, is a perfect zone to look for shorts. It not only converges with a bearish Harmonic AB=CD pattern (1199.4), but also with the underside of a long-term trendline extended from the high 1488.0. Looking at the daily timeframe, however, price recently spiked above a small supply at 1187.6-1179.6, and touched gloves with the 88.6% Fibonacci resistance level.
Turning our attention to the 4hr timeframe shows that Gold has just connected with a swap resistance level seen at 1187.5. Now, given the overall position of this market right now, and the fact that on approach to the 4hr resistance barrier, an AB=CD pattern formed, our intraday bias is south. That being the case, if we happen to spot a lower timeframe sell setup in the region of current price today, we’d jump in short, targeting the swap support level at 1174.4, followed closely by the swap demand base at 1162.5-1169.8.
The reason for requiring confirmation when this market is in overall resistance is simply because the upward momentum on Gold has been so strong lately, as a result, our level could easily be blown through!
Levels to watch/ live orders:
- Buys: Flat (Stop loss: N/A).
- Sells:1187.5 [Tentative – confirmation required] (Stop loss: dependent on where one confirms this level).