
A note on lower timeframe confirming price action…
Waiting for lower timeframe confirmation is our main tool to confirm strength within higher timeframe zones, andhas really been the key to our trading success. It takes a little time to understand the subtle nuances, however, as each trade is never the same, but once you master the rhythm so to speak, you will be saved from countless unnecessary losing trades. The following is a list of what we look for:
- A break/retest of supply or demand dependent on which way you’re trading.
- A trendline break/retest.
- Buying/selling tails – essentially we look for a cluster of very obvious spikes off of lower timeframe support and resistance levels within the higher timeframe zone.
- Candlestick patterns. We tend to only stick with pin bars and engulfing bars as these have proven to be the most effective.
EUR/USD:
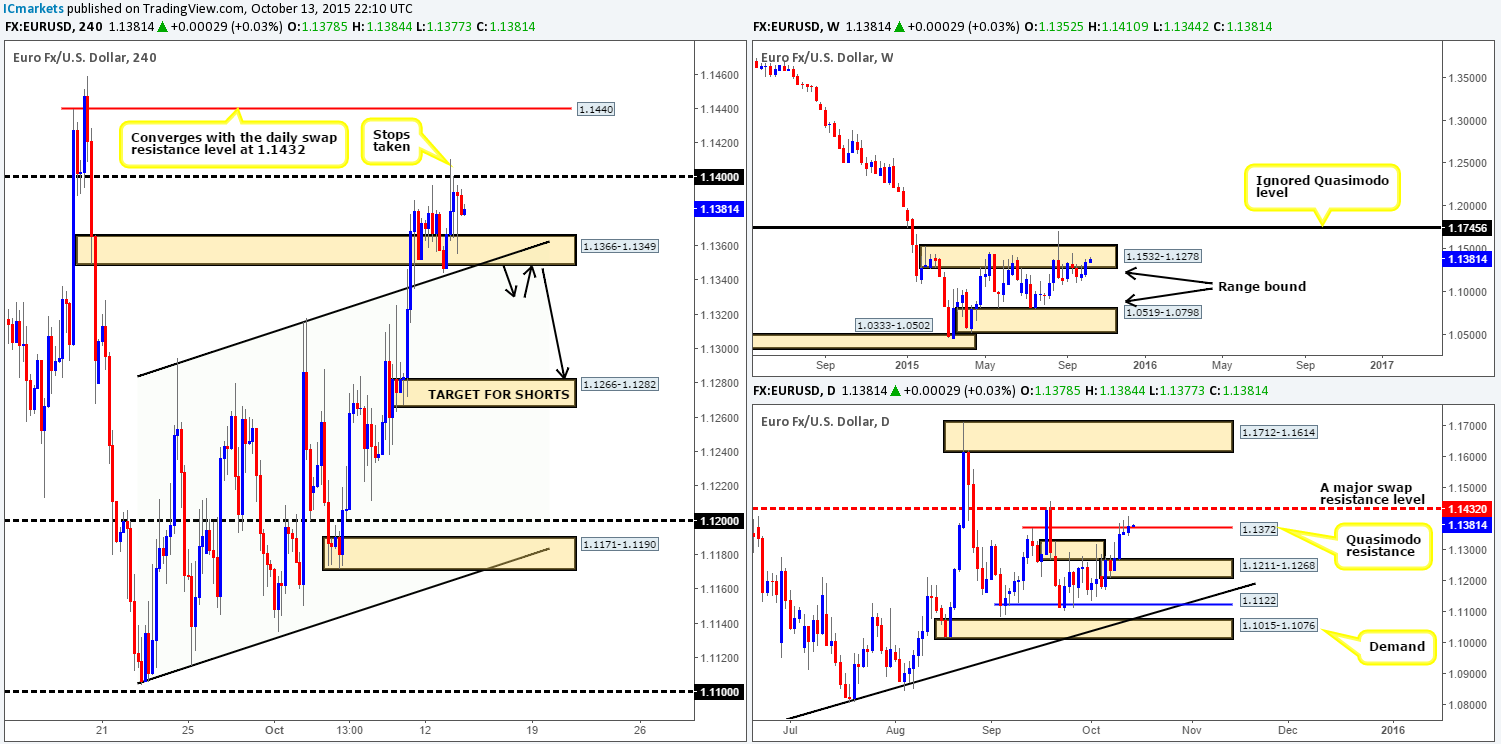
Using a top-down approach this morning shows that weekly action, despite the recent rally, still remains consolidating around the base of supply drawn from 1.1532-1.1278. In the event of a break above this barrier, the ignored Quasimodo resistance level at 1.1745 would be the next limit to reach. From the pits of the daily timeframe, however, price ever so slightly closed above the Quasimodo resistance level given at 1.1372 yesterday, thus potentially clearing the runway north for further upside towards a major swap resistance level at 1.1432.
Turning our attention to the 4hr scale shows that the swap demand base at1.1366-1.1349 supported the EUR during yesterday’s sessions. This forced the EUR higher but failed to close beyond the 1.1400 handle. With stops now likely taken out above 1.1400, the path north above this figure is possibly free up to Quasimodo resistance drawn from 1.1440. Consequent to this, we see two possible scenarios playing out today:
- The close above the aforementioned daily Quasimodo resistance may attract further buying today. This, in turn, will likely push price above 1.1400 up to 1.1440 – the Quasimodo resistance mentioned above. Considering that this level ties in nicely with the aforementioned (major) daily swap resistance level, a possible (confirmed) short may present itself from here should price reach this high.
- 1.1400 may still hold firm. The stops taken from above this figure could be enough liquidity to continue pushing this market south today. That being the case, we’d then look for price to take out bids around the aforementioned 4hr swap (demand) area and top-side of the upward channel (1.1294). Should the above come to fruition, there may be an opportunity to trade this pair if price retests the broken area before descending lower (see black arrows).
Levels to watch/live orders:
- Buys: Flat (Stop loss: N/A).
- Sells:1.1440 [Tentative – confirmation required] (Stop loss: dependent on where one confirms this level) watch for bids at 1.1366-1.1349/top-side of upward channel to be consumed and look to enter on any retest seen at this area (confirmation required).
GBP/USD:
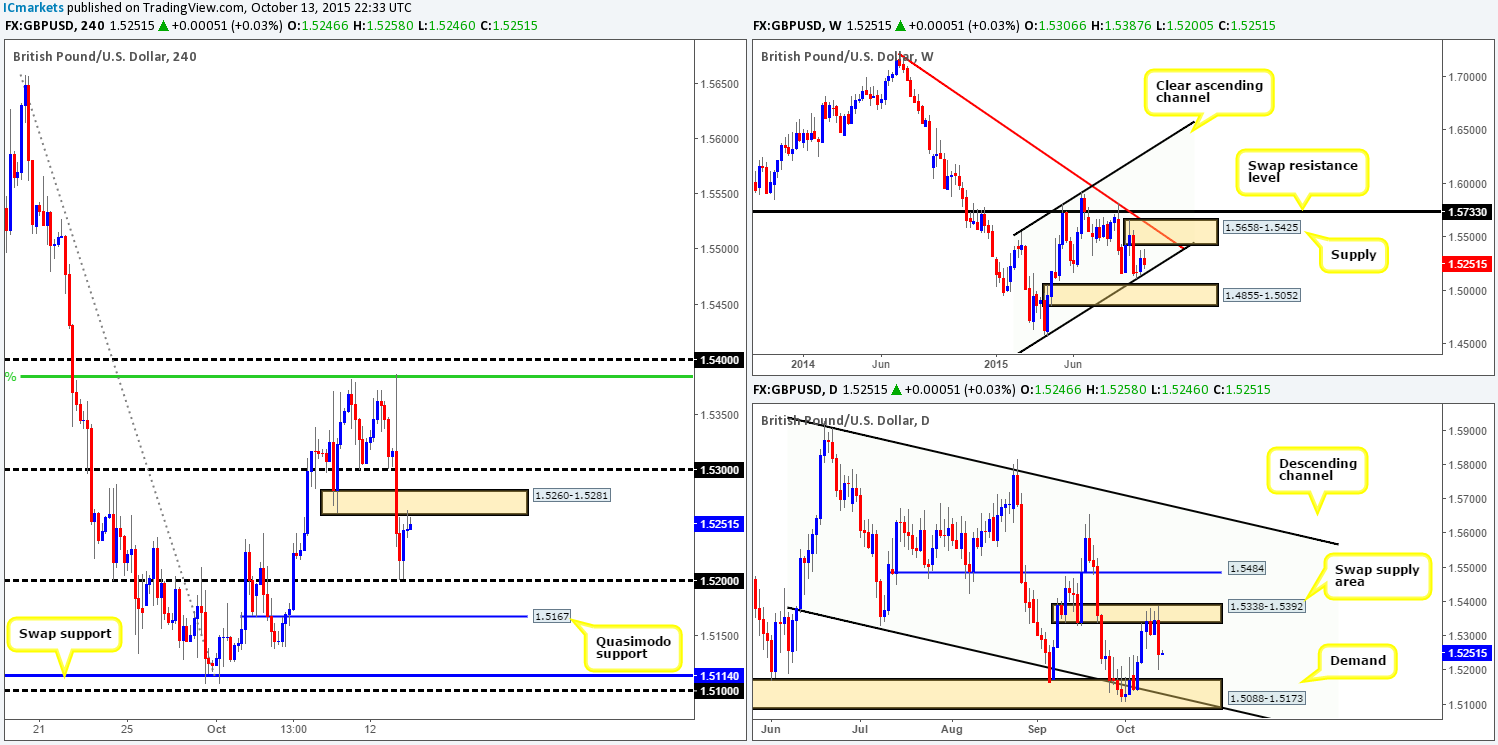
Lower than expected inflation data came in from the sunny UK yesterday pushing the GBP southbound from the underside of our noted 50% Fibonacci resistance level at 1.5384. Both psychological support 1.5300 and demand at 1.5260-1.5281 were taken out during this onslaught. It was only once bids were filled at 1.5200 going into the American session, did we see price counter-attack back up to the underside of the recently broken demand (now supply).
In regard to price trading at a potential sell zone right now, how do things stand on the higher timeframes? Up on the weekly, price is, as far as we’re concerned, loitering mid-range between supply at 1.5658-1.5425, and channel support extended from the low 1.4586. Daily action on the other hand, sold off beautifully from within supply coming in at 1.5338-1.5392, which, if the sellers can maintain their position, shows room to continue driving lower towards demand at 1.5088-1.5173.
Therefore, in light of the above, both the current swap supply area at 1.5260-1.5281 and maybe even the 1.5300 handle are areas we believe confirmed shorts could be possible from today. Should our analysis be correct and price sells-off from one the above said areas, we’ll be eyeing 1.5200 as our immediate take-profit area, followed closely by the Quasimodo support at 1.5167 (converges with the top-side of the aforementioned daily demand).
Levels to watch/ live orders:
- Buys: Flat (Stop loss: N/A).
- Sells: 1.5260-1.5281 [Tentative – confirmation required] (Stop loss: dependent on where one confirms this area) 1.5300 [Tentative – confirmation required] (Stop loss: dependent on where one confirms this level).
AUD/USD:
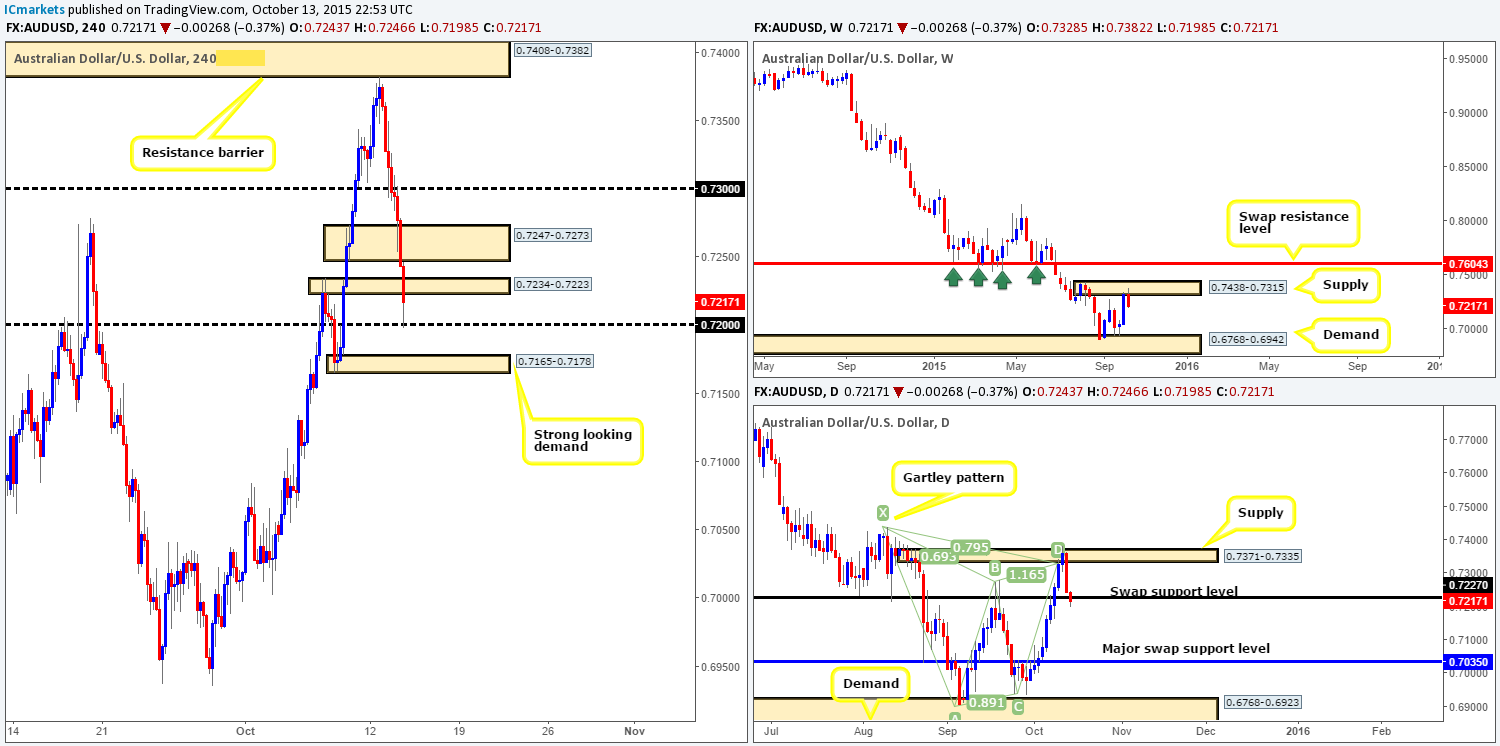
Whoa! Upon opening up the 4hr chart of the Aussie dollar this morning, we were greeted with a sea of red candles! Monday’s rebound from the 4hr resistance barrier at 0.7408-0.7382 saw price continue to aggressively sell-off during yesterday’s sessions. This move, as shown on the chart, took out several technical areas in the process, and has only recently driven into bids sitting at psychological support 0.7200.
Technically, it should not come as much of a surprise as to why the Aussie sold off. Weekly action was, at that point, trading within fresh supply at 0.7438-0.7315, while the daily chart shows the buyers and sellers were battling for position within a Harmonic Gartley reversal zone around the 0.7335 mark. Unfortunately, we decided to remain flat during trade on this pair yesterday since there were so many supportive structures beneath price at that time!
Given that this recent movement has now dragged the Aussie into a daily swap support barrier at 0.7227, and that the weekly shows room to continue lower, where do we go from here?Unfortunately, once again, we see no clear run on the 4hr chart to trade. Directly below 0.7200 sits demand at 0.7165-0.7178, whilst above 0.7200, there are not only potential offers sitting around the swap supply zone at 0.7234-0.7223, but also above as well at 0.7247-0.7273. With that, our team’s position will remain flat going into today’s sessions.
Levels to watch/ live orders:
- Buys:Flat (Stop loss: N/A).
- Sells: Flat (Stop loss: N/A)
USD/JPY:
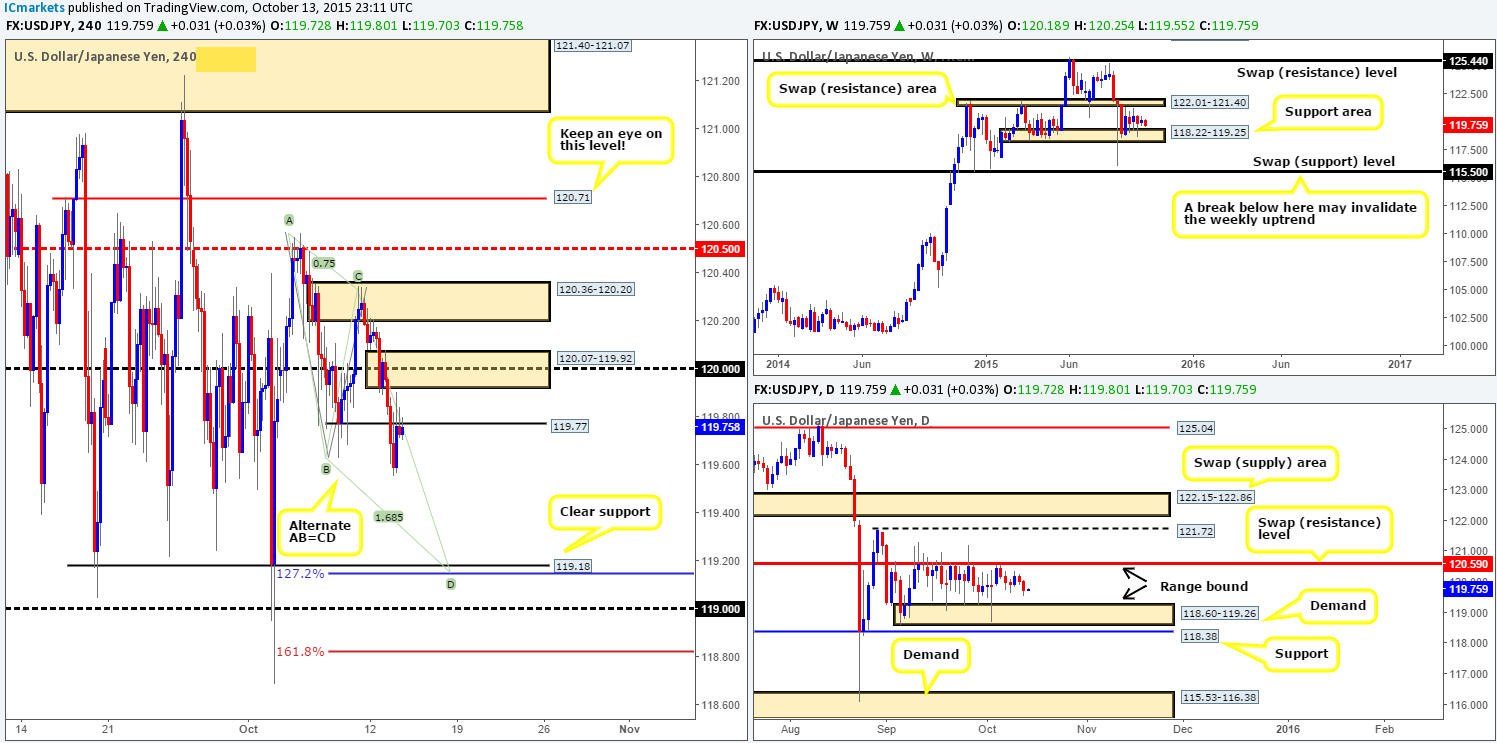
During the course of yesterday’s sessions, the USD/JPY continued to decline in value going into London trade, reaching lows of 119.55 on the day. It was, however, from this point(the U.S. open) did we see price reverse and attack the underside of a minor swap resistance level at 119.77 by the days end.
Now, as we mentioned in our previous report, our team has come to a general consensus that no trade will be permitted on this pair this week UNLESS it converges with the higher timeframe extremes. Reason being is price has been far too choppy on the 4hr timeframe for our liking recently. On top of this, there is little direction being seen from the weekly and daily charts at the moment, as both are currently range bound (122.01-121.40/118.22-119.25 – 120.59/118.60-119.26).
To that end, below is what we currently have our eye on at the moment:
Buys:
- 119.00/119.18. A clear support that coincides beautifully with both the above said weekly and daily demands (see above in bold). Furthermore, notice how if price continues to drive lower from the current swap resistance level at 119.77, we could see an alternate AB=CD pattern form, completing perfectly with 119.18!
Sells:
- Mid-level resistance 120.50. This beauty not only lines up nicely with the aforementioned daily upper range limit, but also has already proved its worth back on the 06/10/15 at 120.56.
- 120.71. This level is practically a hidden left shoulder. Since these levels usually see a bounce and considering the fact that it sits just above the daily 120.59 level.
Levels to watch/ live orders:
- Buys:119.00/119.18 [Tentative – confirmation required] (Stop loss: dependent on where one confirms this level).
- Sells:120.50 [Tentative – confirmation required] (Stop loss: dependent on where one confirms this level) 120.71 [Tentative – confirmation required] (Stop loss: dependent on where one confirms this level).
USD/CAD:
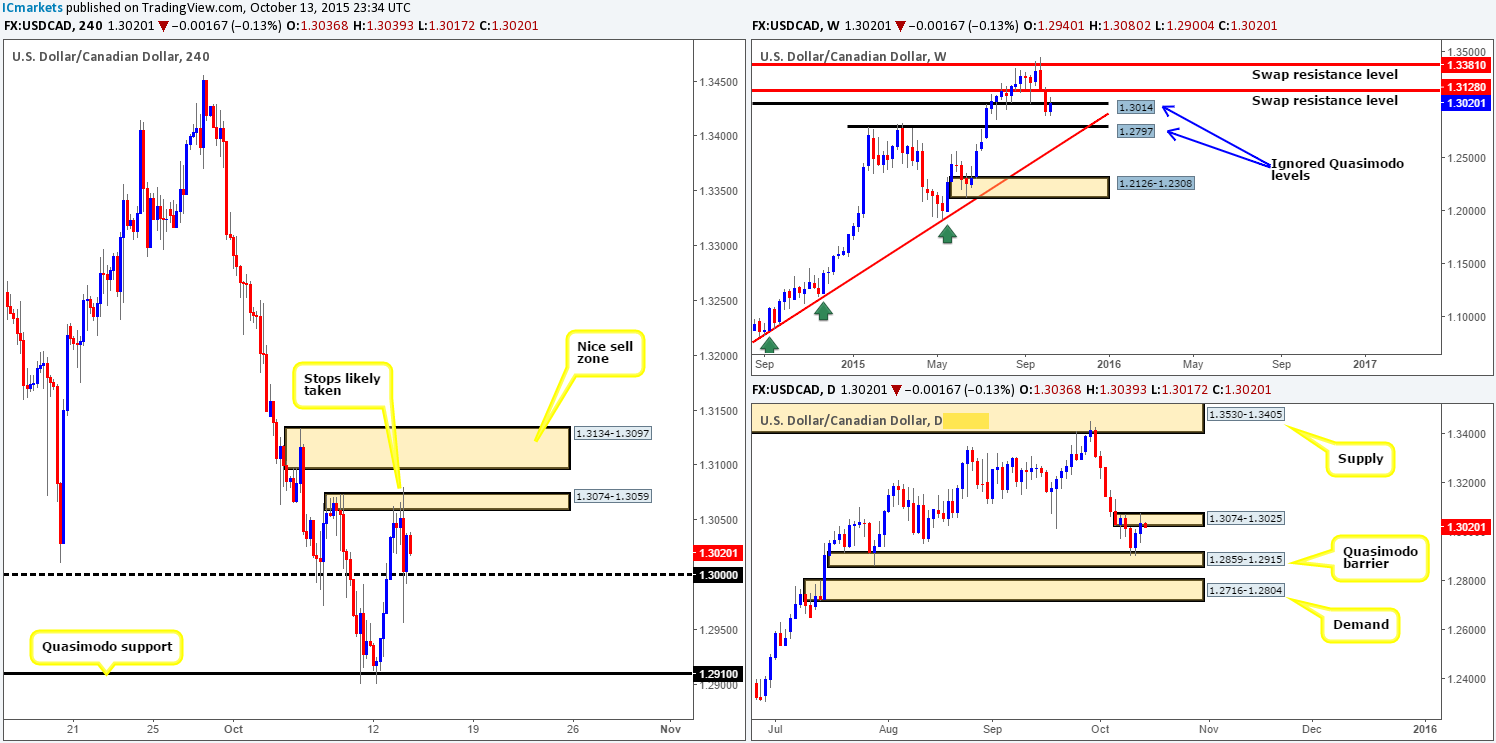
As we can all see on the 4hr chart, price did indeed cross swords with supply going into the early hours of yesterday’s sessions. Initially, market action was holding nicely below this zone and we were considering a short at that time. However, moving into the American session, price faked above this area and took out a huge chunk of sell orders before aggressively driving lower towards the large psychological support 1.3000.
With the majority of sellers likely removed from the above said supply, and 1.3000 currently holding firm, we see a potential move higher to connect with supply sitting at 1.3134-1.3097. The reason for labeling this a ‘nice sell zone’ is due to it lining up with the 1.3100 figure, and also providing pro money a nice base to fakeout to above the already weak-looking supply at 1.3074-1.3059.
However, should the selling pressure from the ignored weekly Quasimodo swap at 1.3014, and daily supply at 1.3074-1.3025 be too strong, we may see a close below 1.3000 today. Should this come to fruition, we’d then be looking to trade any confirmed retest seen at the underside of this level, targeting the Quasimodo support region at 1.2910.
Levels to watch/ live orders:
- Buys: Flat (Stop loss: N/A).
- Sells: Watch for bids at 1.3000 to be consumed and look to enter on any retest seen at this level (confirmation required) 1.3134-1.3097 [Tentative – confirmation required] (Stop loss: dependent on where one confirms this area).
USD/CHF:
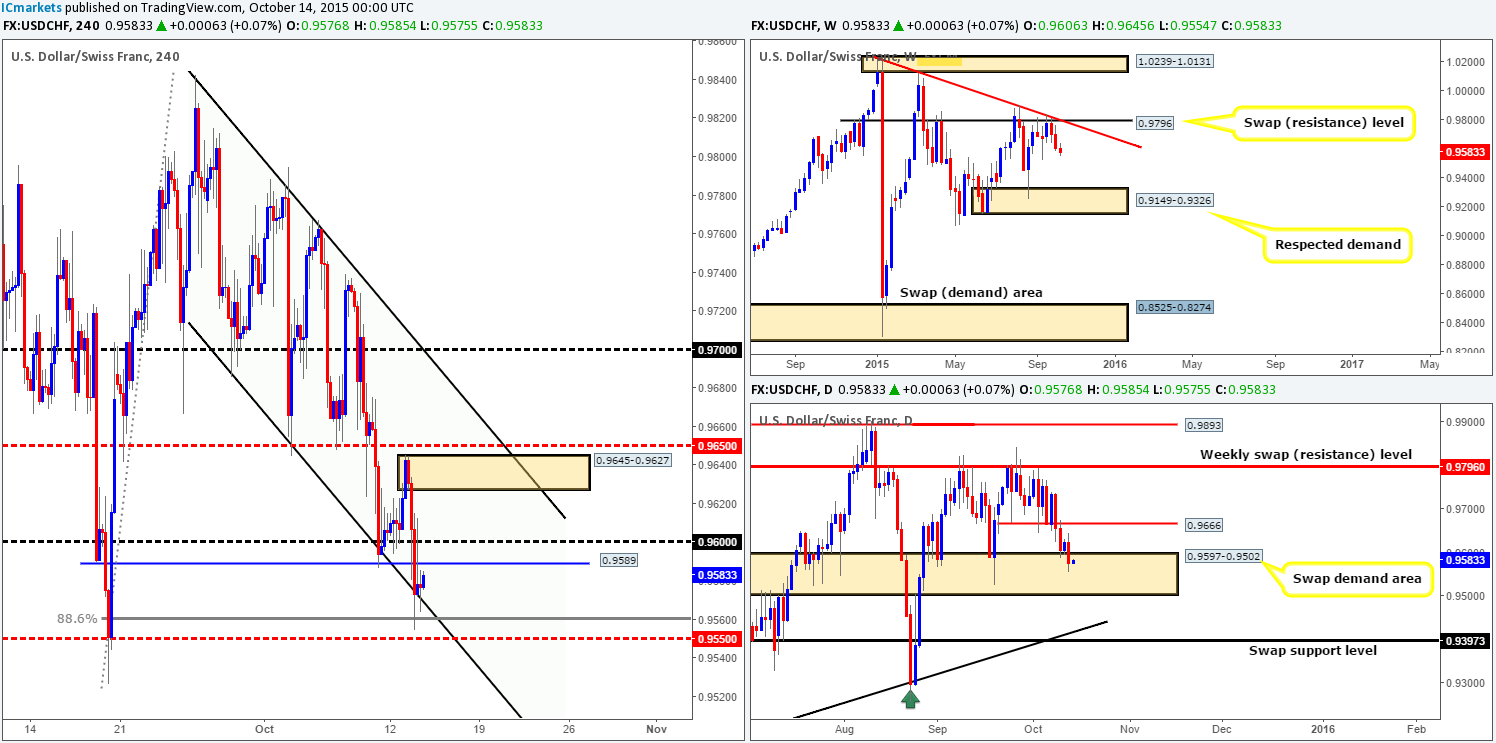
This morning’s analysis will kick-off with a look at the weekly timeframe, which shows price continues to decline in value following the rebound from the swap resistance level at 0.9796. Ideally, for us to be confident that this move is genuine, the 0.9526 low will need to be taken out. Looking at the daily timeframe on the other hand, we can see that price currently trades within a swap demand area drawn from 0.9597-0.9502.
Down on the 4hr timeframe, it’s clear to see that yesterday was not a good day for anyone long this pair as price sold off around 100 pips, surpassing both the 0.9600 handle and the 4hr Quasimodo support at 0.9589. It was only once this market connected with channel support taken from the low 0.9686 and the converging 88.6% Fibonacci support at 0.9560 did we see things begin to calm down.
Ok let’s see what we have here…. Assuming one wants to enter long from current prices. In their favor they would have the following (levels above):
- 4hr channel support.
- 88.6% Fibonacci support.
- A daily swap (demand) area.
Against a trade long here, however, we see the following:
- Weekly selling momentum.
- Near-term resistance sitting at 0.9589/0.9600.
Personally, we would not feel comfortable entering long at current prices. In fact, we would not feel comfortable entering long at all on this pair right now. The only place we’re watching at the moment is the recently-formed fresh supply given at 0.9645-0.9627 for confirmed sells. Therefore, unless price comes into contact with this zone today, our team is happy to remain flat for the time being.
Levels to watch/ live orders:
- Buys: Flat (Stop loss: N/A).
- Sells: 0.9645-0.9627 [Tentative – confirmation required] (Stop loss: dependent on where one confirms this area).
DOW 30:
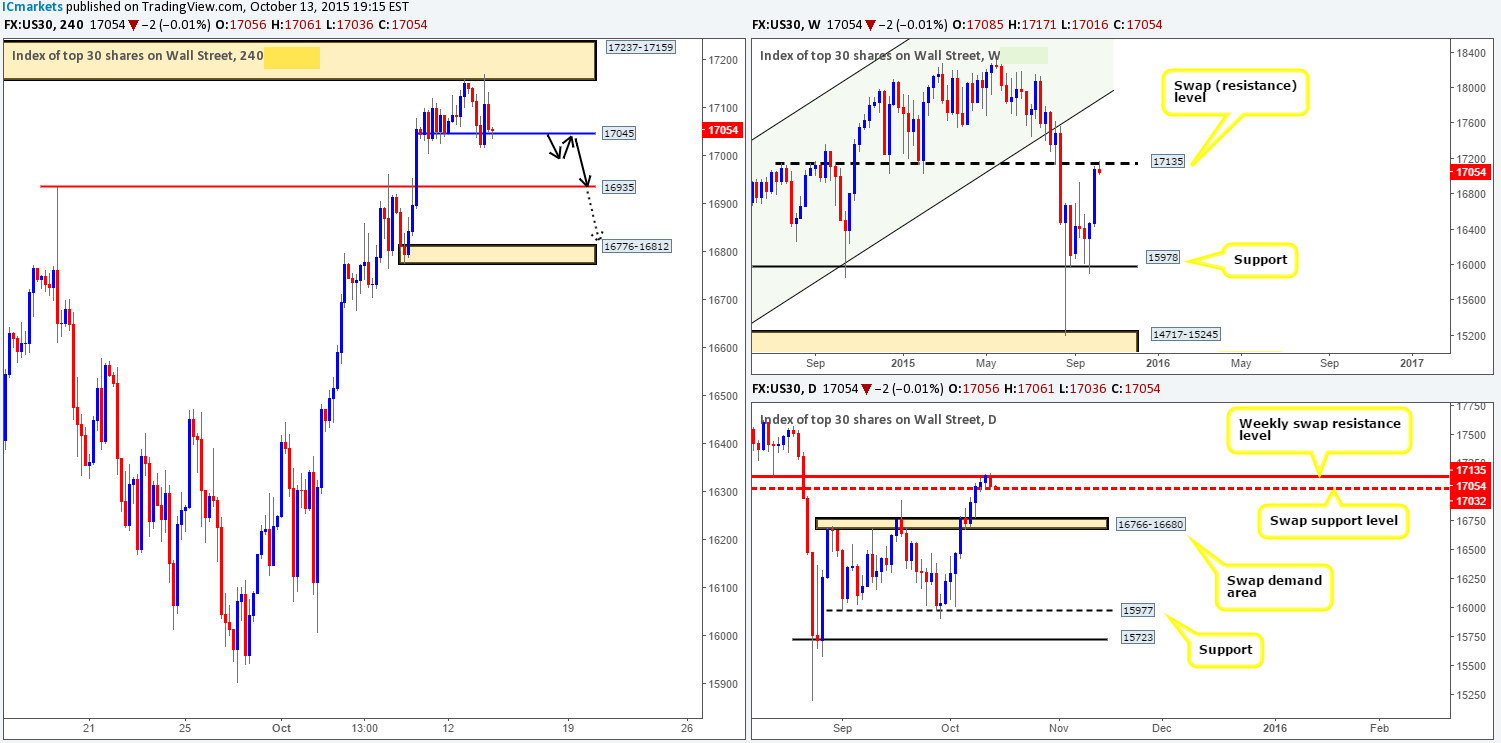
Coming at you directly from the weekly timeframe this morning, price is, as we write, showing bearish intent from the underside of the swap resistance level taken from 17135. Shifting a gear lower, we can see that this recent selling from the above said weekly level has forced price to once again retest support at 17032. Only this time, there was little buying interest seen here.
For those who read our previous report (http://www.icmarkets.com/blog/tuesday-13th-october-daily-technical-outlook-and-review/), you may recall us mentioning that we were interested in selling from the 4hr supply zone at 17237-17159. Unfortunately though, we were unable to pin-point a lower timeframe setup to permit such a trade. With price now seen kissing support at 17045, which was in actual fact our first take-profit area should a short have been taken, where do we see this market headed today?
Ultimately, we do not see this pair driving above the current 4hr supply zone just yet. In fact, considering the situation on the higher timeframe structure at present, we favor further selling. As such, should price break below 17045 and retest this area as resistance today (black arrows), we may, dependent on how the lower timeframes respond, look to short this market, targeting 16935, followed by demand at 16776-16812 (located deep within the daily swap [demand] area at 16776-16680).
Levels to watch/ live orders:
- Buys: Flat (Stop loss: N/A).
- Sells:Watch for bids at 17045 to be consumed and look to enter on any retest seen at this level (confirmation required).
XAU/USD: (Gold)
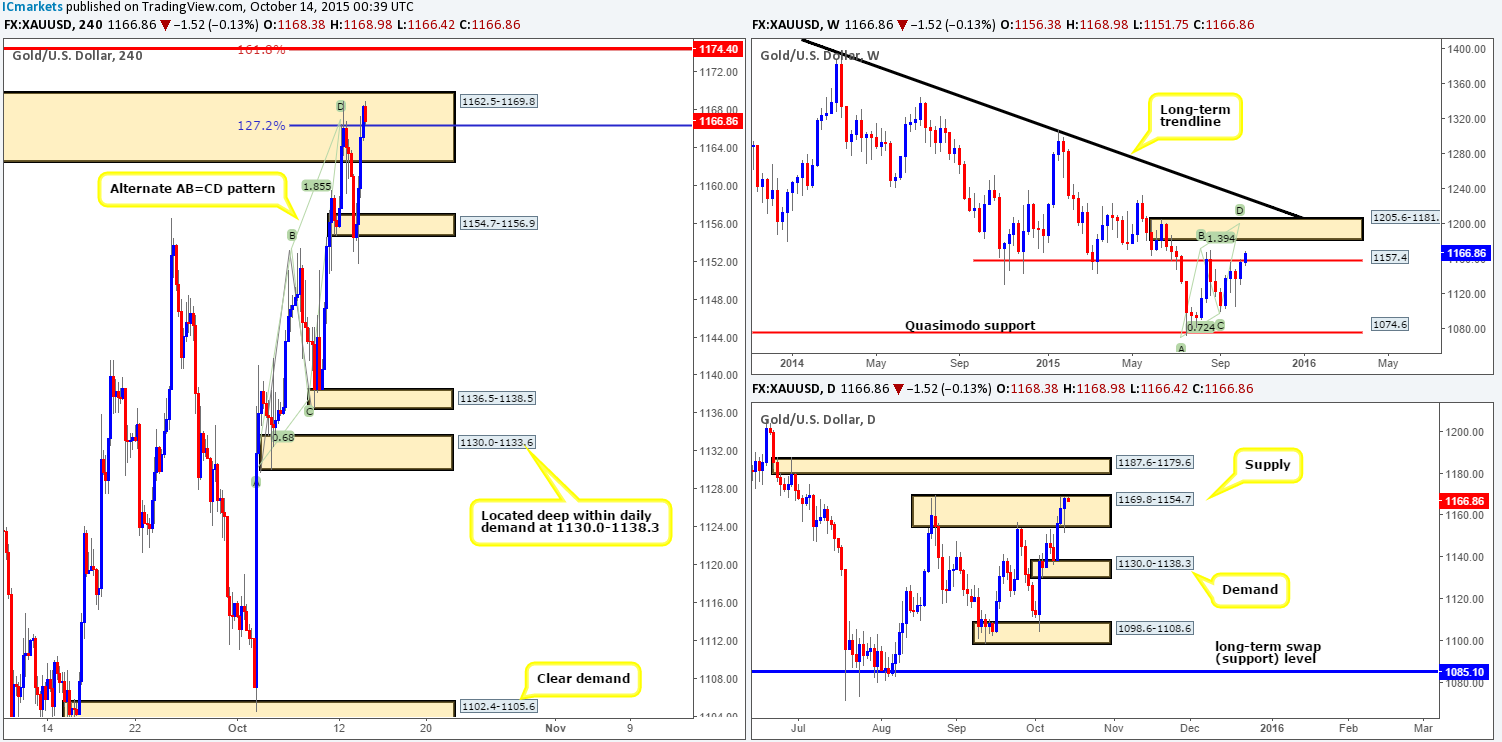
Starting with a quick look at the weekly chart this morning reveals that Gold is starting to show some upward muscle. In the event that price continues to trade above the current swap resistance level at 1157.4, we may see this market connect with supply at 1205.6-1181.2. This area, in our book, is a perfect zone to look for shorts. It not only converges with a bearish Harmonic AB=CD pattern (1199.4), but also with the underside of a long-term trendline extended from the high 1488.0. On top of this, daily action also shows supply at 1169.8-1154.7 is likely to going to cave in as price is trading so very close to the extreme of this zone at the moment. Should we see a push above here, the next limit to reach falls in around supply coming in at 1187.6-1179.6.
Turning our attention to the 4hr timeframe, Gold continued to sell-off beautifully in the early hours of trade yesterday from our alternate AB=CD reversal point at 1166.3. However, as you can see, this downside move was relatively short-lived. Price faked below demand at 1154.7-1156.9, and saw a heavy round of bids come in mid-way through London trade. This continued to push this market higher throughout the remainder of the day, consequently closing above the alternate AB=CD sell point.
With all three timeframe signaling buying strength at present, we see little reason why price will not continue advancing today up to at least the 4hr swap (resistance) level at 1174.4 (converges nicely with the 161.8% Fibonacci extension and is positioned just below daily supply mentioned above at 1187.6-1179.6). Unfortunately though, there is little support in this market to consider buys from today. The only zone we would be interested in buying from would be the recently faked demand at 1154.7-1156.9 (confirmation required) due to how aggressively price rallied from here! In the event of an immediate drive higher to 1174.4 today, nonetheless, this level may be good for a small confirmed short. We’re not expecting much more than this simply because daily supply at 1187.6-1179.6 is, as we mentioned above, positioned relatively close.
Levels to watch/ live orders:
- Buys:1154.7-1156.9[Tentative – confirmation required] (Stop loss: dependent on where one confirms this area).
- Sells:1174.4 [Tentative – confirmation required] (Stop loss: dependent on where one confirms this level).


