
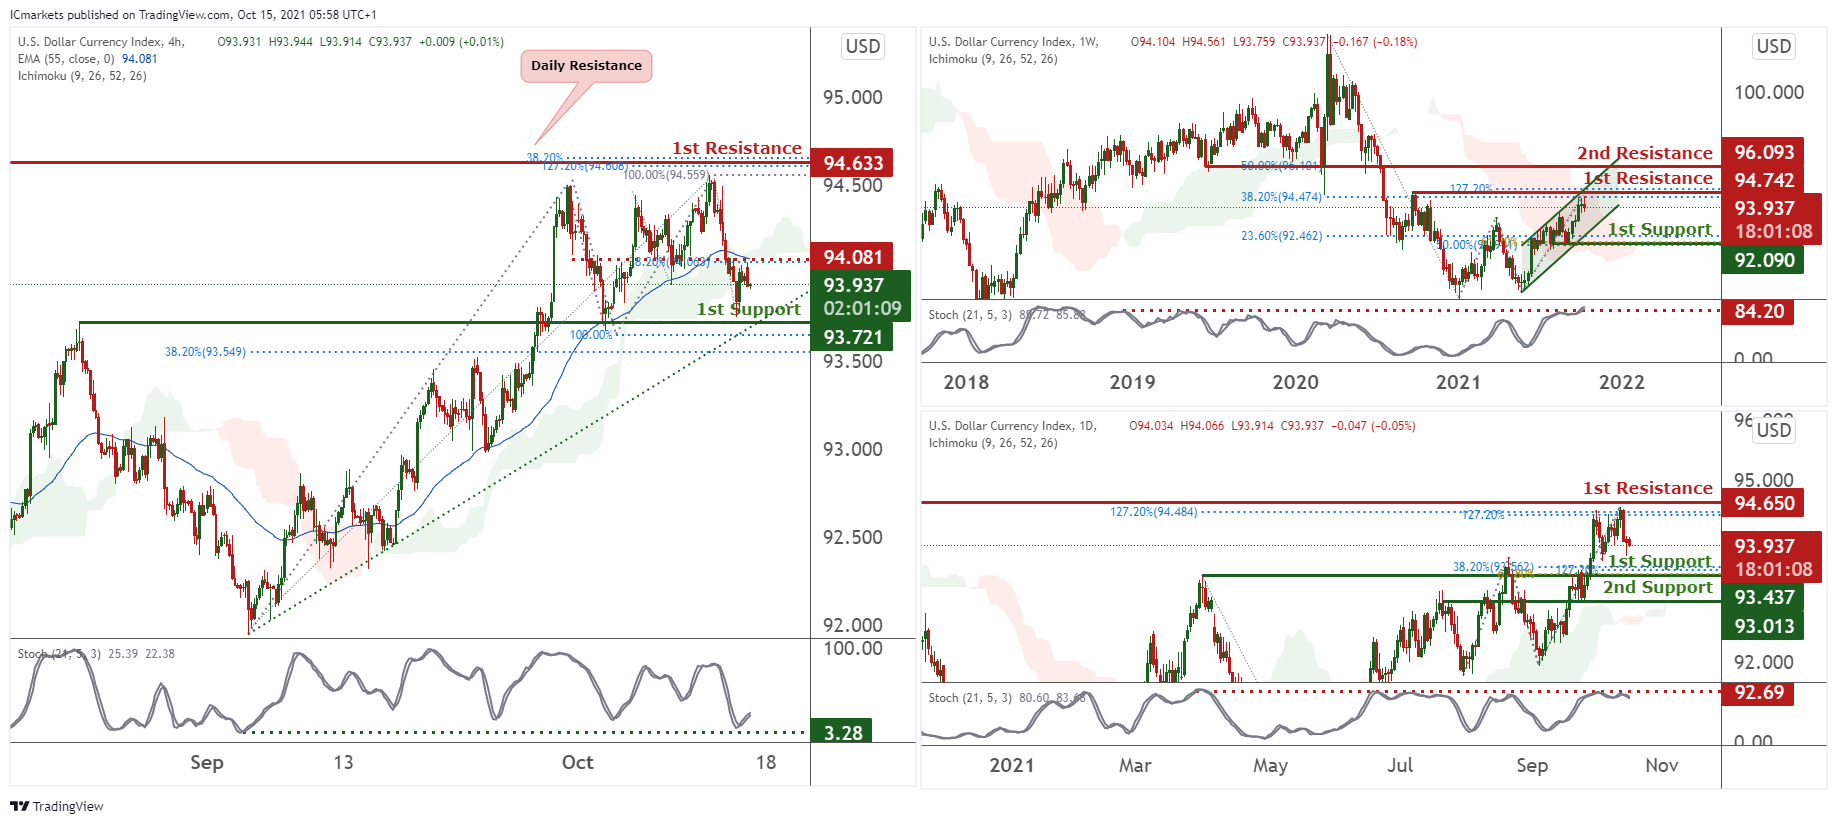
DXY:
On the weekly, prices have been consolidating in a parallel channel. Prices have the potential to experience a pullback from our 1st resistance at 94.742 in line in with our channel, 127.2% and 38.6% Fibonacci retracement towards our 1st support at 92.090 in line with 23.6%, 50% and 61.8% Fibonacci retracement. Technical indicators are showing bearish momentum.
On the daily, prices have recently tested our 1st resistance at 94.650 in line with 127.2% Fibonacci extension and are likely to dip further towards our 1st support at 93.437 in line with 38.2%, 61.8% and 127.2% Fibonacci extension. Stochastics are at a level where dips have previously occurred. Breaking our 1st support might find prices dipping towards our 2nd support at 93.437.
On the H4 timeframe, prices have recently tested our 1st support at 93.721 which is a graphical overlap and is testing our intermediate resistance at 94.081. We would expect a high probability of prices to be attracted to our 1st resistance which is an area of Fibonacci confluences and daily resistance. Technical indicators are showing bullish momentum. Alternatively, prices might dip further towards our ascending trendline and 1st support at 93.721 in line with 100% and 38.2% Fibonacci retracement.
Areas of consideration:
- H4 time frame,1st support at 93.721
- H4 time frame, 1st resistance at 94.633
- H4 time frame intermediate resistance at 94.081
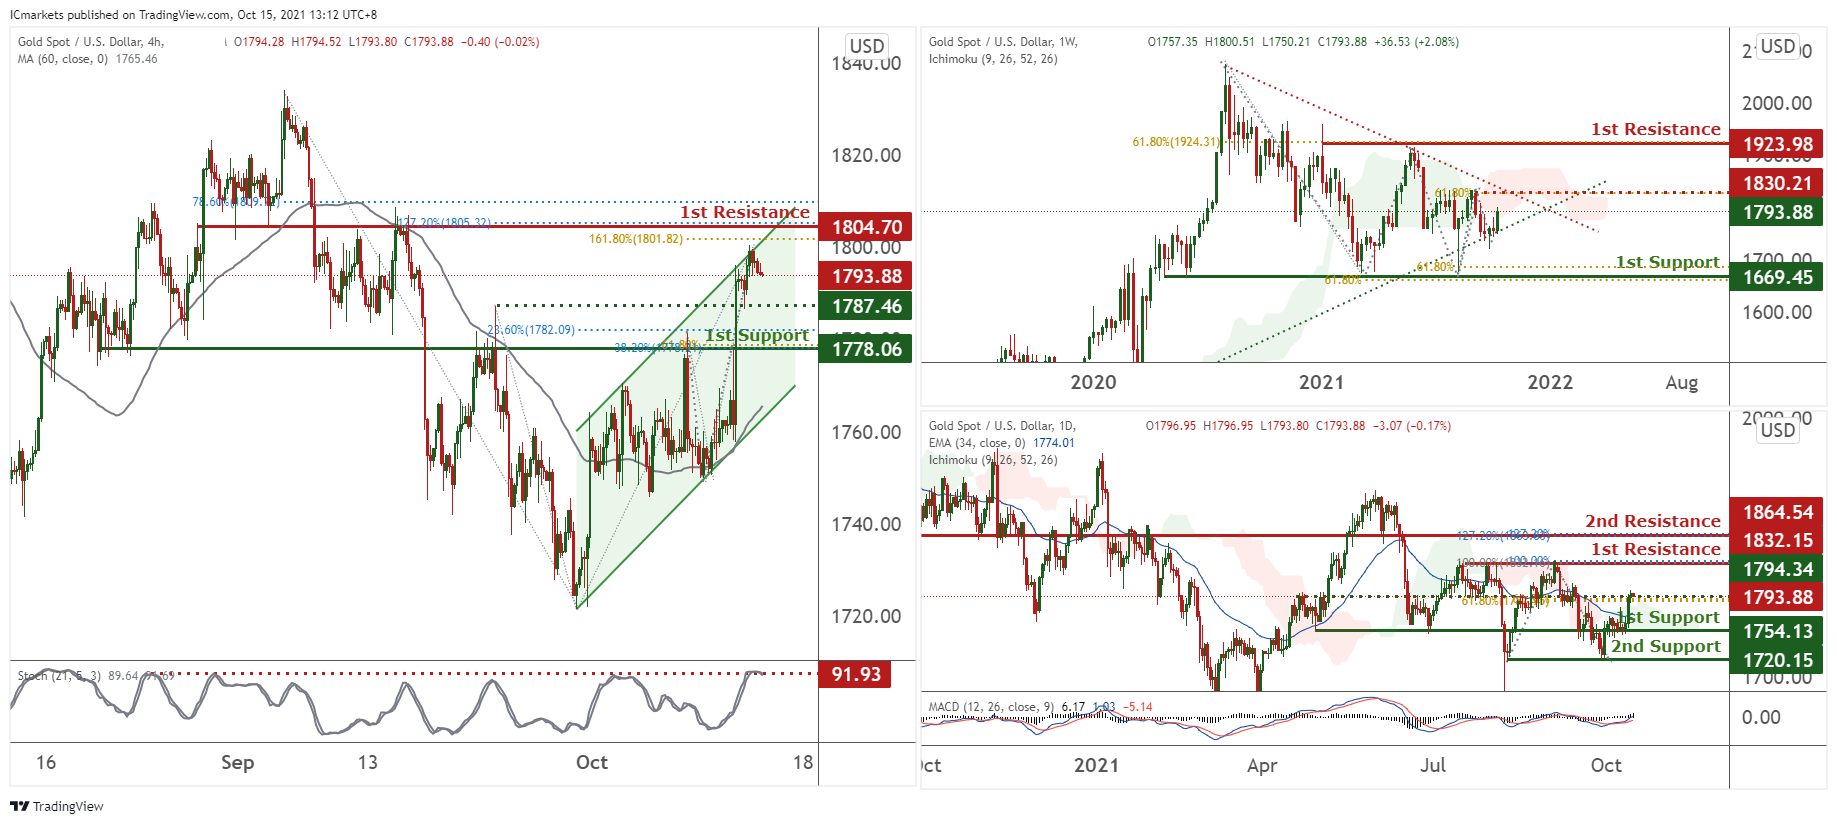
XAU/USD (GOLD):
On the weekly, prices are consolidating in a triangle. We see the potential of a bounce towards our intermediate resistance at 1830.21 in line with 61.8% Fibonacci retracement. Breaking through it would find prices going higher towards our 1st resistance at 1923.98 in line with 61.8% Fibonacci retracement. However, as indicators are showing mixed signals, we would remain neutral for now.
On the daily, we see the possibility of prices pushing higher if it surpasses our intermediate support at 1794.34 in line with 61.8% Fibonacci retracement towards our 1st resistance at 1832.15 in line with 100% Fibonacci extension. Technical indicators are showing bullish momentum.
On the H4 chart, prices appear to be consolidating in a parallel channel. Prices have recently tested the top of our parallel channel and we would expect a drop from our 1st resistance at 1804.70 in line with 161.8%, 127.2 Fibonacci extension and 78.6% Fibonacci retracement towards our 1st support at 1778.06 in line with 61.8%, 78.6% and 38.2% Fibonacci retracement. Stochastics are at a level where dips previously happened. Alternatively, we would watch our Intermediate support at 1787.46 which is a graphical overlap.
Areas of consideration:
- 4h 1st support at 1778.06
- 4h intermediate support at 1787.46
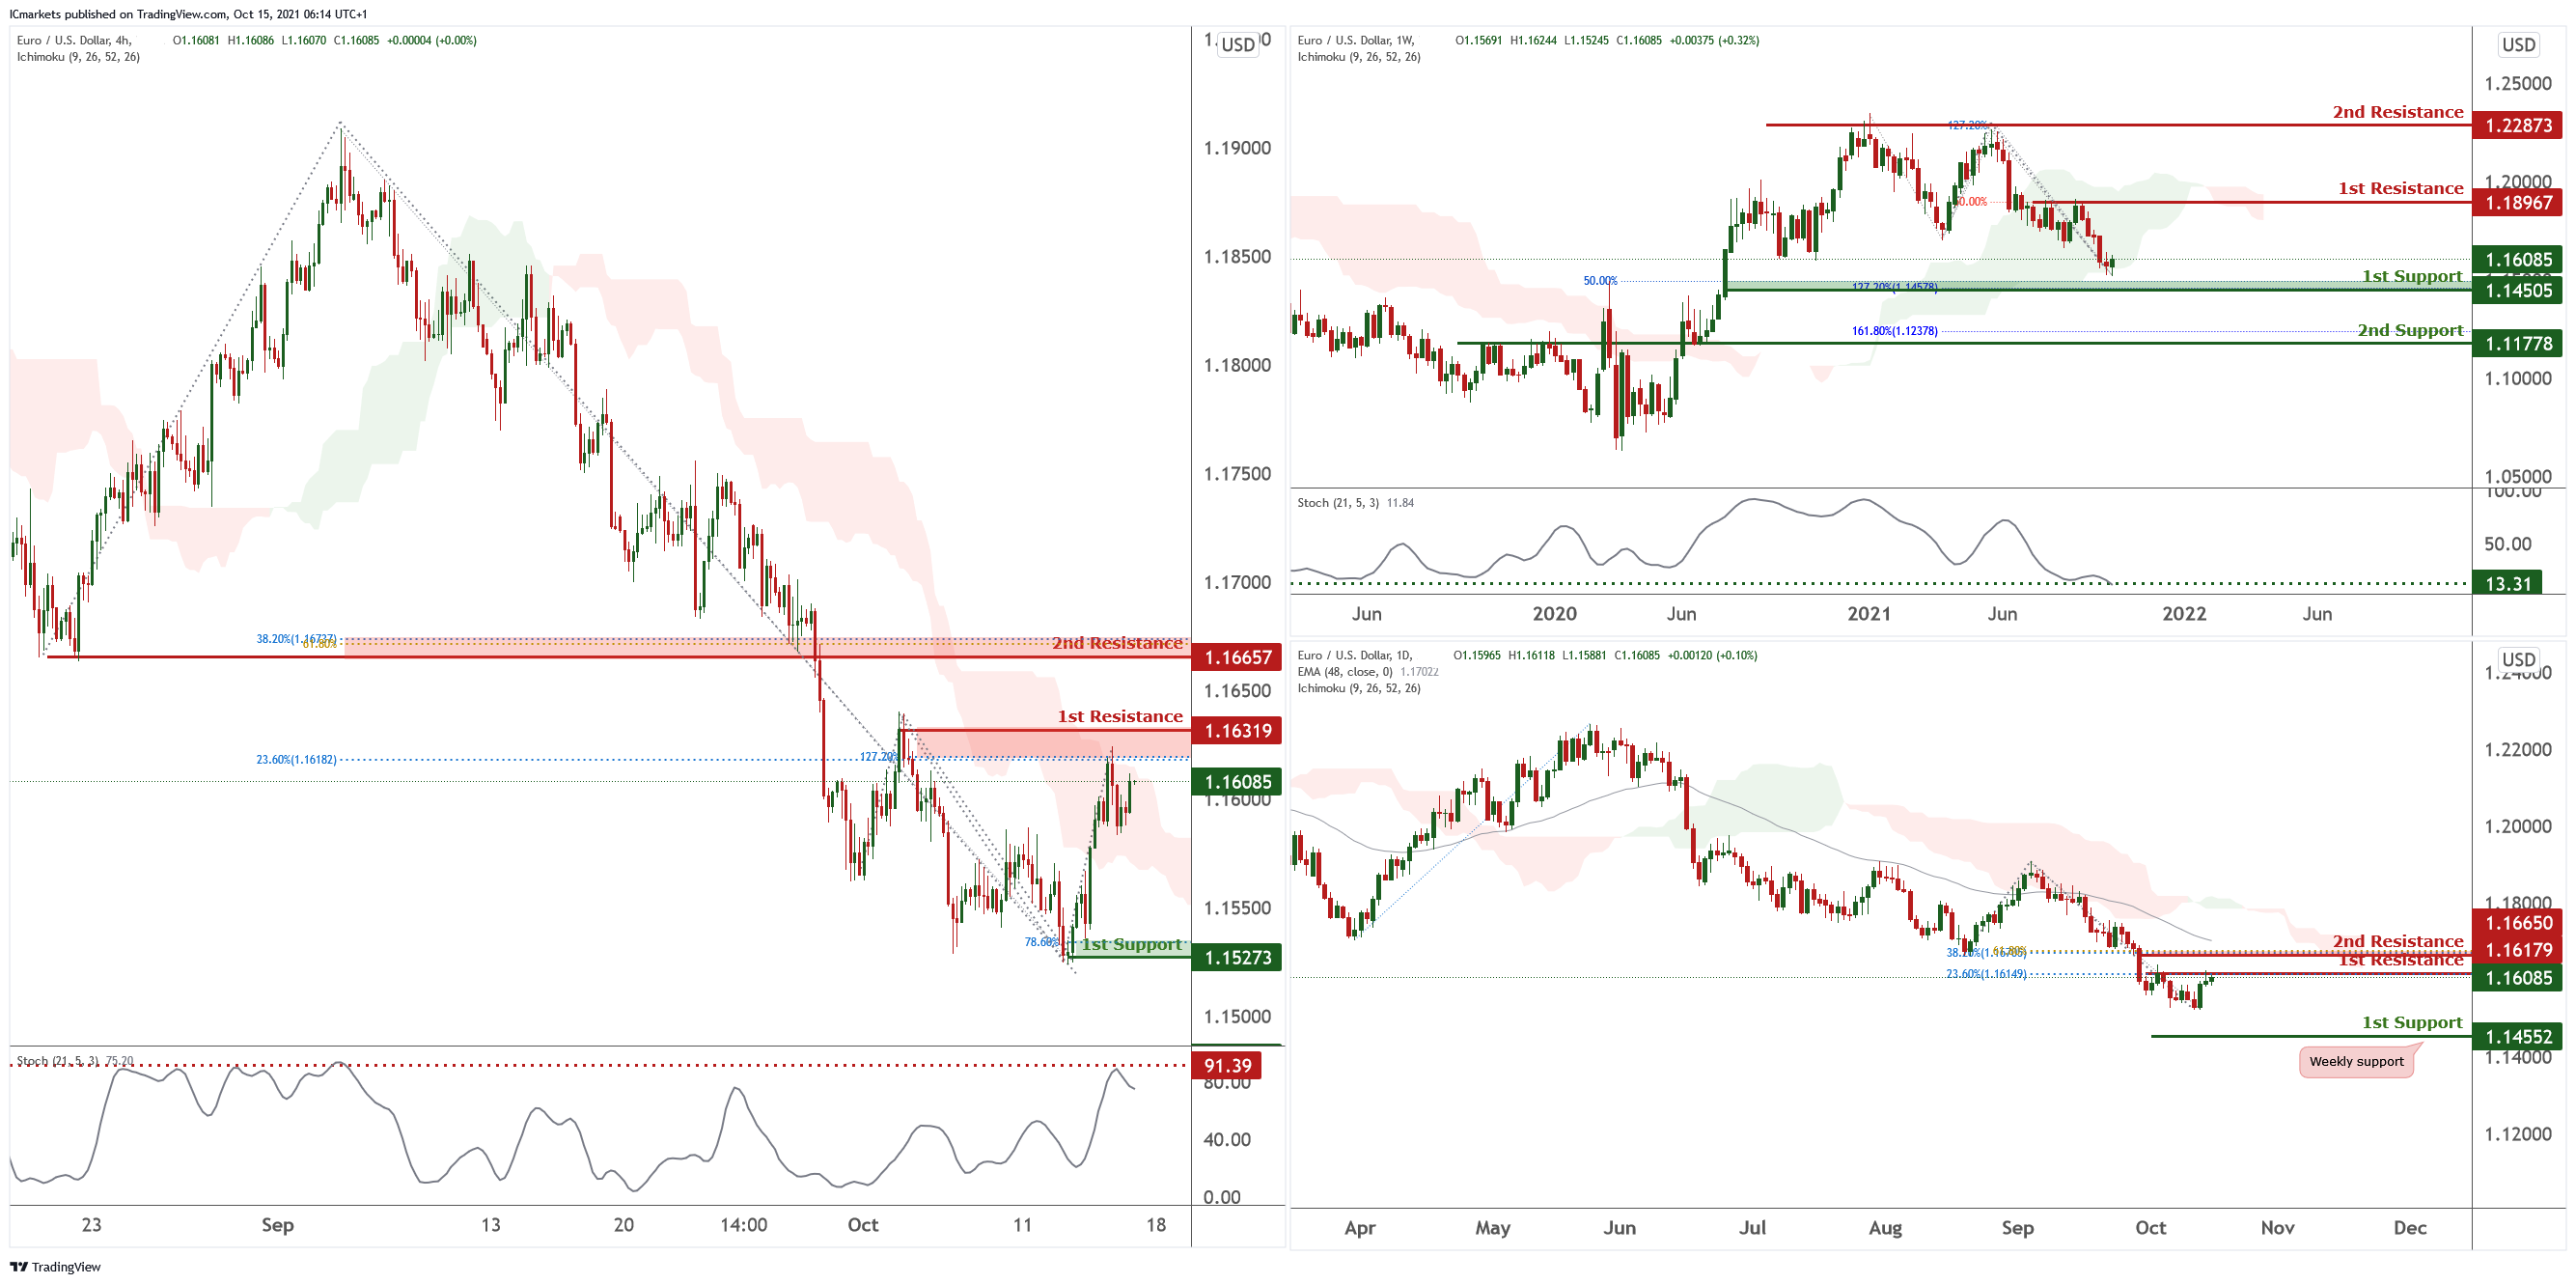
EUR/USD:
On the weekly timeframe , price is heading towards the first support level of 1.14505 which is also Fibonacci retracement level of 50% and Fibonacci projection level of 127%. Price can potentially bounce from the first support level to our first resistance level of 1.18967 which is our Fibonacci retracement level of 50%. Alternatively if price were to break our first support, it will continue to dip to the 2nd support level. Our bullish bias is supported by our stochastic indicator.
On the daily timeframe , price is currently trading near our first resistance level which is also Fibonacci retracement level 23.6%. Price can potentially fail to break the 1st resistance level and dip to its weekly support level of 1.14552. Our bearish bias is further supported by the ichimoku cloud indicator as price is trading below it.
On the 4 hour timeframe, price has recently reached near our first resistance level of 1.16319 and can potentially dip back to our first support level of 1.15273 which is also Fibonacci projection level of 78.6%. Our bearish bias is further supported by our ichimoku cloud indicator as price is trading under it.
Key considerations :
H4 first resistance – 1.16319
H4 first support – 1.15273
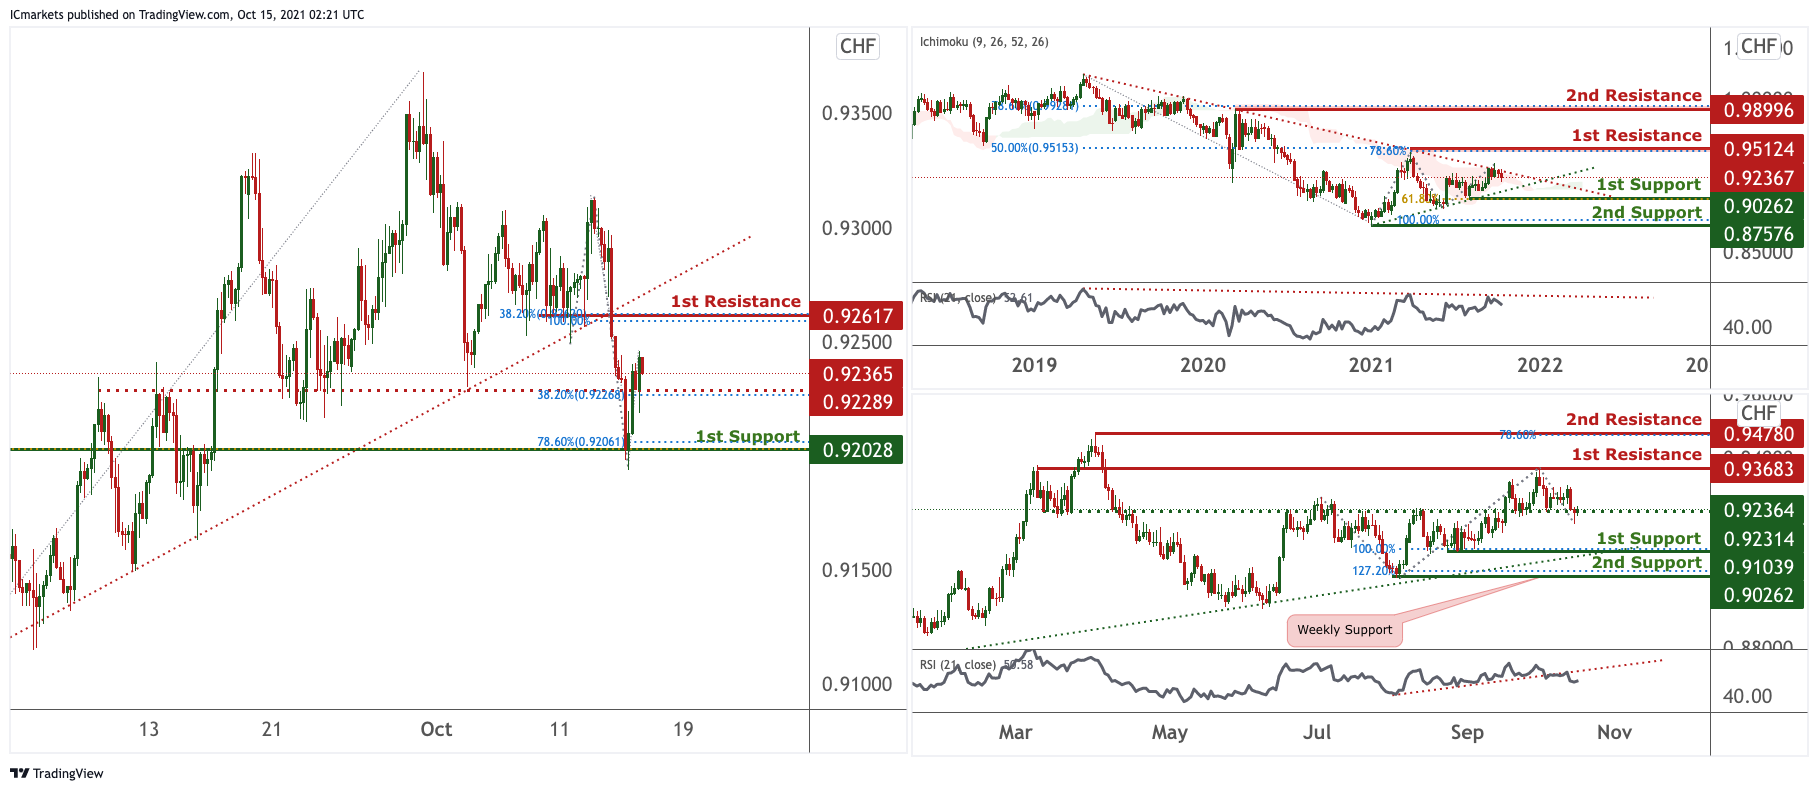
USD/CHF:
On the weekly, price is holding above ascending trendline support however, it is also at the descending trendline resistance, price might reverse back down and drop towards the ascending trendline support as there is also a strong Ichimoku cloud that might prevent the breakthrough of the resistance. Price is also between 1st resistance at 0.95124 and 1st support at 0.90262. Traders should watch these levels closely for a break to see prices swing higher or drop lower. On the Daily, price is seen to have a short-term bearish momentum approaching the ascending trendline support. We can expect the price to move towards the 1st support at 0.92314 in line with 100% Fibonacci Projection. With stochastics breaking out of the ascending trendline support (now resistance).
On the H4, price is seen to have broken past the ascending trendline support, signifying a bearish momentum. In reference to yesterday’s analysis, price did move to our targeting 1st Support ( 0.92028) from the 1st Resistance (0.92617). Price bounced at the 1st Support and broke past an intermediate resistance, we can expect price to continue to push to 1st Resistance and drop back down to the 1st Support in line with 78.6% Fibonacci retracement.
Areas of consideration:
- Watch 1st Support at 0.92028
- Watch 1st Resistance at 0.92617
GBP/USD:
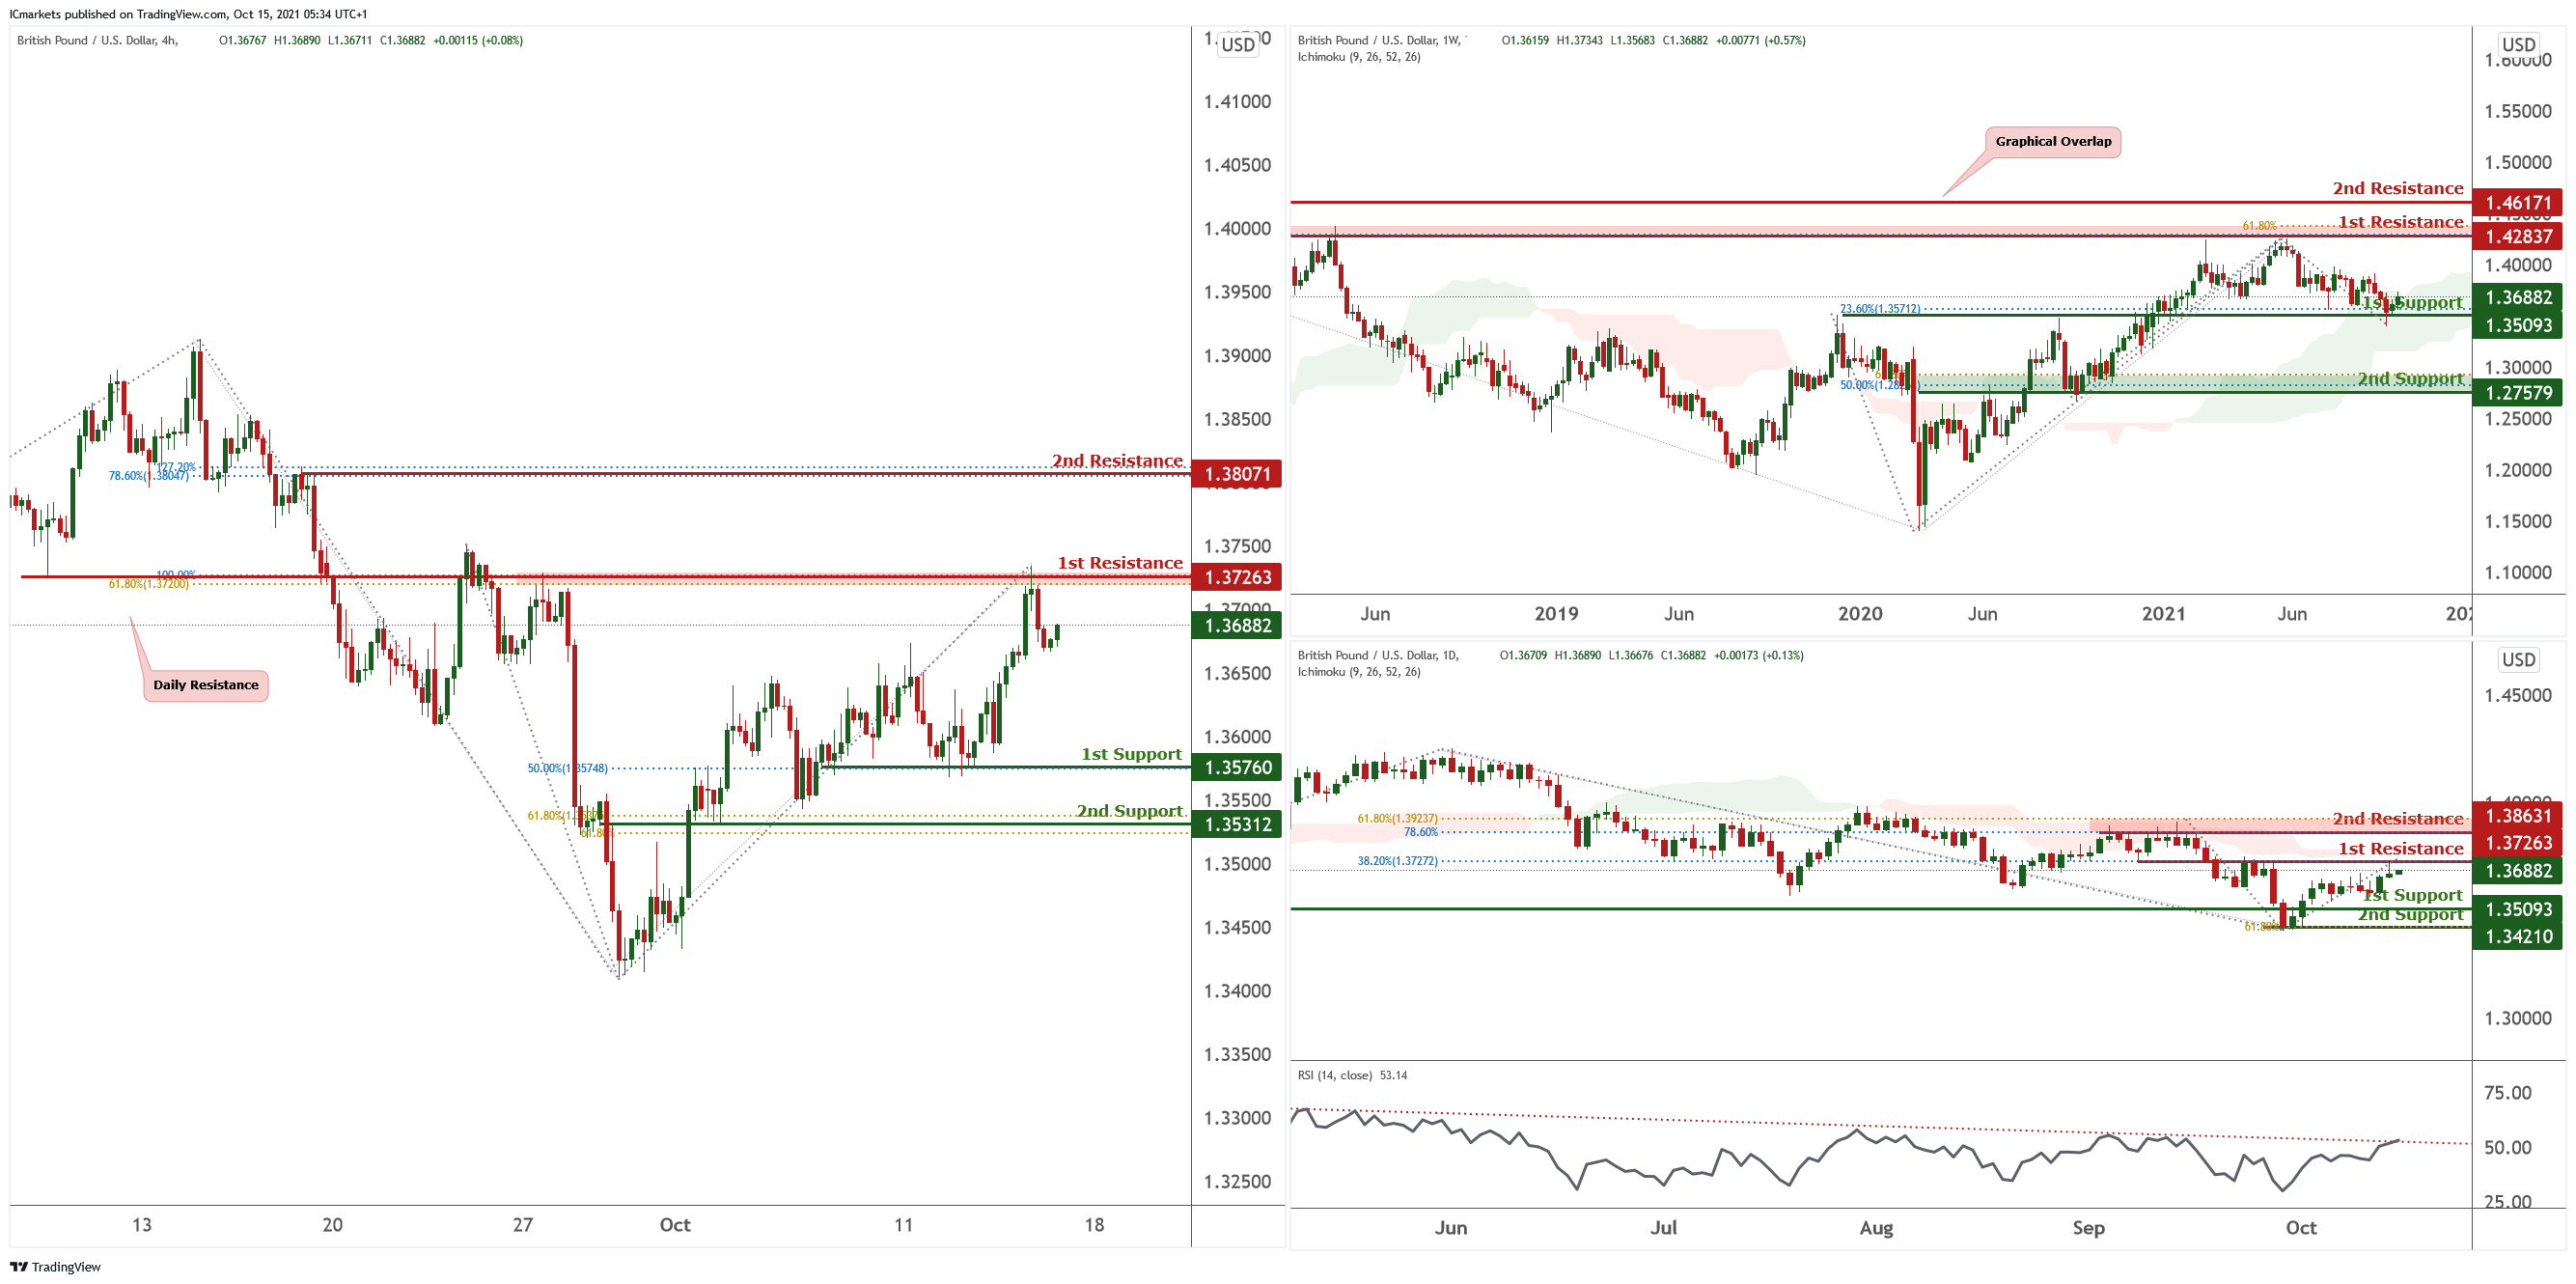
On the weekly time frame , we can see that price is near the first support level which is also our 23.6% retracement. Price can potentially bounce from the first support to our first resistance in line with horizontal swing high and also Fibonacci retracement of 50% and projection of 61.8%. Alternatively if price were to break our first support level, it can potentially dip to the 2nd support level which is also Fibonacci retracement of 50% and projection of 61.8%. Our bullish bias is supported by the Ichimoku cloud indicator as the price is trading above it.
On the daily timeframe, we can see that price is near our 1st resistance level which is also 38.2% Fibonacci retracement. Price can potentially react from the first level resistance level and dip to our first support of 1.35093. Our bearish bias is supported by the Ichimoku cloud indicator as price is trading below it.
On the 4hr time frame, price had recently reacted from our first resistance and is dipping to our first support of 1.35764 which is also 50% Fibonacci retracement.
Our bearish bias is supported by our stochastic as it is currently at resistance level.
Areas of consideration:
H4 first resistance – 1.37263
H4 first support – 1.35760
USD/JPY
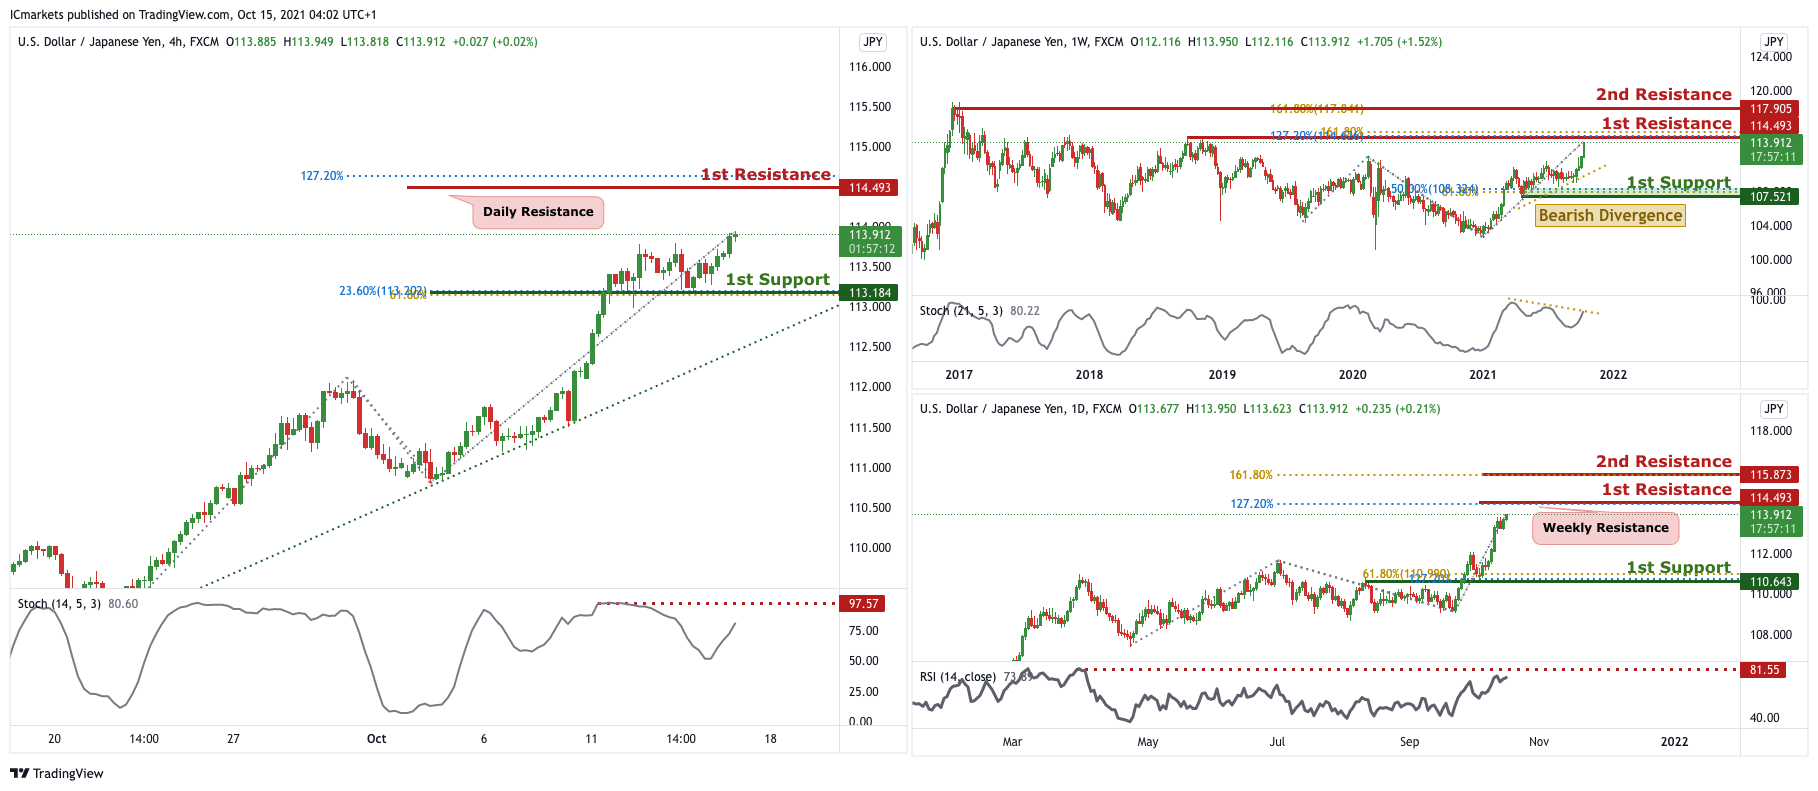
On the Weekly timeframe, we can see that price is approaching the 1st resistance in line with horizontal swing highs and 127.2% FIbonacci Retracement and 161.8% Fibonacci Projection. We can expect the price to drop from the 1st Resistance towards the 1st Support in line with 61.8% Fibonacci projection and 50% Fibonacci retracement. Our short-term bearish momentum is further supported by the stochastic %K line holding below the descending trendline resistance and bearish divergence spotted. On the Daily timeframe, we can expect price to be reversing at 1st Resistance in line with 127.2% Fibonacci projection and weekly resistance. We are expecting price to ouhs down to the 1st Support in line with 127.2% Fibonacci projection and 61.8% Fibonacci retracement. Our short-term bearish bias is further supported by the RSI indicator approaching the resistance level.
On the H4 timeframe, we can see that price is abiding by the ascending trendline and we are expecting price to push towards the 1st Resistance in line with 127.2% Fibonacci projection and daily resistance and drop towards the 1st support in line with 23.6% Fibonacci retracement and 61.8% Fibonacci Projection. Our short-term bearish bias is further supported by the stochastic indicator %K line where it is approaching the resistance level.
Areas of consideration:
- H4 1st resistance level 114.493
- H4 1st support level 113.184
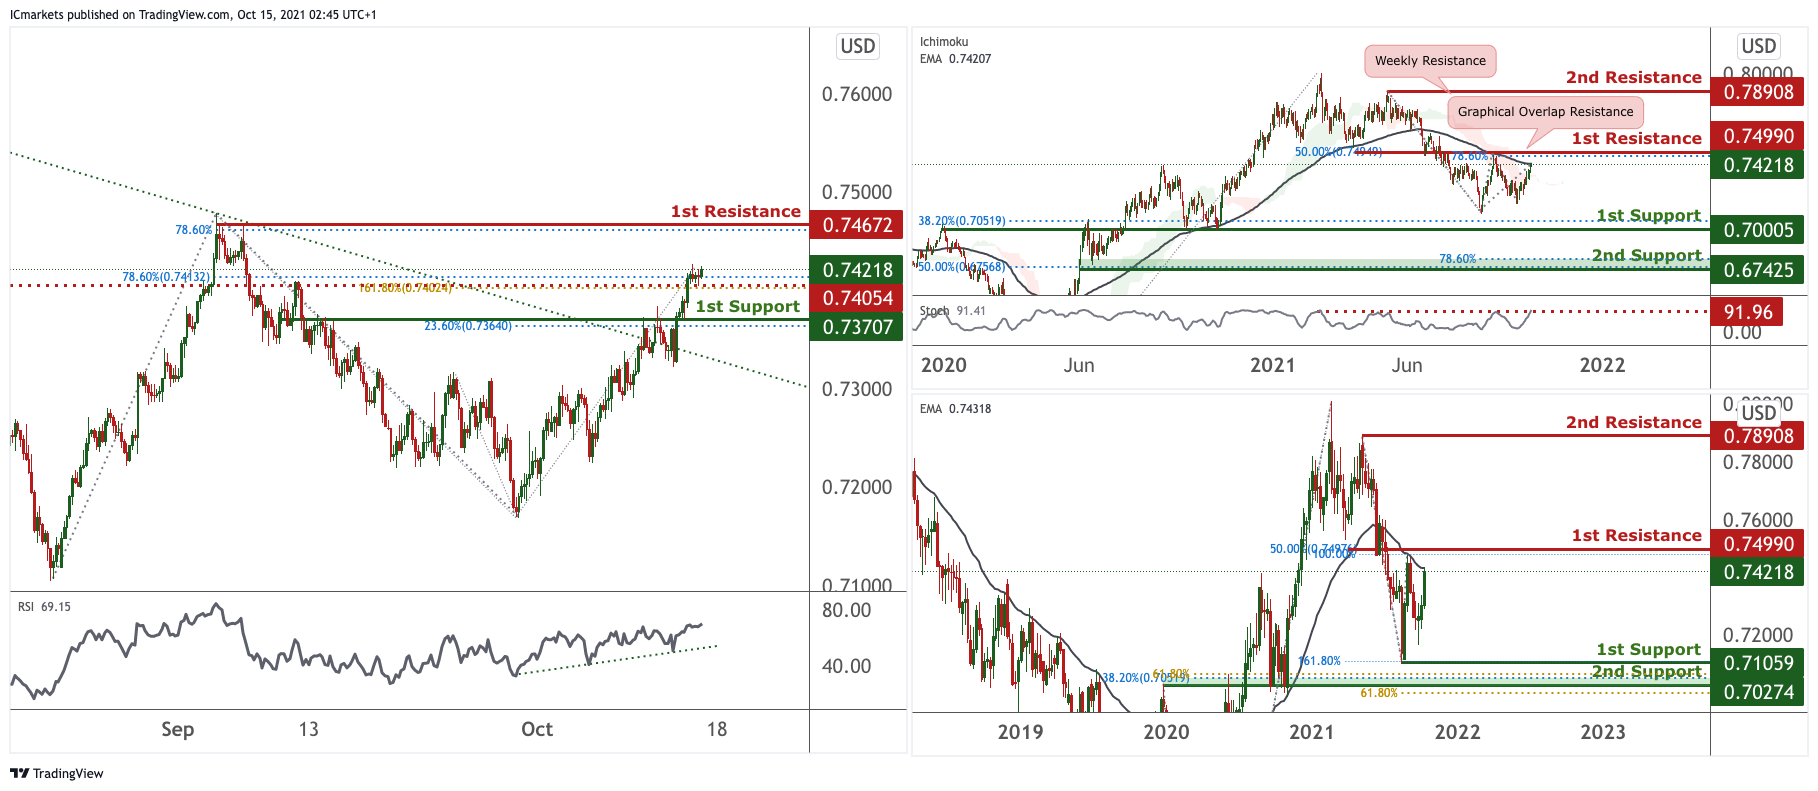
AUD/USD:
On the weekly, price is holding below the MA 130 showing bearish momentum, price is expected to push towards the first support in line with the 161.8% Fibonacci Projection level and previous swing low. On the Daily, the price is holding below EMA 34 showing a potential bearish momentum, price did make a short pullback from last week, we are expecting price to fall to 1st Support in line with 38.2% Fibonacci retracement. Our short-term bearish bias is further supported by the price holding below the 130 period EMA and below the Ichimoku cloud.
On the H4, price is seen to have broken out of the descending trendline resistance, signifying a bullish momentum. Prices have bounced off the 1st support, and broke past the intermediate resistance we were looking at, this shows a further upside confirmation. We can expect the price to push towards the 1st Resistance in line with the 78.6% Fibonacci projection. Our bullish bias is further supported by the RSI indicator abiding to the ascending trendline.
Areas of consideration:
- H4 1st resistance level 0.74672
- H4 1st support level 0.73707
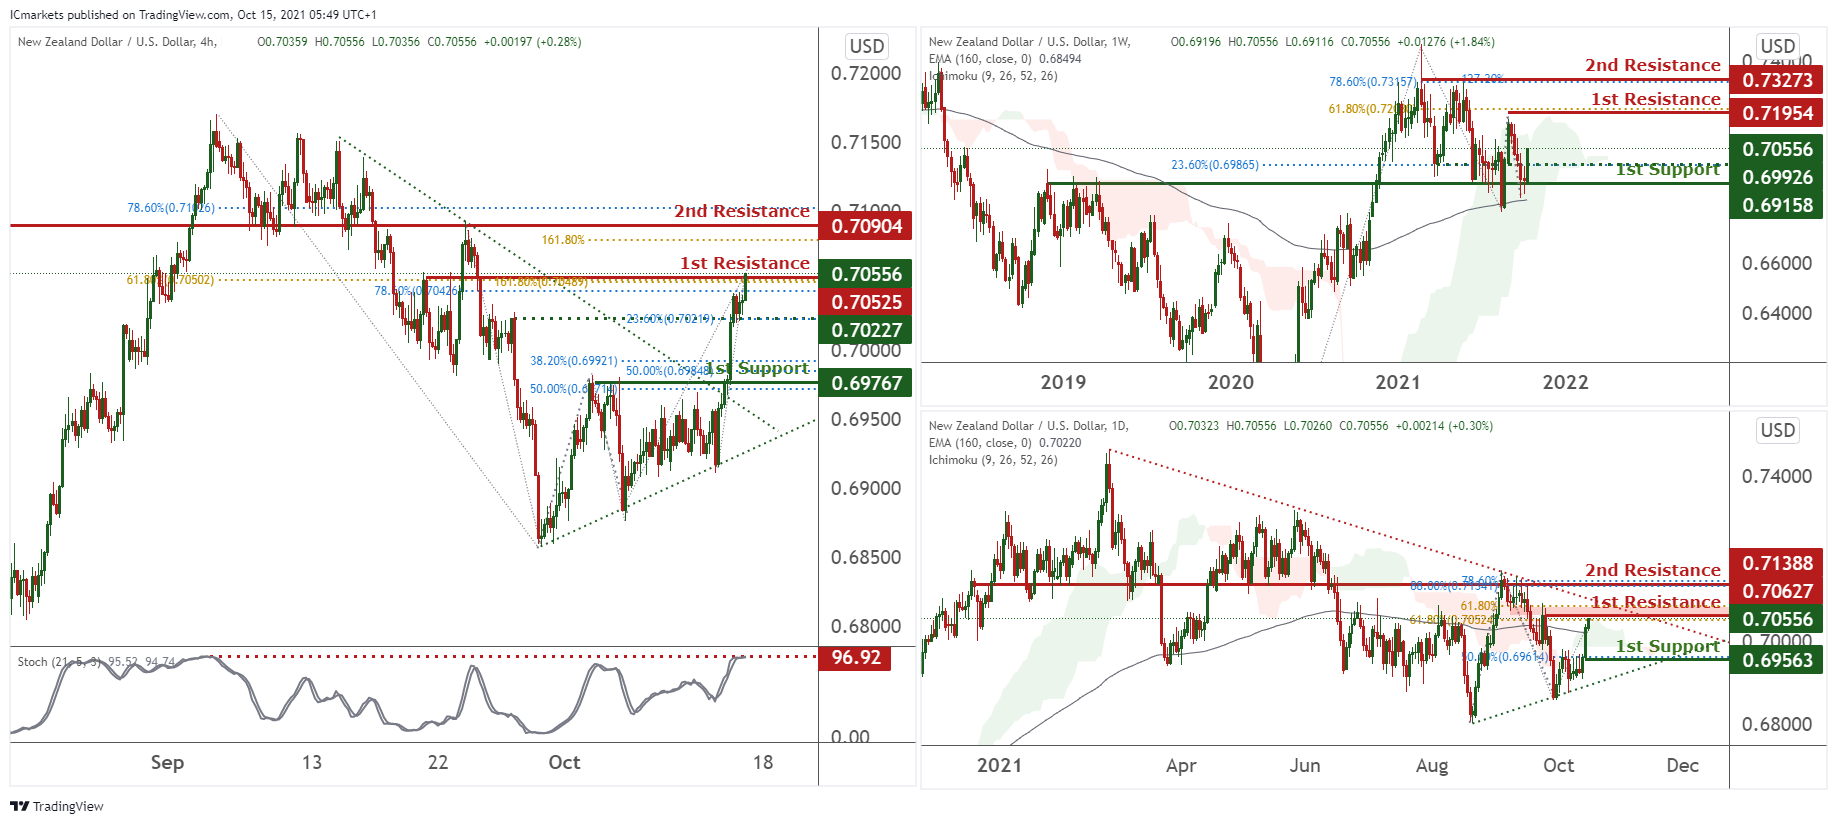
NZD/USD:
On the weekly, NZDUSD is on a bullish momentum. Prices have recently bounced off 1st support at 0.69926 in line with 23.6% Fibonacci retracement and graphical overlap towards our 1st resistance at 0.71954 in line with 61.8% Fibonacci retracement and graphical swing high. Technical indicators are showing bullish momentum.
On the daily, prices are consolidating in a triangle. We see the possibility of prices bouncing towards our 1st support at 0.69563 in line with 61.8% Fibonacci retracement. Alternatively, breaking our 1st resistance will find prices climbing higher towards our 2nd resistance at 0.71388 which is an area of Fibonacci confluences.
On the H4 timeframe, price has broken out of our triangle and appears to be on a bullish momentum. Prices have the potential to reverse at our 1st resistance at 0.70556 which is an area of Fibonacci confluences towards our intermediate support 0.70227 in line with 23.6% Fibonacci retracement. Stochastics are at a level where dips occurred previously. Alternatively, prices may climb higher towards our 2nd resistance at 0.70904 which is a graphical overlap.
Areas of consideration:
- H4 time frame, 1st support at 0.
- H4 time frame, 1st resistance at 0.70556
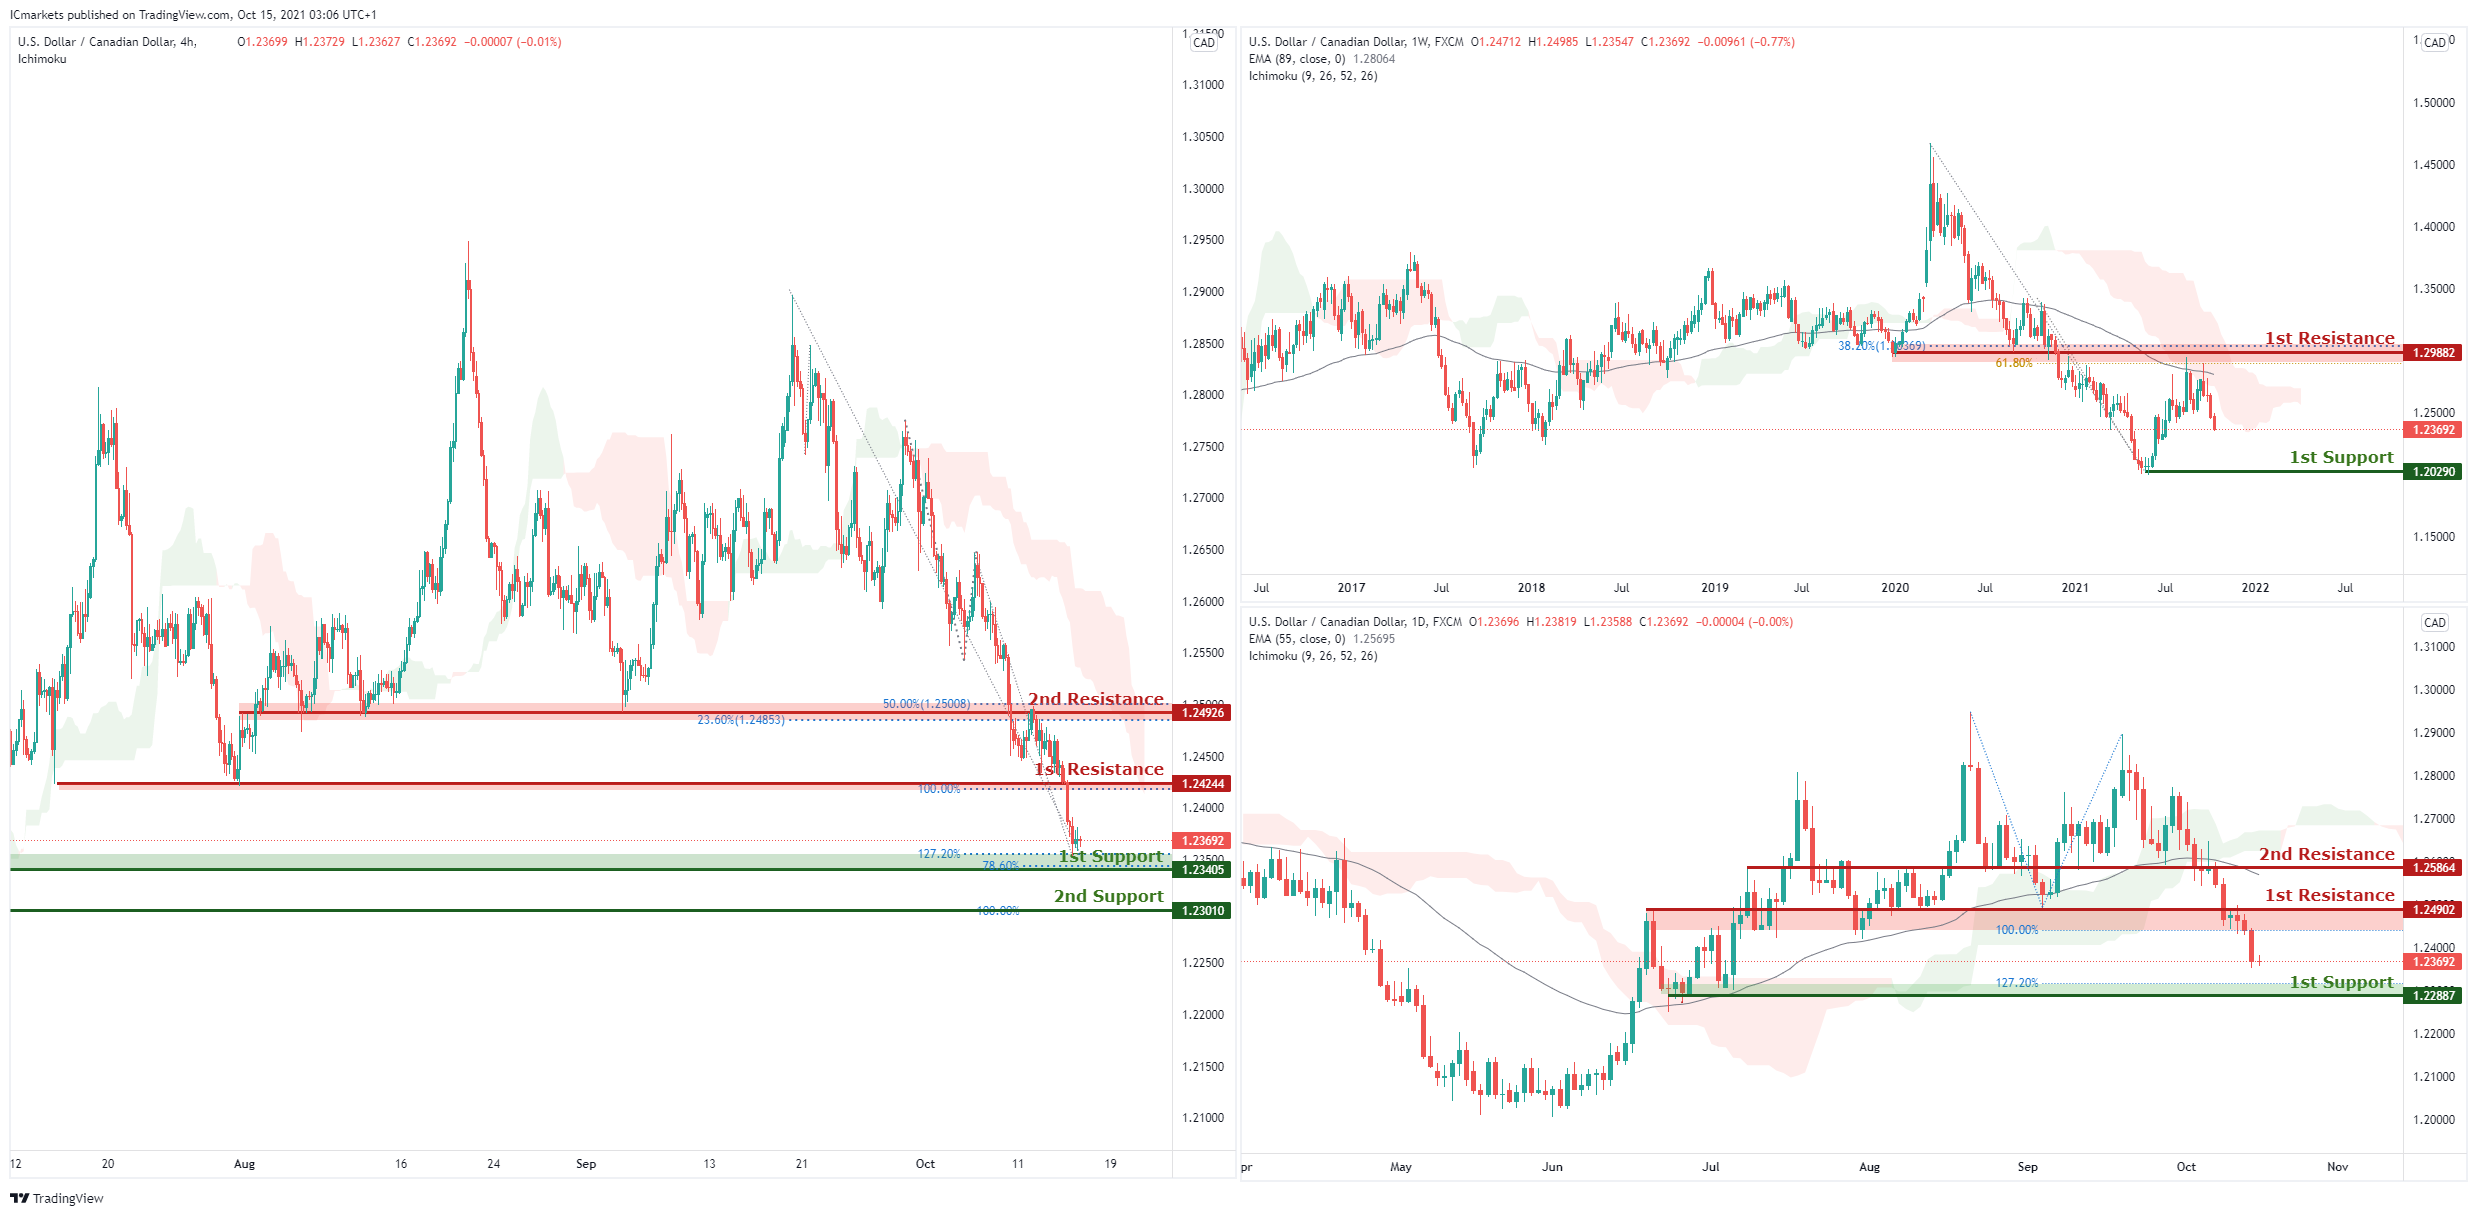
USD/CAD:
On the Weekly timeframe, price tested and reacted below long term moving average and the ichimoku cloud in line with both 38.2% and 61.8% Fibonacci retracement level at 1.29882. As long as the price is holding below this level, we could potentially see the price facing further bearish pressure in the long term or at least to 1st support at 1.2029.
On the Daily, price gone below our moving average and may continue a bearish momentum to 1st support at 1.22887 in line with the 127% Fibonacci extension Otherwise, price may push higher towards 1st resistance at 1.24902 in line with the 100% Fibonacci projection level before heading down to 1st support. Our bearish bias is further supported by price moving below ichimoku cloud.
On the H4, we can see price approaching 1st support at 1.23405 in line with the 127.2% Fibonacci extension and 78.6% Fibonacci retracement. With the existing bearish sentiment where price is moving below the ichimoku and in a downwards trend, we may expect to see price break 1st support structure and head for 2nd support at 1.23405 in line with the 100% Fibonacci projection level. Alternatively, Price may just do a bullish bounce back to 1st resistance at 1.24244.
Areas of consideration:
- H4 time frame, support at 23405
- H4 time frame, resistance at 24244
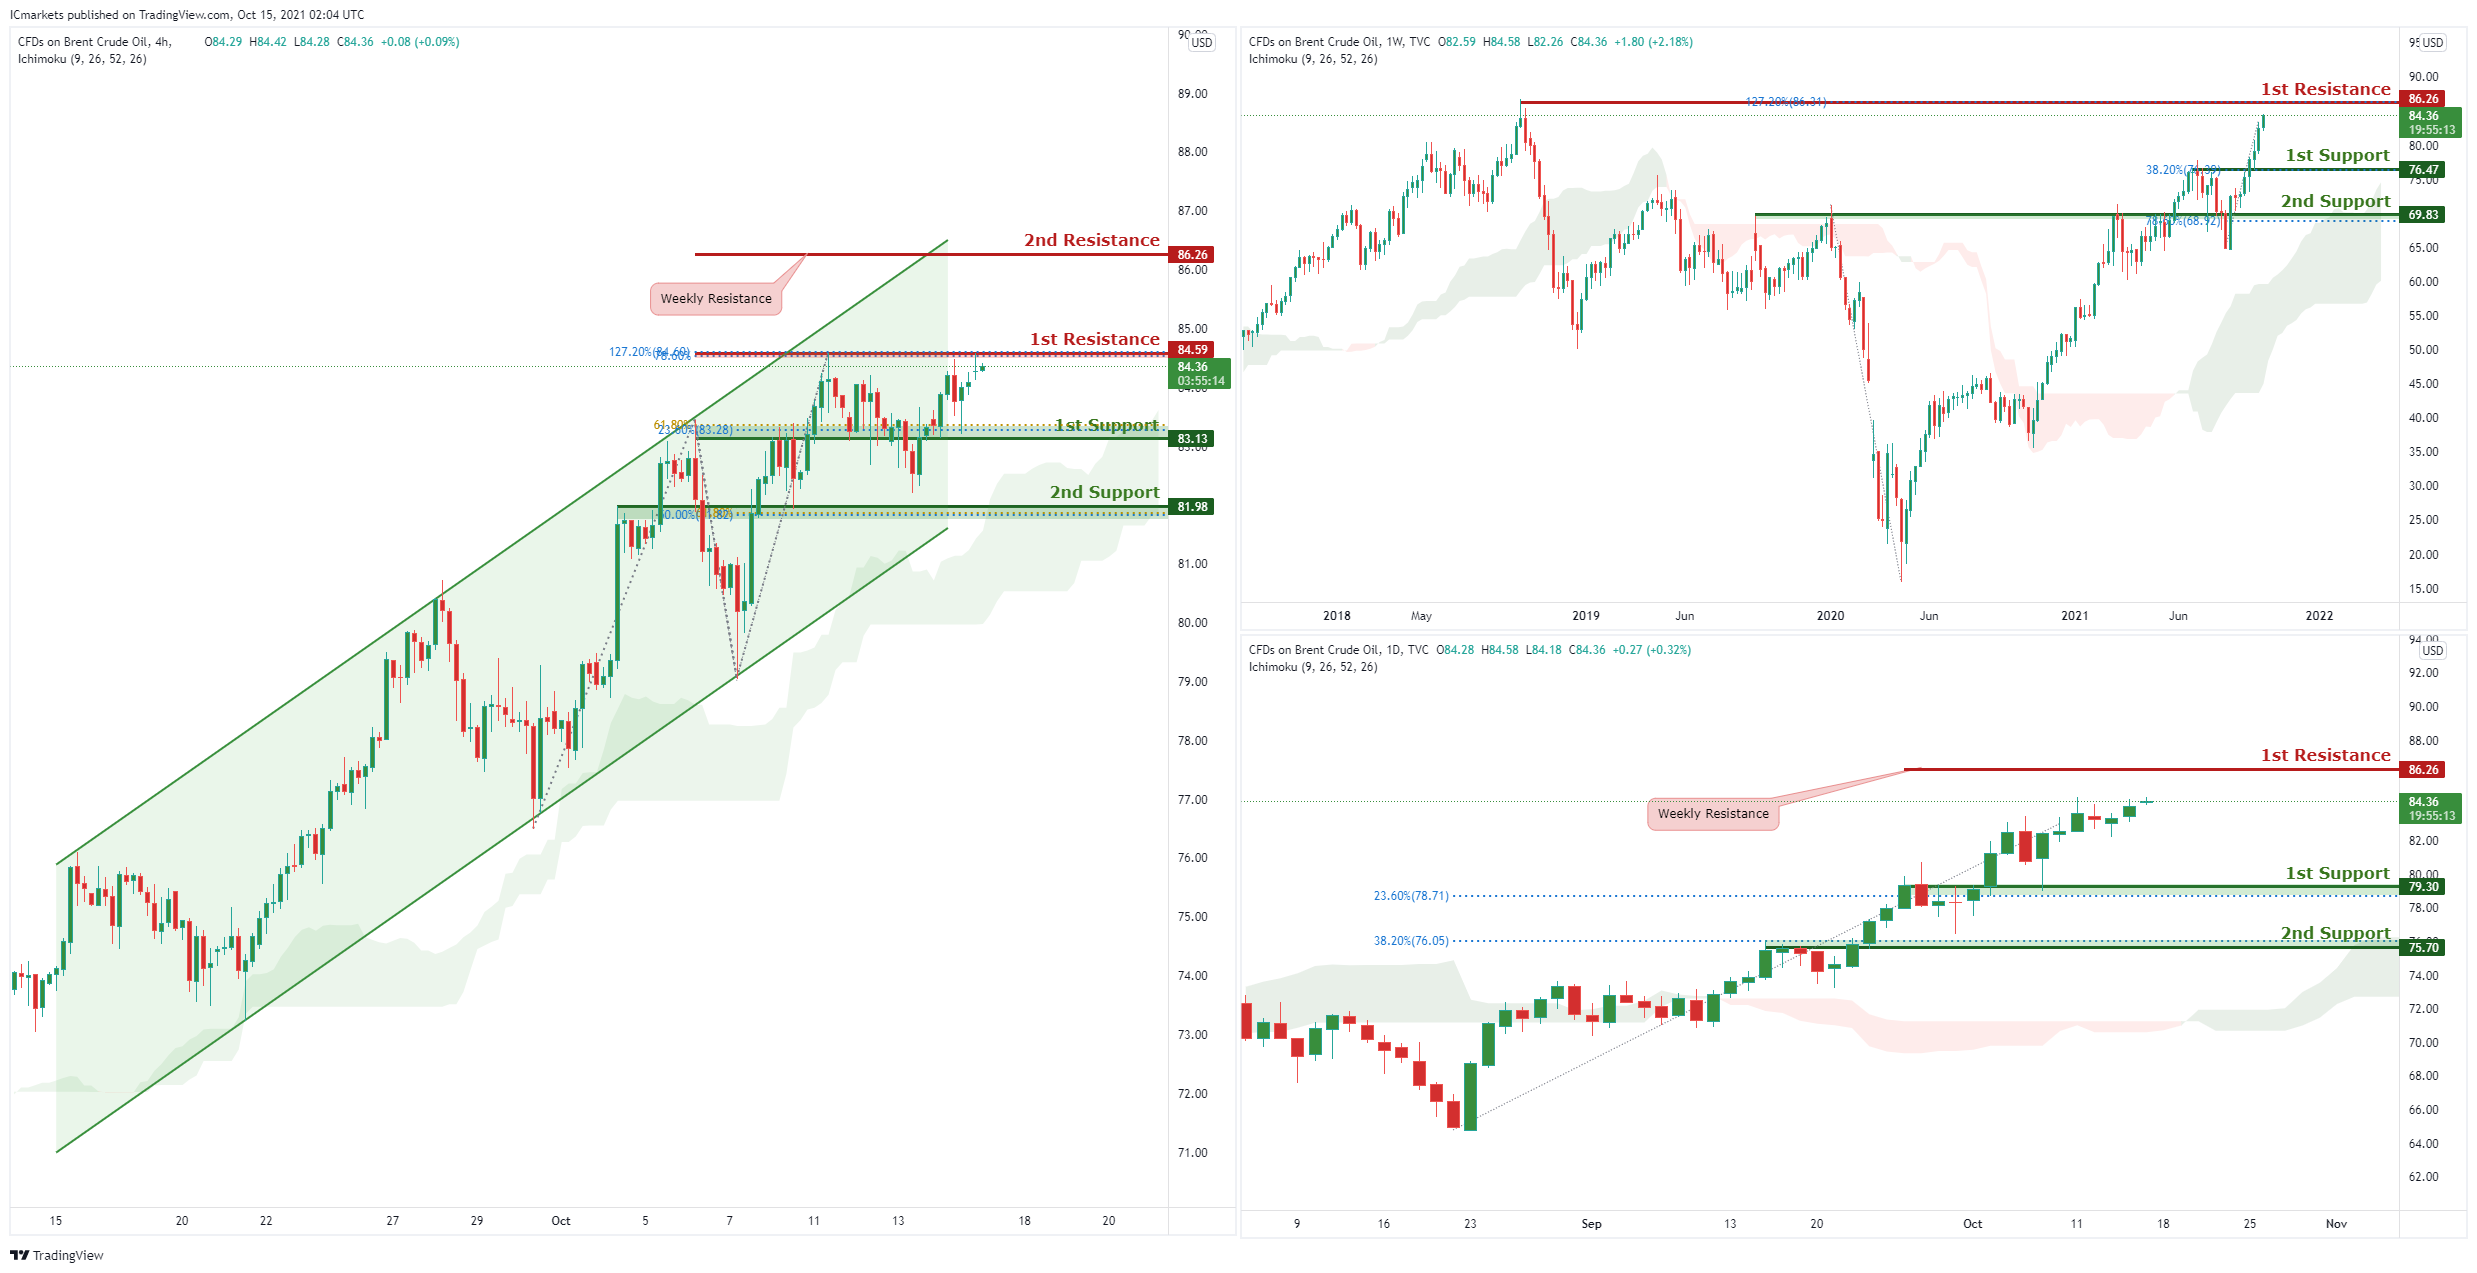
OIL:
On Weekly timeframe, we are likely to see price move further up to the 1st resistance at 86.26 in line with the 127.2% Fibonacci retracement. Otherwise it may head to 1st support first at 76.47 before heading to 1st resistance where the last swing high turned support is at. Our bullish bias can be supported by the ichimoku indicator and the existing upwards trend.
On the Daily timeframe, we are likely to see price move further up to the 1st resistance at 86.26 in line with the 127.2% Fibonacci retracement as well. This is in line with the weekly. Otherwise it may head to 1st support first aty 79.30 before heading to 1st resistance where the last swing high on the weekly was at. Our bullish bias can be supported by the ichimoku indicator.
On the H4 timeframe, with a bullish bias which is supported by the ichimoku indicator and the ascending channel, we may see price break structure at 1st resistance in line with 127.2% Fibonacci extension and the 78,6% Fibonacci retracement and head to 2nd resistance which is also a weekly and daily resistance. Alternatively, we may see price head for 1st support at 83.13 in line with the 61.8% Fibonacci projection and 23.6% Fibonacci retracement level before continuing its upwards trend.
Areas of consideration:
- H4 time frame, 1st resistance of 84.59
- H4 time frame, 1st support of 83.13
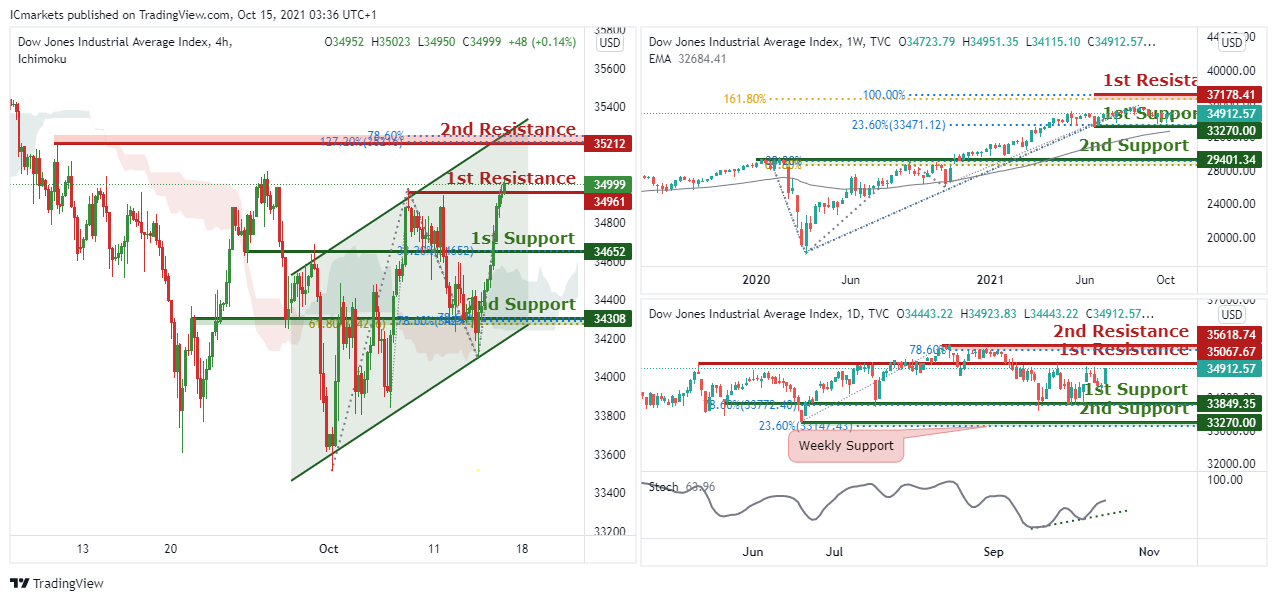
Dow Jones Industrial Average:
On the Weekly, price has been trading sideways between our 1st resistance at 37770 and 1st support at 35610.57. As there are no good risk reward levels, we prefer to remain neutral at this current juncture.
On the Daily chart, similar to the weekly, price is now trading between 1st resistance at 35067 which is a horizontal overlap resistance and 1st support at 33849 in line with the 78.6% Fibonacci retracement level. With technical indicators showing room for further bullish momentum, a limited rise towards 1st resistance could be likely. Otherwise, Price may even break 1st support and drop towards 2nd support at 33270.
On the H4, with a bullish bias, as price has already broken our intermediary resistance at 1st resistance at 34997 which is the last horizontal swing high resistance, we expect price to make a continuation to 1st resistance at 345212 in line with the 127.2% and 78.6% Fibonacci projection. Otherwise, we may see price head back down to 1st support at 34652 in line with the 38.2% Fibonacci retracement. Our bullish bias is supported by the ichimoku where price is moving above it along with the existing ascending channel.
Areas of consideration:
- 4H resistance at 34998
- 4H support at 34652
The accuracy, completeness and timeliness of the information contained on this site cannot be guaranteed. IC Markets does not warranty, guarantee or make any representations, or assume any liability regarding financial results based on the use of the information in the site.
News, views, opinions, recommendations and other information obtained from sources outside of www.icmarkets.com.au, used in this site are believed to be reliable, but we cannot guarantee their accuracy or completeness. All such information is subject to change at any time without notice. IC Markets assumes no responsibility for the content of any linked site.
The fact that such links may exist does not indicate approval or endorsement of any material contained on any linked site. IC Markets is not liable for any harm caused by the transmission, through accessing the services or information on this site, of a computer virus, or other computer code or programming device that might be used to access, delete, damage, disable, disrupt or otherwise impede in any manner, the operation of the site or of any user’s software, hardware, data or property.


