
A note on lower timeframe confirming price action…
Waiting for lower timeframe confirmation is our main tool to confirm strength within higher timeframe zones, and has really been the key to our trading success. It takes a little time to understand the subtle nuances, however, as each trade is never the same, but once you master the rhythm so to speak, you will be saved from countless unnecessary losing trades. The following is a list of what we look for:
- A break/retest of supply or demand dependent on which way you’re trading.
- A trendline break/retest.
- Buying/selling tails – essentially we look for a cluster of very obvious spikes off of lower timeframe support and resistance levels within the higher timeframe zone.
- Candlestick patterns. We tend to only stick with pin bars and engulfing bars as these have proven to be the most effective.
For us, lower timeframe confirmation starts on the M15 and finishes up on the H1, since most of our higher timeframe areas begin with the H4.
EUR/USD:
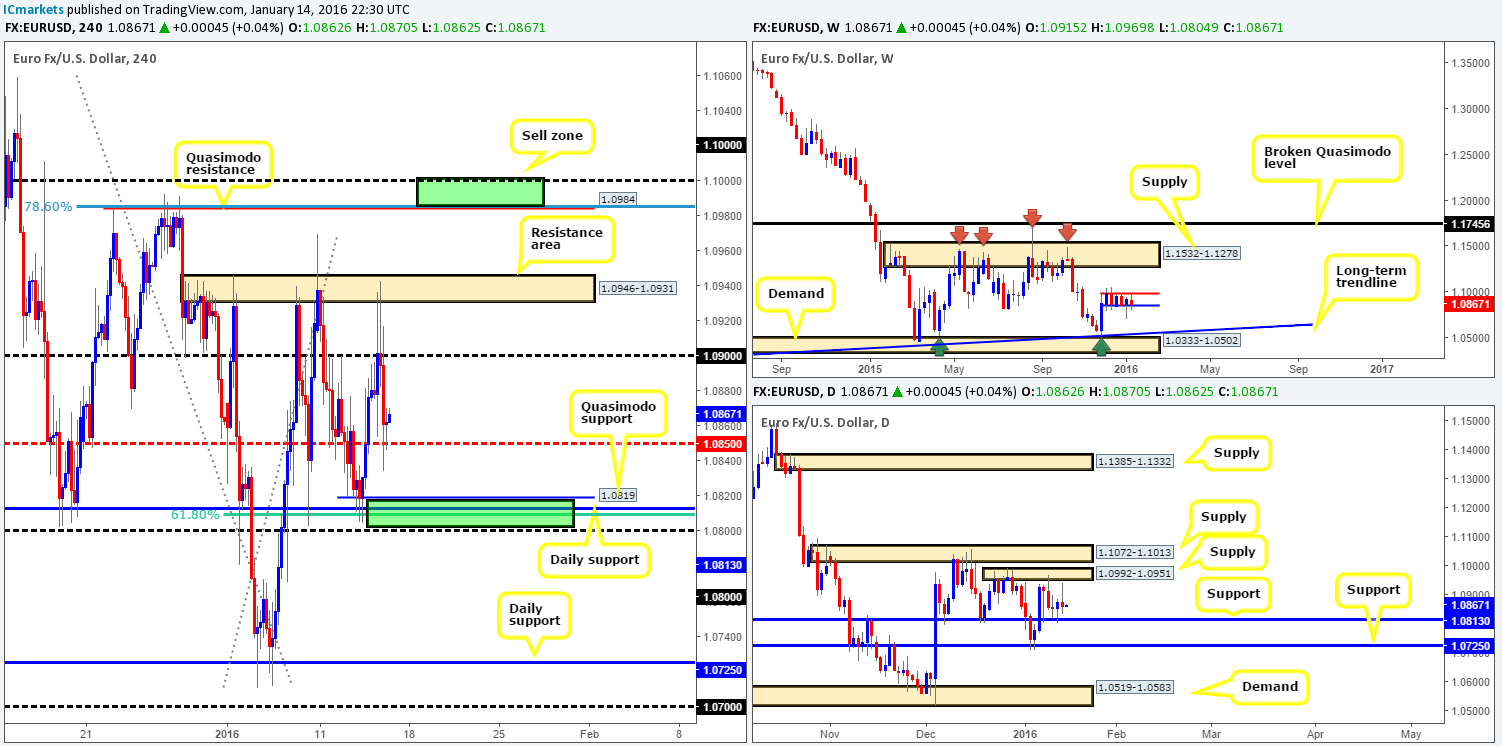
In our previous report (http://www.icmarkets.com/blog/thursday-14th-january-all-eyes-on-cable-and-the-u-s-dollar-from-midday-onwards-today-remain-vigilant/), we spoke regarding our current long position from 1.08153. 50% of the position had already been liquidated at mid-level resistance 1.0850, and a further 25% has now been taken off at the psychological resistance 1.0900. The final Take-profit zone is set at the H4 Quasimodo level drawn from 1.0984.
As you can see, yesterday’s trading was relatively volatile. As London opened its doors for business, price drove into 1.0900 and whipsawed through this number up to a H4 resistance area at 1.0946-1.0931 on two occasions before collapsing down to mid-level support 1.0850 by the day’s end. Despite this recent volatility, our outlook for this pair remains pretty much the same…
The only difference is our original buy zone between 1.0813 (daily support)/1.0800 (along with a 61.8% Fibonacci level at 1.0808) has now been expanded due to the H4 Quasimodo support forming at 1.0819. Should this barrier see action once again this week, we would, dependent on how the lower timeframes behaved here and the time of day, look to add another position long here. With regards to sells, however, we still have our eye on the H4 Quasimodo resistance level (pending order placed at 1.0983) mentioned above at 1.0984 due to the following: (slightly revised from the previous report)
- Despite the recent reaction from the H4 resistance area at 1.0946-1.0931, this zone has very likely been consumed due to the amount of times its been visited (a tree can only be chopped so many times), thus opening the path north towards our sell zone.
- The H4 Quasimodo sits nicely within the extremes of the above said daily supply zone.
- It also blends beautifully with the 78.6% Fibonacci barrier at 1.0985.
- Large Psychological resistance sits just above at 1.1000.
Other than our aforementioned buy and sell zones, the levels in between are considered by us to be mid-range since there’s not really much higher-timeframe convergence present.
Levels to watch/live orders:
- Buys: 1.08153 [LIVE] (Stop loss: breakeven). 1.0819/1.0800 [Tentative – confirmation required] (Stop loss: dependent on where one confirms this area).
- Sells: 1.0983 [Pending order] (Stop loss: 1.1010).
GBP/USD:
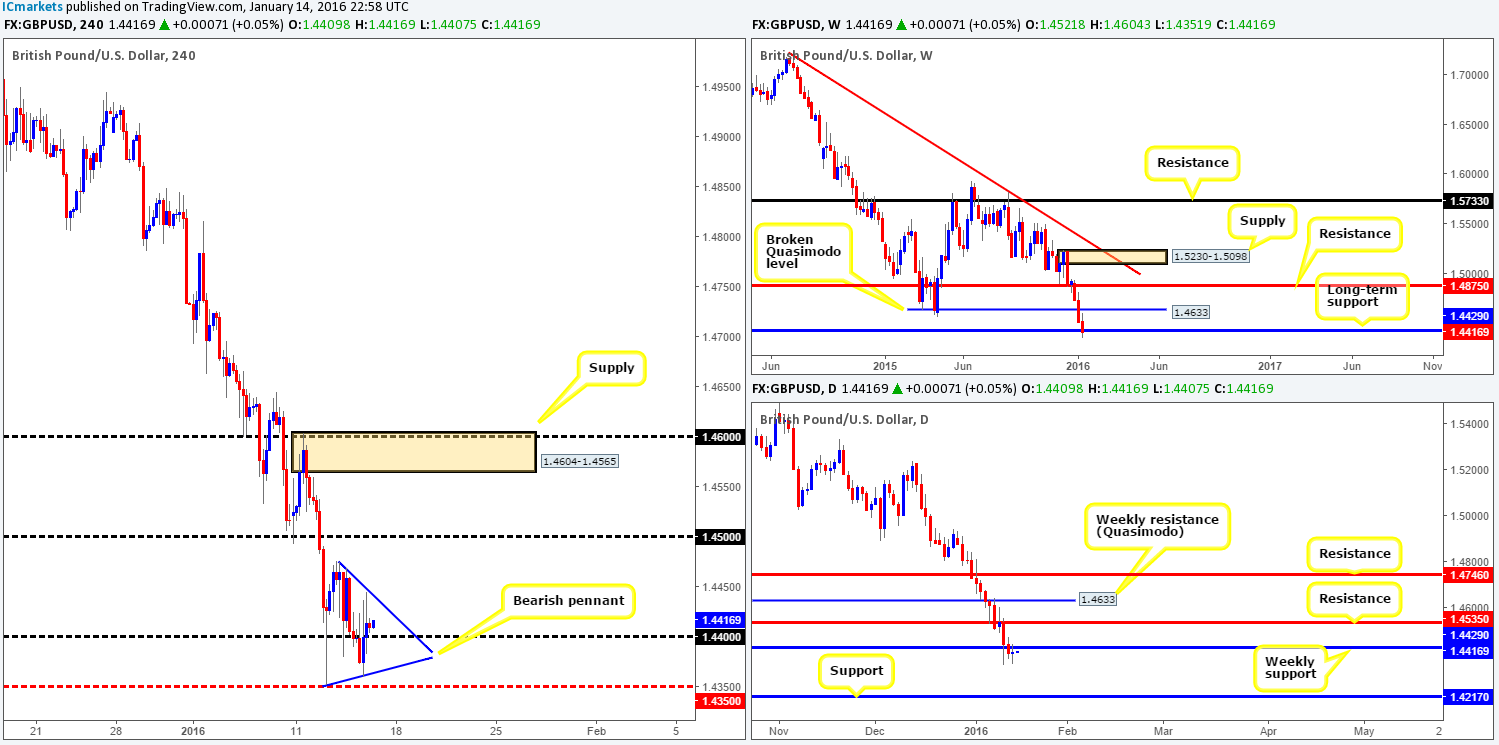
Despite U.K data, it was a relatively quiet session for Cable yesterday. Bids/offers were seen trading around the psychological number 1.4400 with bids edging prices higher into the close 1.4409. As a result of this somewhat lackluster performance, price is now seen compressing within what looks to be a bearish pennant (1.4474/1.4351).
Although weekly action currently shows the buyers and sellers battling for position at support drawn from 1.4429, down on the daily timeframe a slightly different picture is being painted. Wednesday’s trade saw this market actually close below the weekly level, thus suggesting further downside could be on the cards. However, Thursday’s session saw little follow-through and ended the day printing an indecision candle. This is not really surprising considering that this weekly level has capped downside movement on this pair since 2009.
Therefore, even though the GBP is trending south right now, we see uncertainty amongst market participants. To be on the safe side, we are going to remain flat going into today’s trade and wait to see where the weekly candle closes, since a convincing close below the weekly support on this timeframe would , in our opinion, indicate the pair is heading lower.
Levels to watch/live orders:
- Buys: Flat (Stop loss: N/A).
- Sells: Flat (Stop loss: N/A).
AUD/USD:
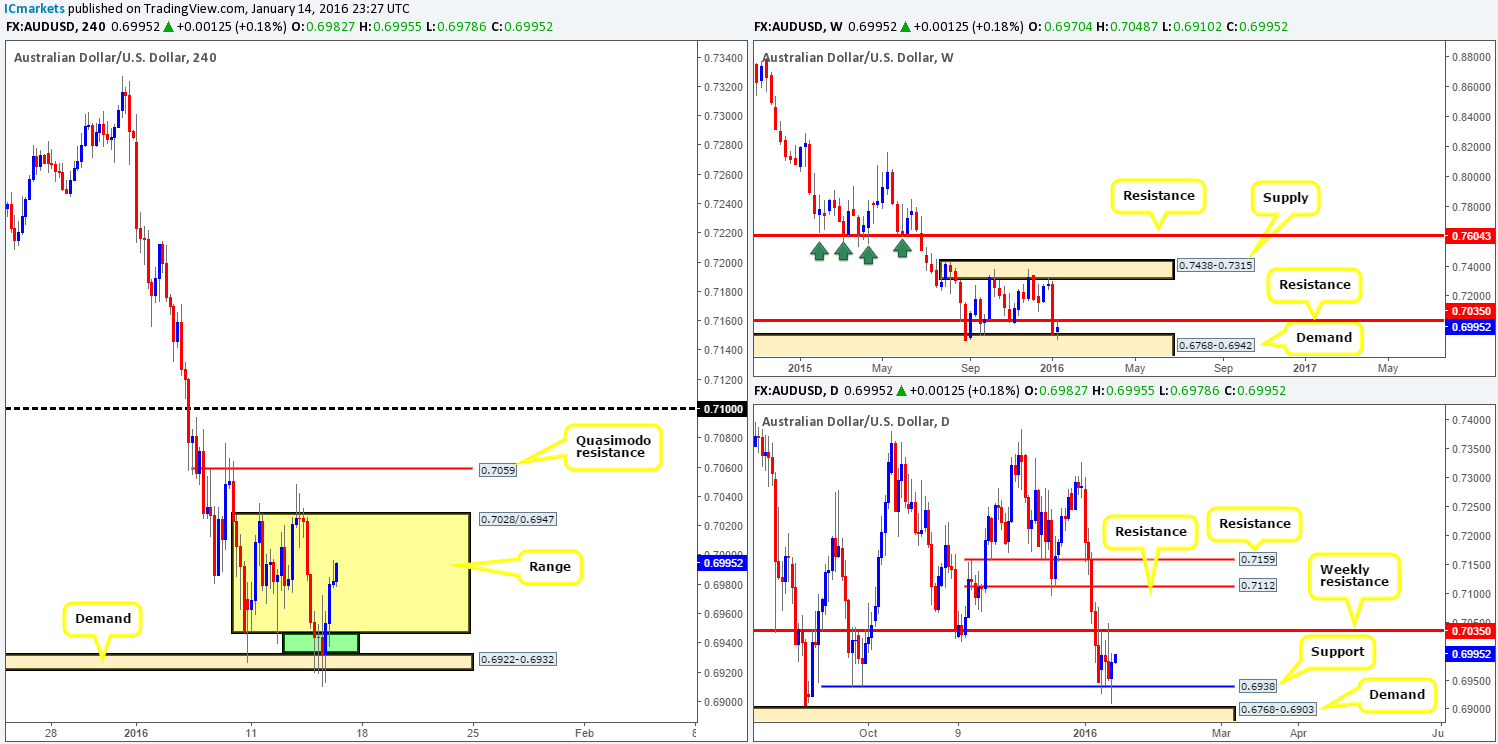
Going into the early hours of yesterday’s sessions, we can see H4 action begun printing a beautiful array of buying tails that spiked below both the current range between 0.7028/0.6947, and also the small demand at 0.6922-0.6932.
Initially, our plan was to look for lower timeframe buy entries within the green shaded area (0.6947/0.6932), but after seeing the collection of buying tails forming, our plan changed. Alongside this candle action, price was trading at daily support drawn from 0.6938 and weekly demand at 0.6768-0.6942, which was enough for our team to enter long with a small position at 0.69355 and a stop set at 0.69075. The reason for why we entered with a smaller than usual position here was simply due to the fact that we are still long the EURUSD.
As we write, our stop is firmly set at breakeven and we’re looking to cash in 70% of our position around the large psychological number 0.7000. The remaining 30% will likely be held until the extreme of the H4 range mentioned above at 0.7028. Closing our full position here was an easy decision owing to the fact that weekly resistance is lurking a few pips above at 0.7035, thus making this a very high-probability turning point for shorts!
Levels to watch/live orders:
- Buys: 0.69355 [LIVE] (Stop loss: breakeven).
- Sells: 0.7028 region [Tentative – confirmation required] (Stop loss: dependent on where one confirms this area).
USD/JPY:
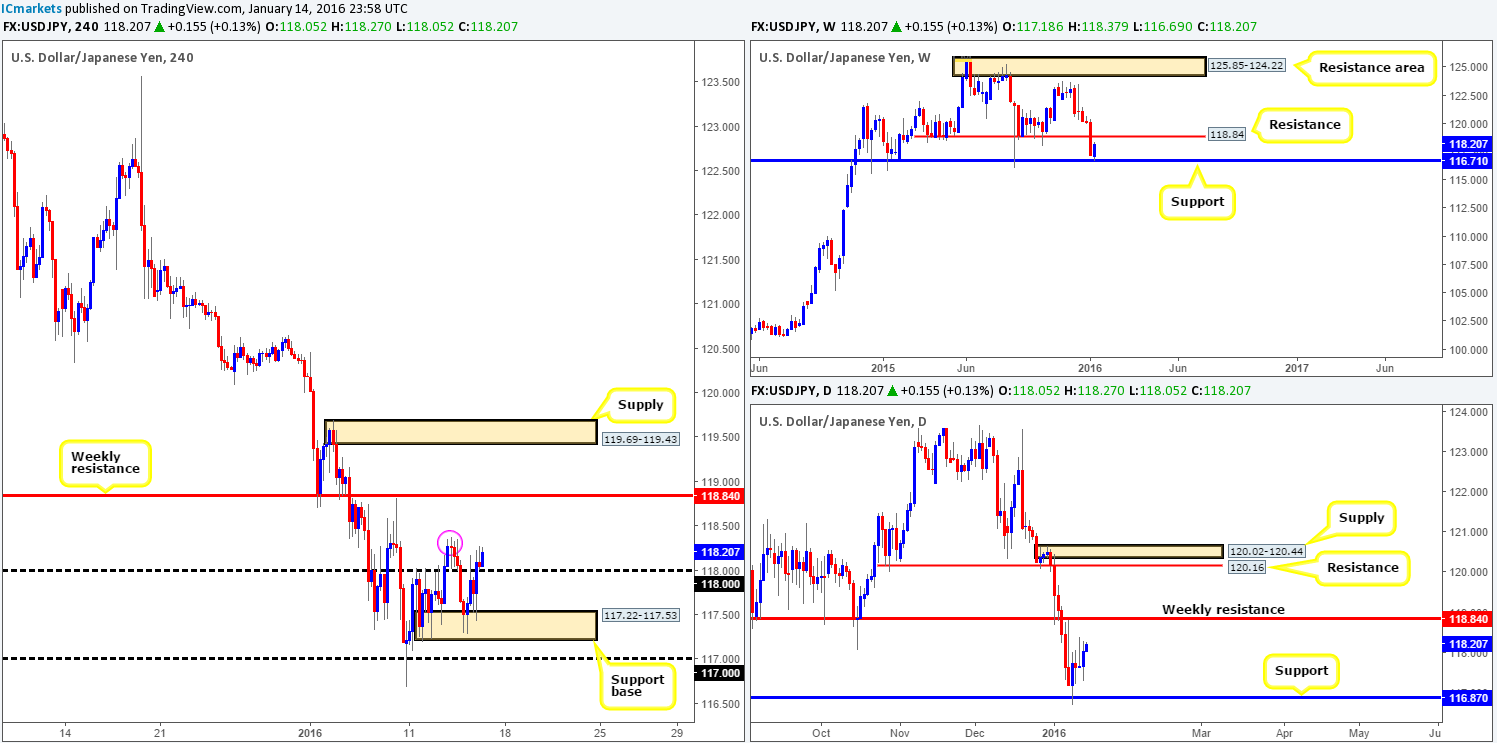
This morning’s analysis will kick-off with a look at the weekly timeframe, which shows support at 116.71 has so far held steady. Should this buying momentum continue it’s likely we’ll see price connect with offers around the weekly resistance painted at 118.84. In a similar fashion, following the rebound from support at 116.87 on the daily timeframe, the path also appears to be clear for further buying up to the aforementioned weekly resistance.
Turning our attention to the H4 timeframe, psychological resistance 118.00 was recently breached and is now seen attacking offers around Wednesday’s highs 118.37 (pink circle). Given that both the weekly and daily charts indicate further upside is possible today (see above), our prime focus will be on longs.
That being the case, a break above the 118.37 region and a confirmed retest of 118.00 will be required for us to trade long. Failing that, however, if we see a close above 118.37, we may consider a long should price retest these highs as support alongside lower timeframe buying strength (break of supply, buying tails etc…). Regardless of where we enter long here though, the final take-profit will be the above said weekly resistance.
Levels to watch/live orders:
- Buys: 118.00 [Tentative – confirmation required] (Stop loss: dependent on where one confirms this level). Watch for offers to be consumed around 118.37 and look to trade any retest seen thereafter (lower timeframe confirmation required).
- Sells: Flat (Stop loss: N/A).
USD/CAD:
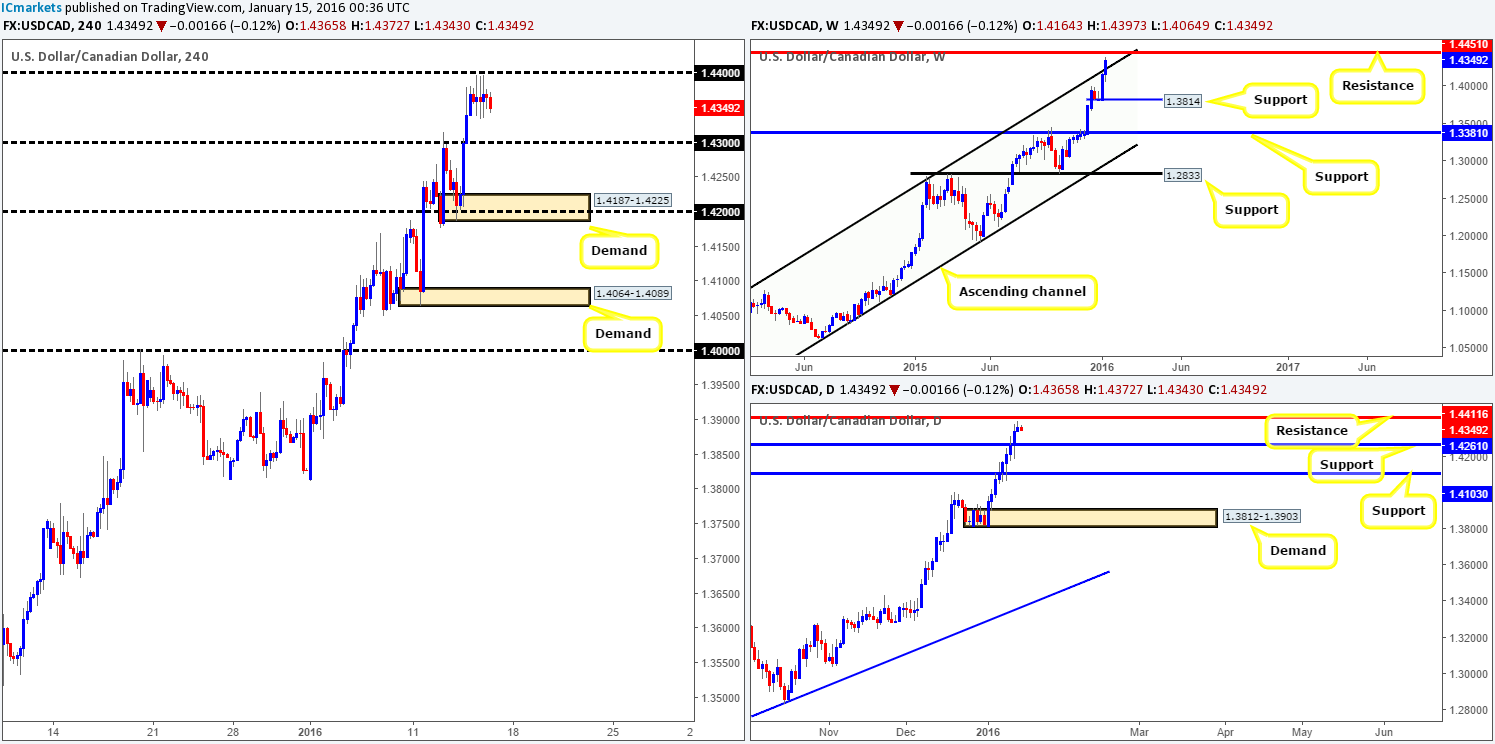
Throughout the course of yesterday’s sessions, the USD/CAD consolidated in a tight range comprising of back-to-back H4 indecision candles just below the psychological resistance 1.4400, with U.S. data having little effect.
Although there are clearly willing sellers at 1.4400, this is not really a number we’d be comfortable trading. Our rationale behind this approach stems from the weekly timeframe showing room to push higher towards resistance at 1.4451 following the recent break of the upper channel resistance band extended from the high 1.1173. In addition to this, daily resistance is seen just above 1.4400 at 1.4411. Therefore, one should at least expect a fakeout before considering shorts here.
Given that price is trading close to higher-timeframe resistances right now and the underlying trend remains strong, our team has agreed that waiting for the weekly candle to close before making any further decisions is the best path to take. For example, should the weekly candle continue advancing today, we could see a close above the higher timeframe resistances, thus indicating further buying the following week. Conversely, a rejection could indicate a possible short trade early next week…
Levels to watch/live orders:
- Buys: Flat (Stop loss: N/A).
- Sells: Flat (Stop loss: N/A).
USD/CHF:
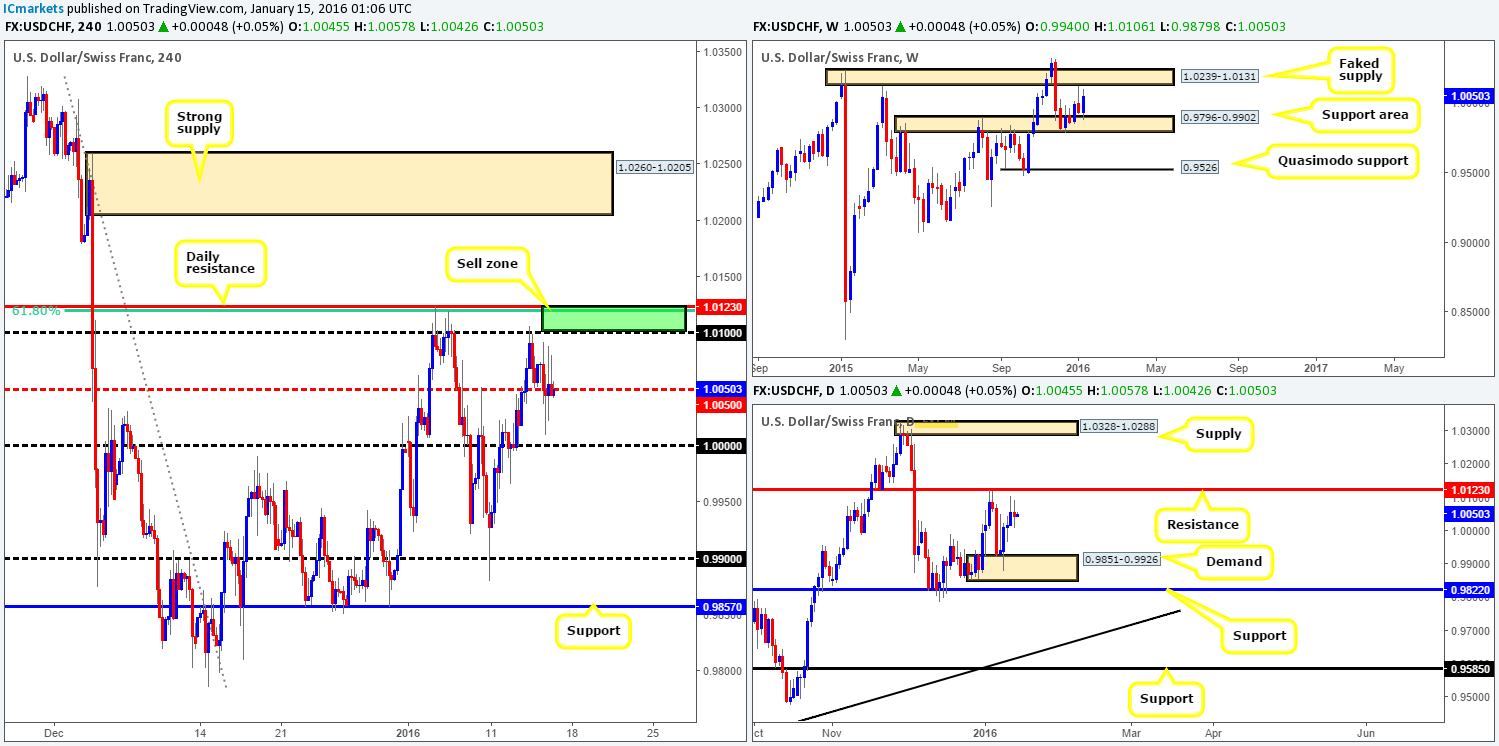
In the thick of trade yesterday, H4 action shows that bids/offers were chewed up around the mid-level number 1.0050. Despite this pair ranging over eighty pips, price closed a mere twelve pips lower than Wednesday’s close at 1.0045, resulting in a daily indecision candle forming below daily resistance at 1.0123. Consequent to this recent movement, our outlook for this market remains the same as Wednesdays…
The ideal sell zone, in our opinion, is seen between 1.0100 and the daily resistance itself (blends together with a 61.8% Fibonacci number at 1.0122). Be that as it may, trading this area blindly (setting a pending order and hoping for the best) might not be the best course of action, as directly above this area lurks a weekly faked supply at 1.0239-1.0131, thus a fakeout above our sell zone is very possible. Therefore, we would strongly advise only trading this area if you are able to spot lower timeframe confirming action in the form of either a demand being engulfed, a trendline break or even a collection of selling tails at lower timeframe resistance. This usually allows one to avoid any fakeout that takes place!
Levels to watch/live orders:
- Buys: Flat (Stop loss: N/A).
- Sells: 1.0100/1.0123 region [Tentative – confirmation required] (Stop loss: dependent on where one confirms this area).
DOW 30:
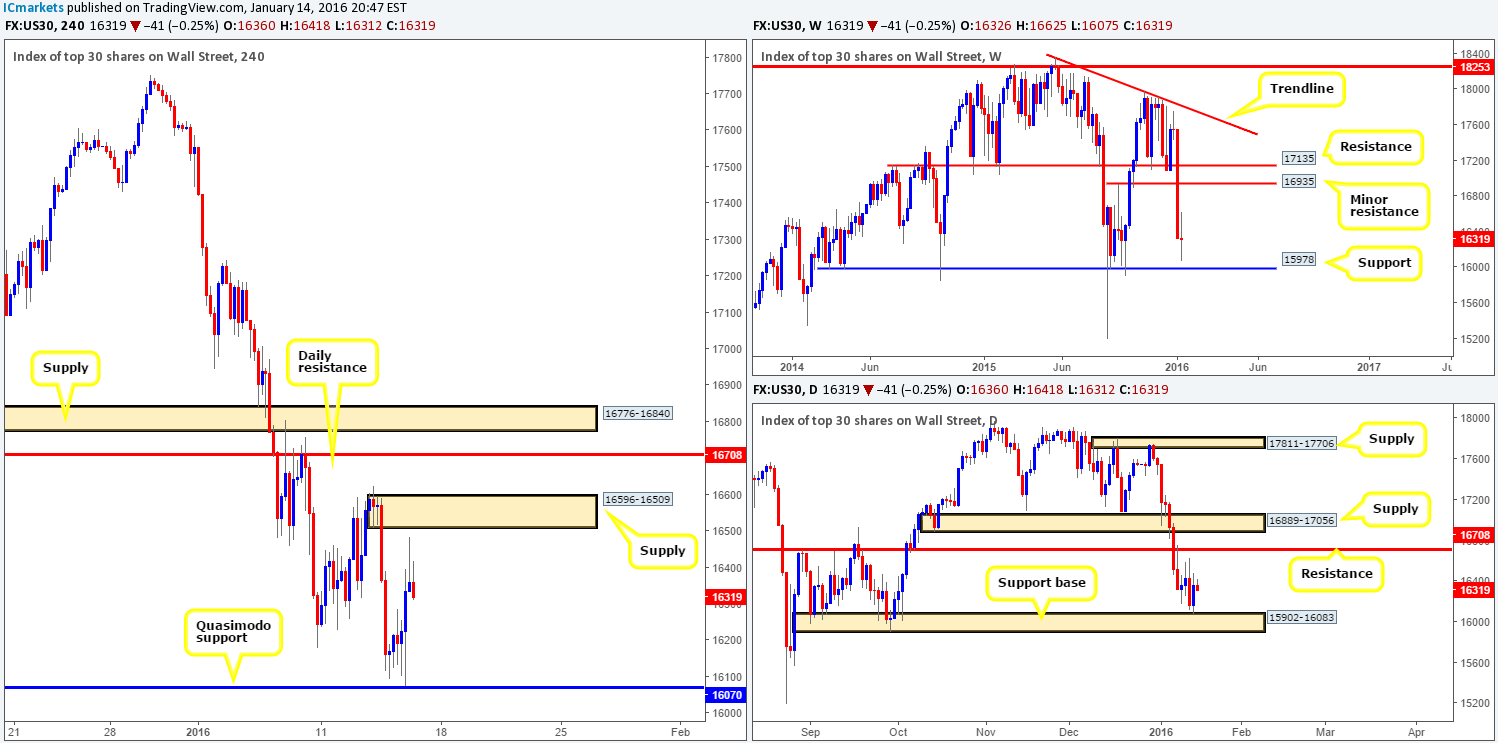
For those who read our previous report on the DOW (http://www.icmarkets.com/blog/thursday-14th-january-all-eyes-on-cable-and-the-u-s-dollar-from-midday-onwards-today-remain-vigilant/), you may recall us mentioning to watch for price to attack the H4 Quasimodo level at 16070 for a possible long into this market. As shown on the chart, market action hit this level to-the-point yesterday before correcting sharply higher during the early hours of U.S. trade. Regrettably however, we passed on this trade due to already being long the EUR/USD and also the AUD/USD. Well done to any of our readers who managed to lock in some green pips from this move.
Pushing forward, selling interest is now seen coming into the market around the 16483 mark, just below H4 supply at 16596-16509. Selling either at current prices or at the aforementioned supply does not really interest us. That is not to say that the supply itself does not look attractive, because it does. The only grumble we have here is where price has come from. Not only did it bounce from a H4 Quasimodo support, but it also traded from a daily support base coming in at 15902-16083. With that in mind, H4 supply may not be strong enough to withstand daily buying, thus leaving us with the daily resistance level at 16708 and H4 supply drawn from 16776-16840 for sells.
With regards to buys, nonetheless, if price retested the aforementioned H4 Quasimodo support, we would, dependent on how the lower timeframes behaved and time of day, consider buying from here again. However, let’s not forget that the weekly timeframe is not yet crossing paths with support, and the nearest barrier can be seen at 15978 (a nice level to look for longs should price reach this low considering it sits within the above said daily support base), hence the need for confirmation on any longs from 16070!
Levels to watch/live orders:
- Buys: 16070 [Tentative – confirmation required] (Stop loss: dependent on where one confirms this level). 15978 [Tentative – confirmation required] (Stop loss: dependent on where one confirms this level).
- Sells: 16708/16840 [Tentative – confirmation required] (Stop loss: dependent on where one confirms this area).
XAU/USD: (Gold)
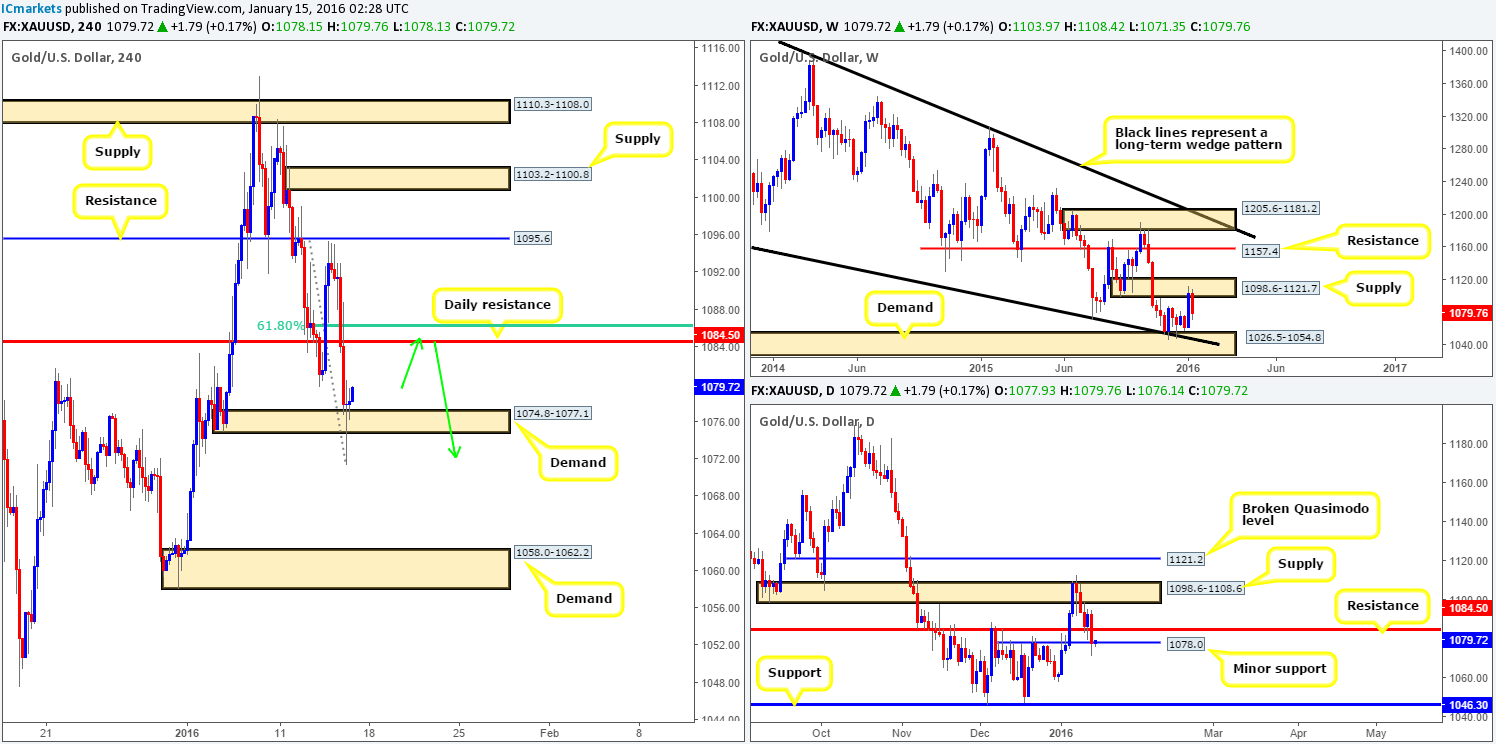
Following three H4 selling wicks printed around the underside of H4 resistance at 1095.6, the yellow metal spiraled south yesterday. This, as is evident from the H4 chart, saw bids around both the daily support (now resistance) at 1084.5 and also at the H4 demand zone taken from 1074.8-1077.1 (sits just below a minor daily support at 1078.0) wiped out.
Now, given that the majority of buyers have likely been cleared out here, and weekly action is selling off nicely from supply at 1098.6-1121.7, our team has their eye on shorting from 1084.5 – daily resistance (as per the green arrows). Not only is this a strong level in and of itself, it also fuses nicely with the 61.8% Fibonacci level at 1086.4. Due to this being a fixed level and not a zone, however, our team has come to a general consensus that waiting for lower timeframe confirming price action before committing capital here is (for us) the more logical approach.
Ultimately though, we’re extremely confident that price will bounce from here if price trades this high. Therefore, we’d happily enter short from simply a H4 selling tail aka a pin-bar candle. Should we manage to secure an entry here today, the first take-profit target would be the recently faked H4 demand directly below since there may be residual orders left over from the whipsaw. Following this, we’re eyeing the H4 demand below at 1058.0-1062.2 as our final take-profit zone, which sits just above weekly demand coming in at 1026.5-1054.8.
Levels to watch/live orders:
- Buys: Flat (Stop loss: N/A).
- Sells: 1084.5 [Tentative – confirmation required] (Stop loss: dependent on where one confirms this level).


