A note on lower timeframe confirming price action…
Waiting for lower timeframe confirmation is our main tool to confirm strength within higher timeframe zones, and has really been the key to our trading success. It takes a little time to understand the subtle nuances, however, as each trade is never the same, but once you master the rhythm so to speak, you will be saved from countless unnecessary losing trades. The following is a list of what we look for:
- A break/retest of supply or demand dependent on which way you’re trading.
- A trendline break/retest.
- Buying/selling tails – essentially we look for a cluster of very obvious spikes off of lower timeframe support and resistance levels within the higher timeframe zone.
- Candlestick patterns. We tend to only stick with pin bars and engulfing bars as these have proven to be the most effective.
For us, lower timeframe confirmation starts on the M15 and finishes up on the H1, since most of our higher timeframe areas begin with the H4.
EUR/USD:
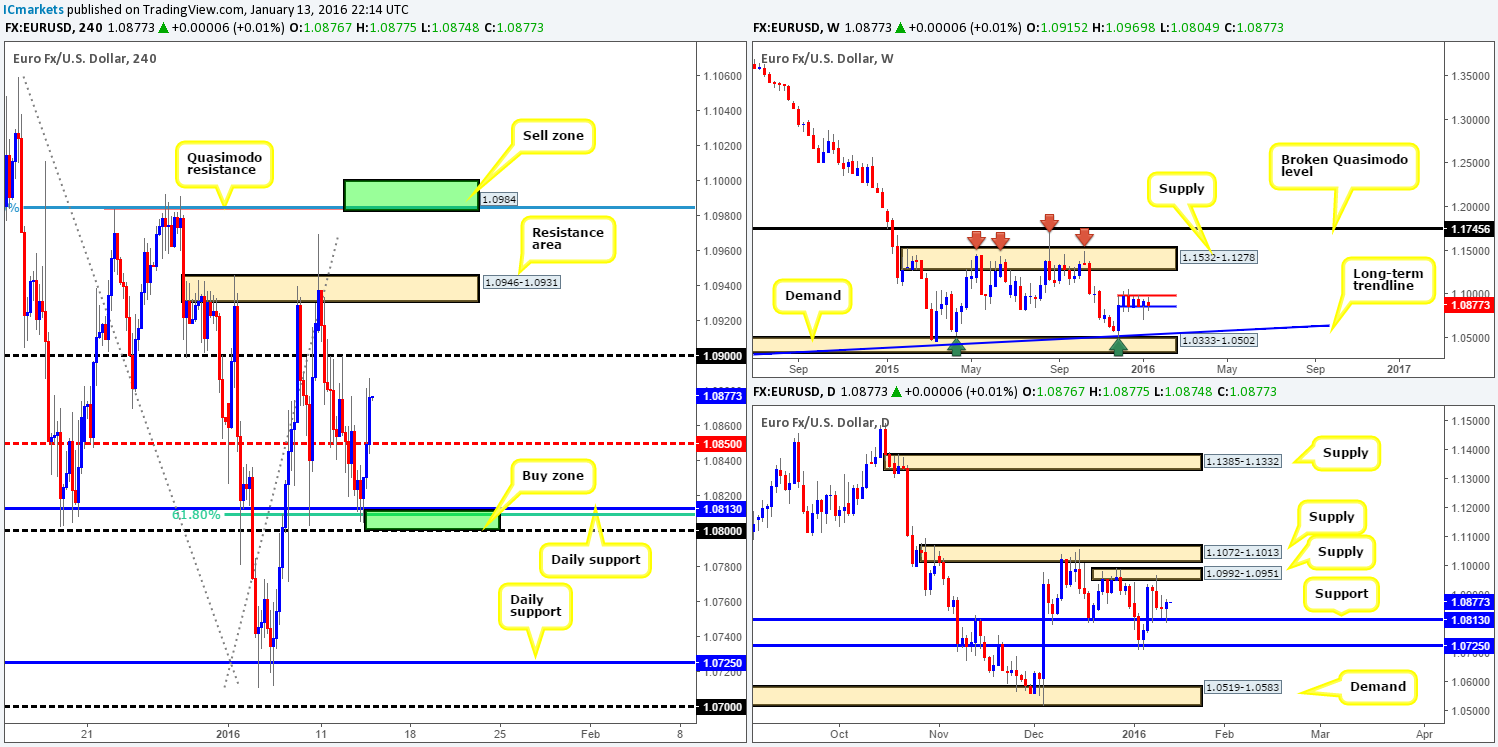
For those who read our previous report (http://www.icmarkets.com/blog/wednesday-13th-january-daily-technical-outlook-and-review/), you may recall that we mentioned to keep an eye on the H4 Quasimodo resistance level at 1.0984 for sells and the daily support barrier painted at 1.0813 for buys.
As you can see, price reacted beautifully to our buy zone (formed from both a 61.8% Fibonacci level at 1.0808 and psychological support coming in at 1.0800) during yesterday’s sessions. In the above said report, you may remember we also noted that we would not be placing a pending buy order at this level. Instead, an entry was dependent on the H4 approach and time of day. Well, the approach was nice, and to top it off there was a collection of beautiful buying tails seen on the H1 which allowed us to enter just before the U.S. open at 1.08153 with a stop set at 1.07965. 50% of our position has already been liquidated at mid-level resistance 1.0850 and the stop moved to breakeven.
With the aggressive break above 1.0850 late in yesterday’s trade which potentially opened the gates to further buying up to psychological resistance 1.0900, and daily action showing room to move up to supply at 1.0992-1.0951, this trade has high odds of rallying higher. Ultimately though, we’re eyeing the H4 Quasimodo level mentioned above at 1.0984, where we intend on closing our final long position here and switching to shorts (pending order set at 1.0983). Reasons for looking to short here are as follows (mentioned in previous report):
- A lot of people are probably wondering why we did not select the H4 resistance zone seen at 1.0946-1.0931 as a sell zone considering it’s positioned just beneath daily supply at 1.0992-1.0951. The reason for why is the spike seen on the 10th Jan at 1.0969 likely took out a huge amount of stops from here, thus potentially weakening this zone.
- The H4 Quasimodo sits nicely within the extremes of the above said daily supply zone.
- It also blends beautifully with the 78.6% Fibonacci barrier at 1.0985.
- Large Psychological resistance sits just above at 1.1000.
For those who missed the long entry at daily support yesterday, however, there may be a chance to buy later on today should price retest 1.0850 as support before reaching 1.0900. We would, dependent on the time of day and how the lower timeframe price behaved, consider pyramiding our current position.
Levels to watch/live orders:
- Buys: 1.08153 [LIVE] (Stop loss: breakeven). 1.0850 [Tentative – confirmation required] (Stop loss: dependent on where one confirms this level).
- Sells: 1.0983 [Pending order] (Stop loss: 1.1010).
GBP/USD:
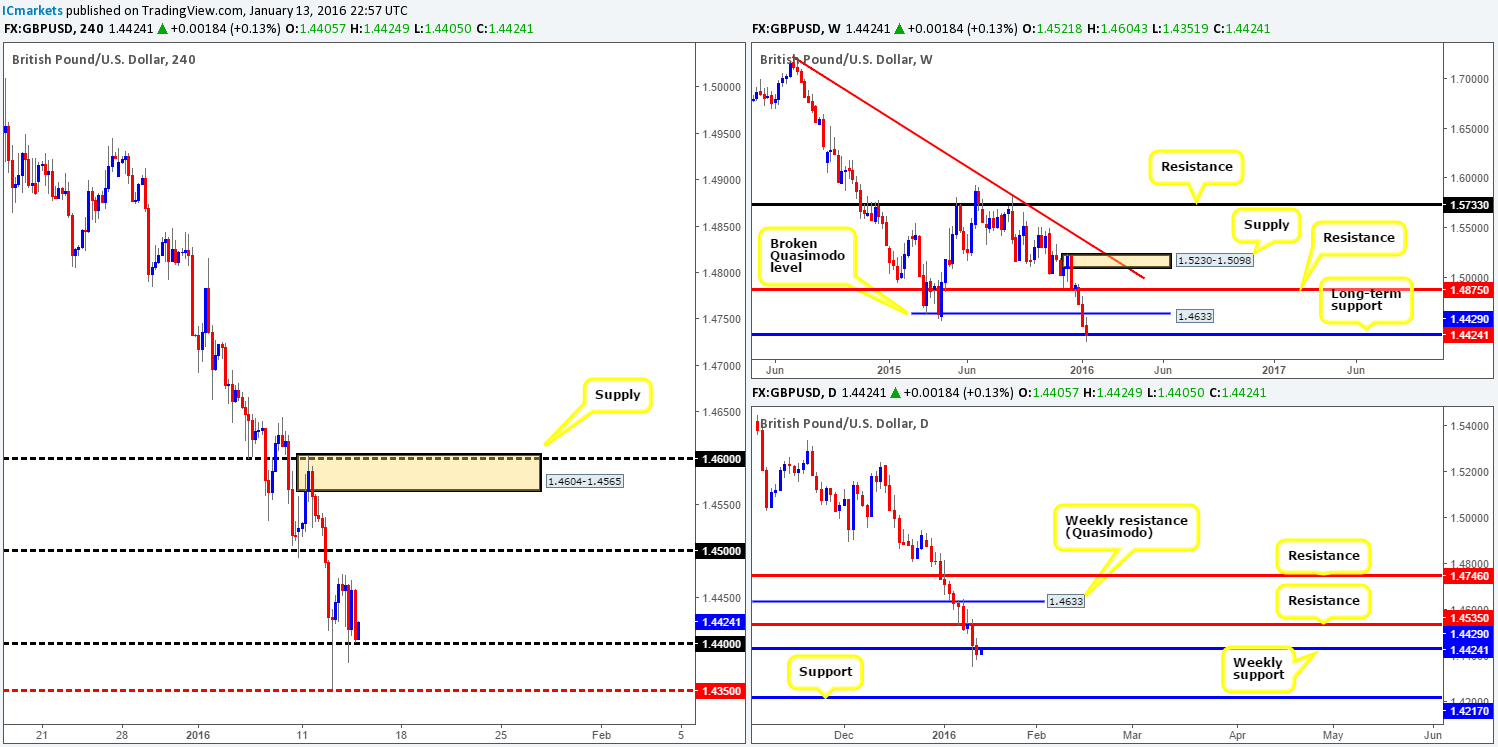
Early on in yesterday’s sessions we saw Cable sell-off from highs of 1.4476, resulting in market action connecting with psychological support 1.4400 mid-way through London trade. In our previous analysis (http://www.icmarkets.com/blog/wednesday-13th-january-daily-technical-outlook-and-review/), we spoke of looking for confirmed longs from this barrier. Be that as it may, seeing as we were already long the EUR/USD (see above), and the fact that there was little to no lower timeframe price action to buy into from here, this was an easy pass.
Although weekly action currently shows that the buyers and sellers are battling for position at support drawn from 1.4429, down on the daily timeframe a slightly different picture is being painted. Notice how the latest daily candle actually CLOSED below the weekly support and is now retesting this level as resistance, which if holds could suggest the Pound is heading lower. As we mentioned on Wednesday, this weekly level has capped downside movement on this pair since 2009, so a sustained move below here could spell serious trouble for this pair as the next support on the daily comes in at 1.4217.
Therefore, to be on the safe side, we are going to remain flat going into today’s trade and wait to see where the latest daily candle closes before making any further decisions.
Levels to watch/live orders:
- Buys: Flat (Stop loss: N/A).
- Sells: Flat (Stop loss: N/A).
AUD/USD:
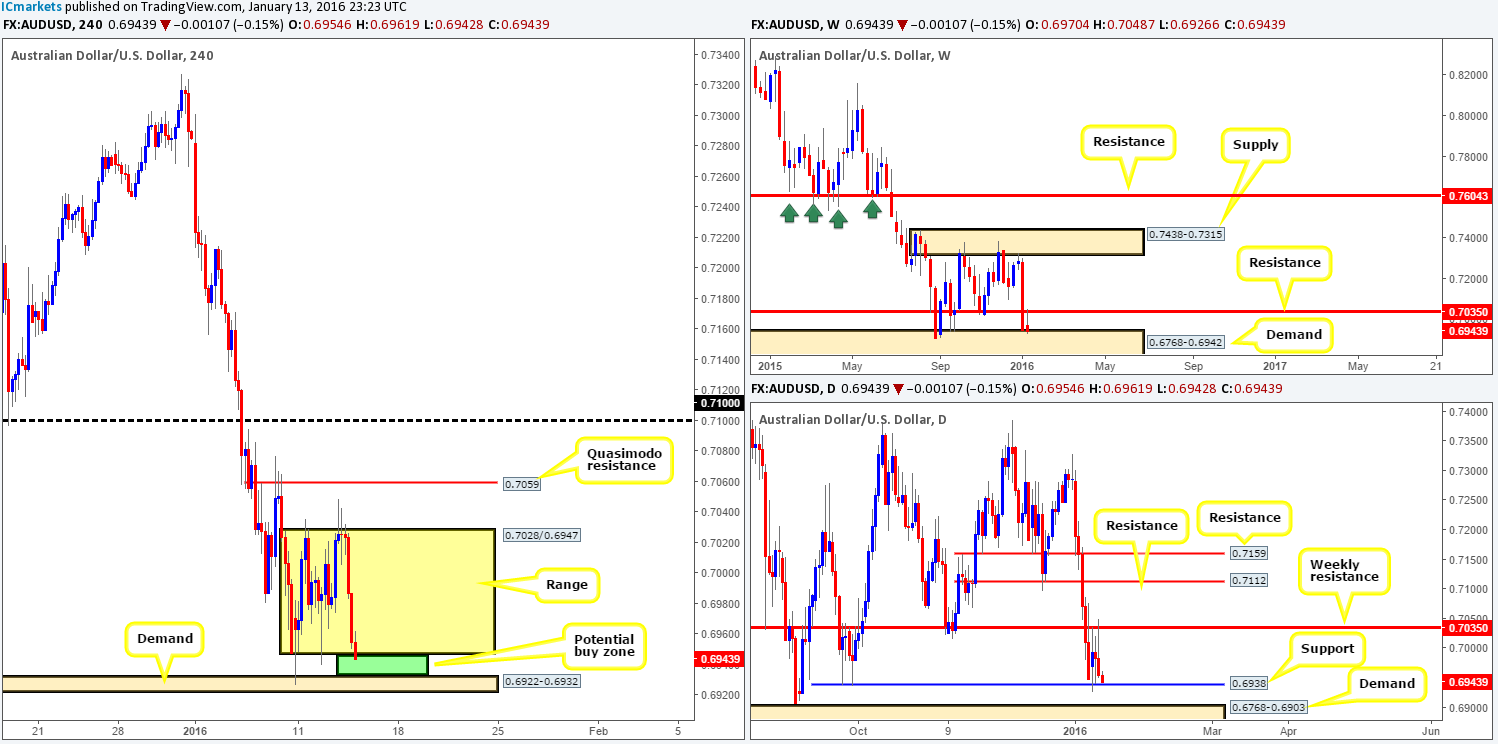
Starting from the top this morning, the Aussie bulls appear to be struggling to find a foothold at weekly demand drawn from 0.6768-0.6942. Offers at weekly resistance above at 0.7035 are clearly just too strong for the time being. Moving down a notch to the daily chart, support at 0.6938 (essentially the top-side of the above said weekly demand) alongside the weekly resistance mentioned above has effectively capped this market for the time being. Directly below this support, demand at 0.6768-0.6903 awaits, and above weekly resistance hangs the 0.7112 level – another resistance.
Turning our attention to the H4, we can see price is now effectively range bound between 0.7028/0.6947. Considering that this unit is testing the range support 0.6947 right now and it sits only a few pips above daily support at 0.6938, there could be a potential buy opportunity here today. That being said, the small demand zone seen below at 0.6922-0.6932 may attract price lower before reversing. This would take out any stops from traders looking to enter long at the extreme of this range and give well-funded traders liquidity to buy into (sell stops). Therefore, our plan of action today will consist of looking for (lower timeframe) confirmed buys between 0.6947 and 0.6932 (green area). Should we manage to locate an entry here, we’d ultimately be looking for price to fill the range but will likely take some off the table around the 0.6980 mark and move the stop to breakeven.
Levels to watch/live orders:
- Buys: 0.6932/0.6947 [Tentative – confirmation required] (Stop loss: dependent on where one confirms this area).
- Sells: Flat (Stop loss: N/A).
USD/JPY:
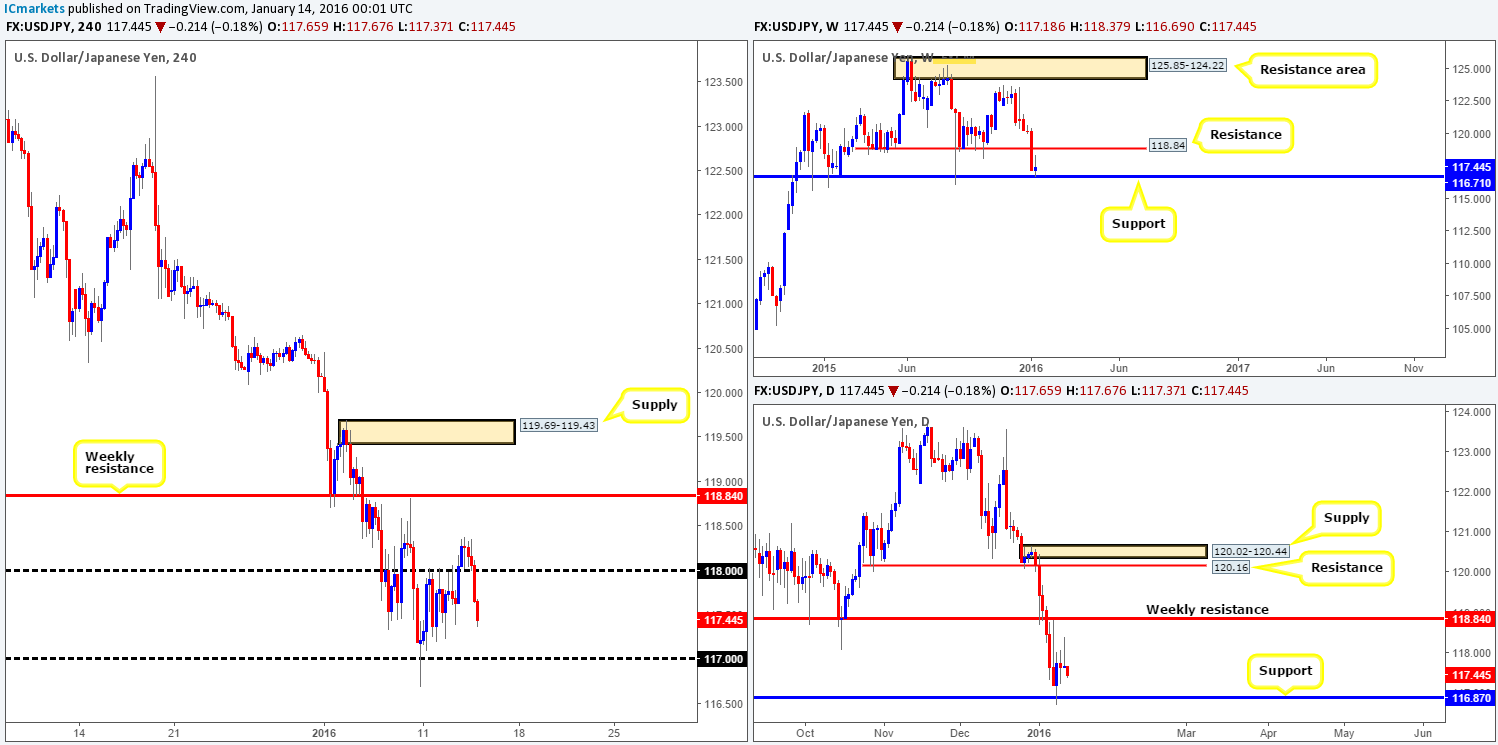
Going into the early hours of yesterday’s trade, the USD/JPY closed above psychological resistance 118.00 and later on retested this barrier as support (seen clearer on the M15). Due to our team already long the EUR/USD and considering that fact that price never hit 118.00 until 17.00 GMT, this was an easy pass.
Now, given that we see little active demand to the left of current prices at the moment, there is, as far as we’re concerned, little to stop this market from driving lower to psychological support 117.00 again. Should this occur, our team will switch into buy mode and begin looking for lower timeframe entries into the market. The reasons for why are as follows:
- The whipsaw though 117.00 on the 10th Jan likely consumed a ton of stops, and due to how aggressive the buying tail was, unfilled buy orders are likely lurking around this number.
- The market is also currently bolstered by both weekly support at 116.71 and also daily support at 116.87.
Therefore, we’d recommend not looking for a to-the-pip touch at 117.00, instead look for entries in between this number and 116.71.
Levels to watch/live orders:
- Buys: 117.00/116.71 region [Tentative – confirmation required] (Stop loss: dependent on where one confirms this area).
- Sells: Flat (Stop loss: N/A).
USD/CAD:
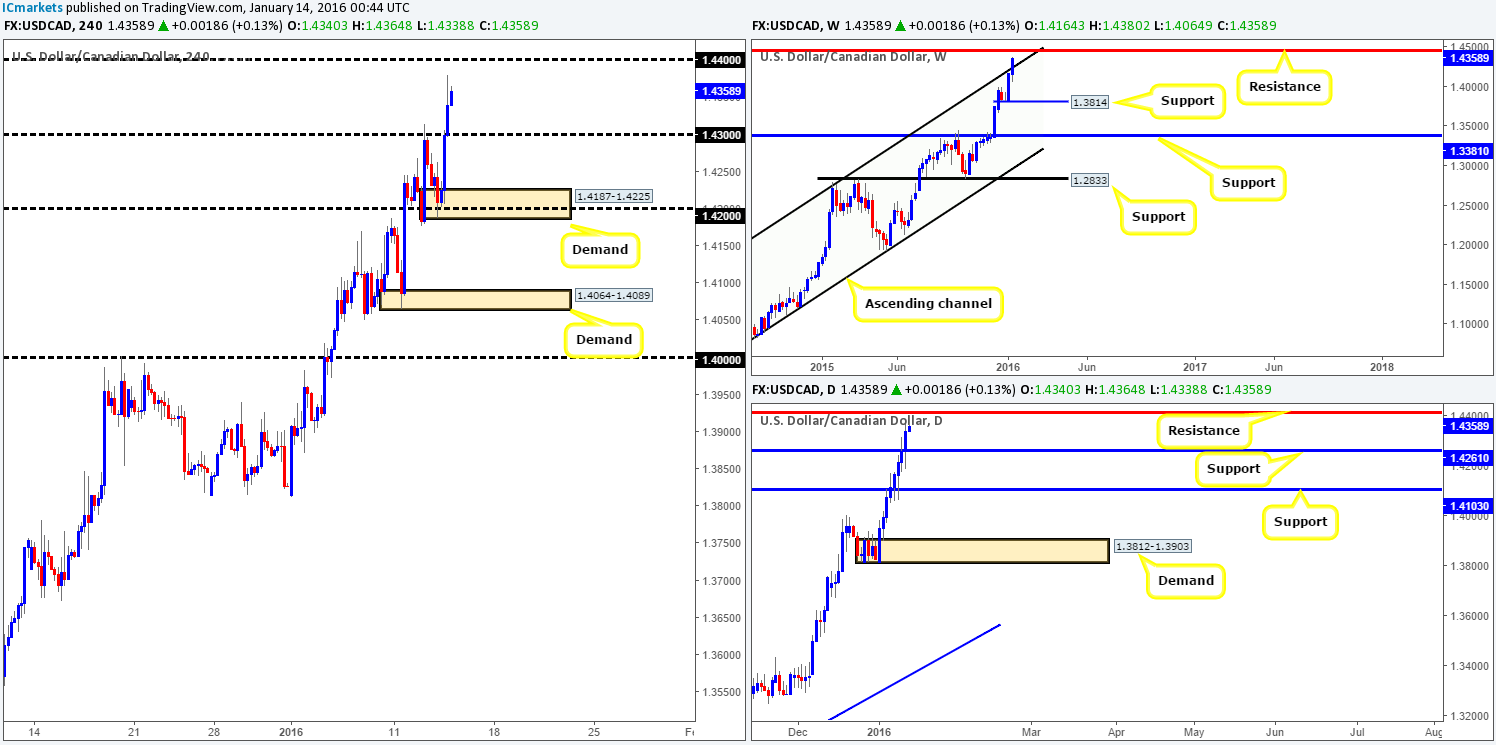
Beginning with the weekly timeframe this morning, we can see that price recently broke above the upper channel resistance band extended from the high 1.1173, and appears to be heading in the direction of resistance drawn from 1.4451. Scrolling down to the daily timeframe, yesterday’s upside move marks the eighth consecutive bullish day for this pair. This resulted in resistance (now support) at 1.4261 being consumed and the path now likely clear for further buying up to resistance coming in at 1.4411.
Zooming in and looking at the H4 chart, it’s clear to see that price rebounded beautifully from psychological support 1.4200 during the early hours of London, which clearly set the tone for the remainder of the day with price concluding trade at 1.4340.
Taking all of the above into consideration, our team favors further upside today. With that being the case, we’re looking for price to retrace to psychological support 1.4300 and produce a lower timeframe buy signal in order for us to enter long into this market. The reason for requiring confirmation here simply comes down to fixed numbers such as 1.4300 being prone to whipsaws.
Levels to watch/live orders:
- Buys: 1.4300 [Tentative – confirmation required] (Stop loss: dependent on where one confirms this level).
- Sells: Flat (Stop loss: N/A).
USD/CHF:
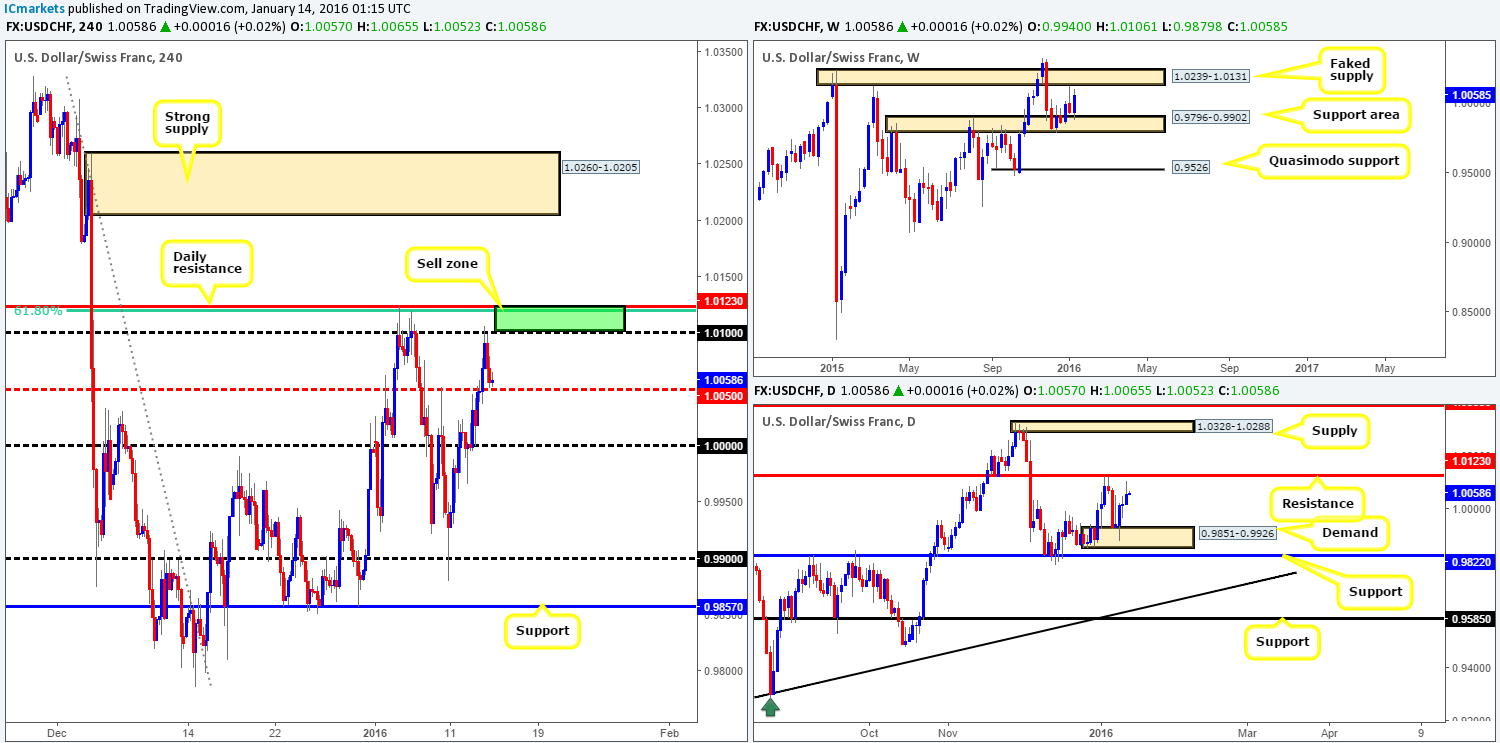
Following the retest of parity (1.0000), the Swissy pair continued to rally north during the European/London morning session yesterday, resulting in price tagging in offers at psychological resistance 1.0100. It was here (the U.S open) did we see the tracks begin to change. Price was aggressively sold into, consequently pushing this market down to just above mid-level support at 1.0050 and erasing most of the day’s gains.
Seeing as how price is now trading so close to daily resistance at 1.0123, we have to side with the sellers on this one. However, the ideal sell zone in our opinion would be between 1.0100 and the daily resistance itself (blends together with a 61.8% Fibonacci number at 1.0122). We passed on the initial short yesterday at 1.0100 as we were (and still are) long the EUR/USD. Nevertheless, this is still a prime sell zone to have noted down on your watch list today
That being said, we would still advise only shorting the above area alongside lower timeframe confirmation, due to the weekly faked supply lurking just above at 1.0239-1.0131 – hence a fakeout here is highly likely!
Levels to watch/live orders:
- Buys: Flat (Stop loss: N/A).
- Sells: 1.0100/1.0123 region [Tentative – confirmation required] (Stop loss: dependent on where one confirms this area).
DOW 30:
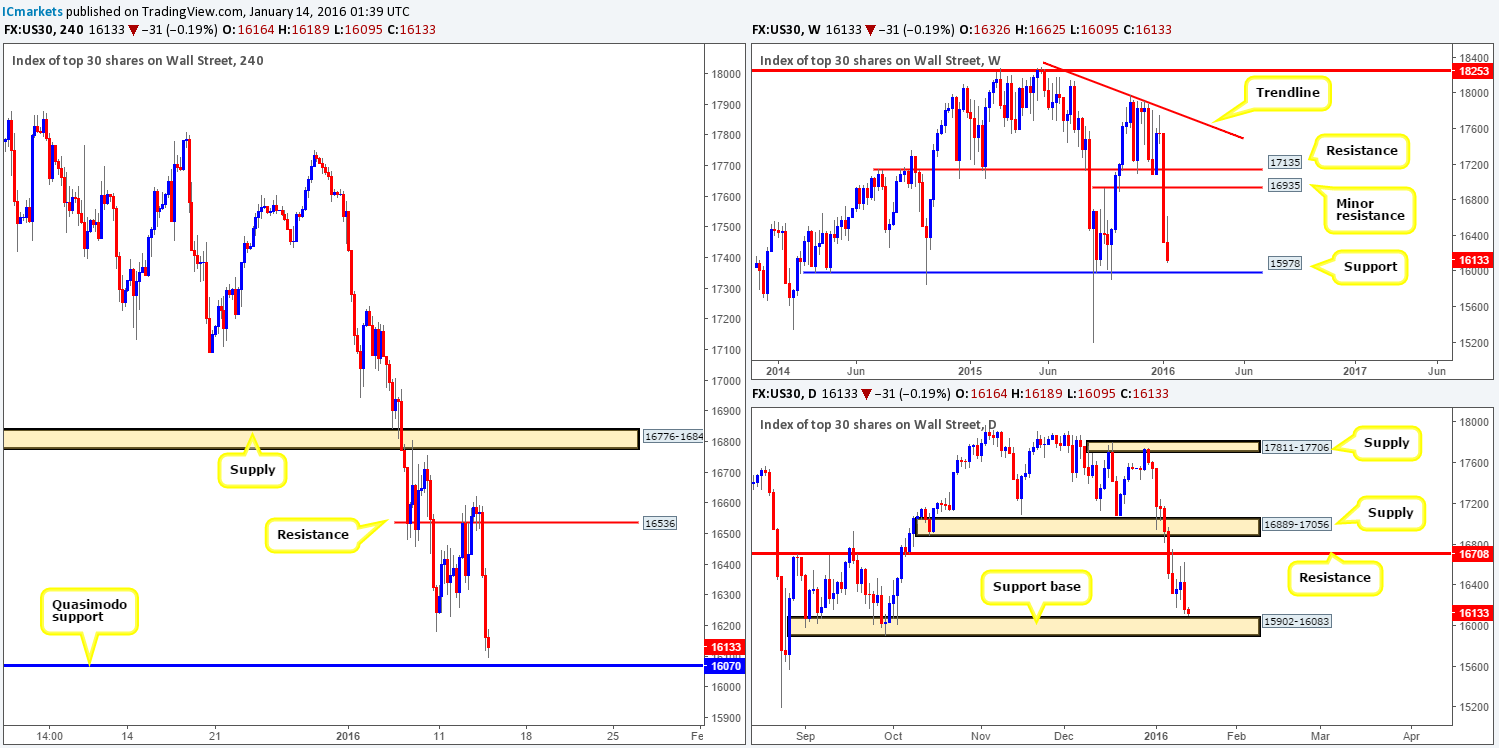
Following a brief stint above H4 resistance at 16536 yesterday, the DOW aggressively dropped lower going into the American session, reaching lows of 16117 on the day. With weekly support sitting at 15978, a daily support base fixed at 15902-16083 and a H4 Quasimodo support level coming in at 16070, buying this market appears to be the favorite today.
Given that the H4 level fuses together nicely with the top-side of the daily support base, a bounce from here is very likely. However, let’s not forget we have a weekly level lurking lower down on the curve at 15978. Therefore, price could theoretically ignore the H4 level and head lower.
On that account, here is how we intend to approach this market today…
- Watch for price to attack the H4 Quasimodo level at 16070. Should we see a lower timeframe response (preferably on the M30/M60) we’ll jump in long looking to ride the bounce.
- In the event that the above said H4 level is engulfed, we’ll then be eyeing the weekly level mentioned above at 15978 for longs, as this barrier is perfectly placed within the aforementioned daily support base. If you’re considering entering long at market from here, we would highly advise placing stops below the daily support area itself around the 15853 mark.
Levels to watch/live orders:
- Buys: 16070 [Tentative – confirmation required] (Stop loss: dependent on where one confirms this level). 15978 [Tentative – confirmation required] (Stop loss: dependent on where one confirms this level).
- Sells: Flat (Stop loss: N/A).
XAU/USD: (Gold)
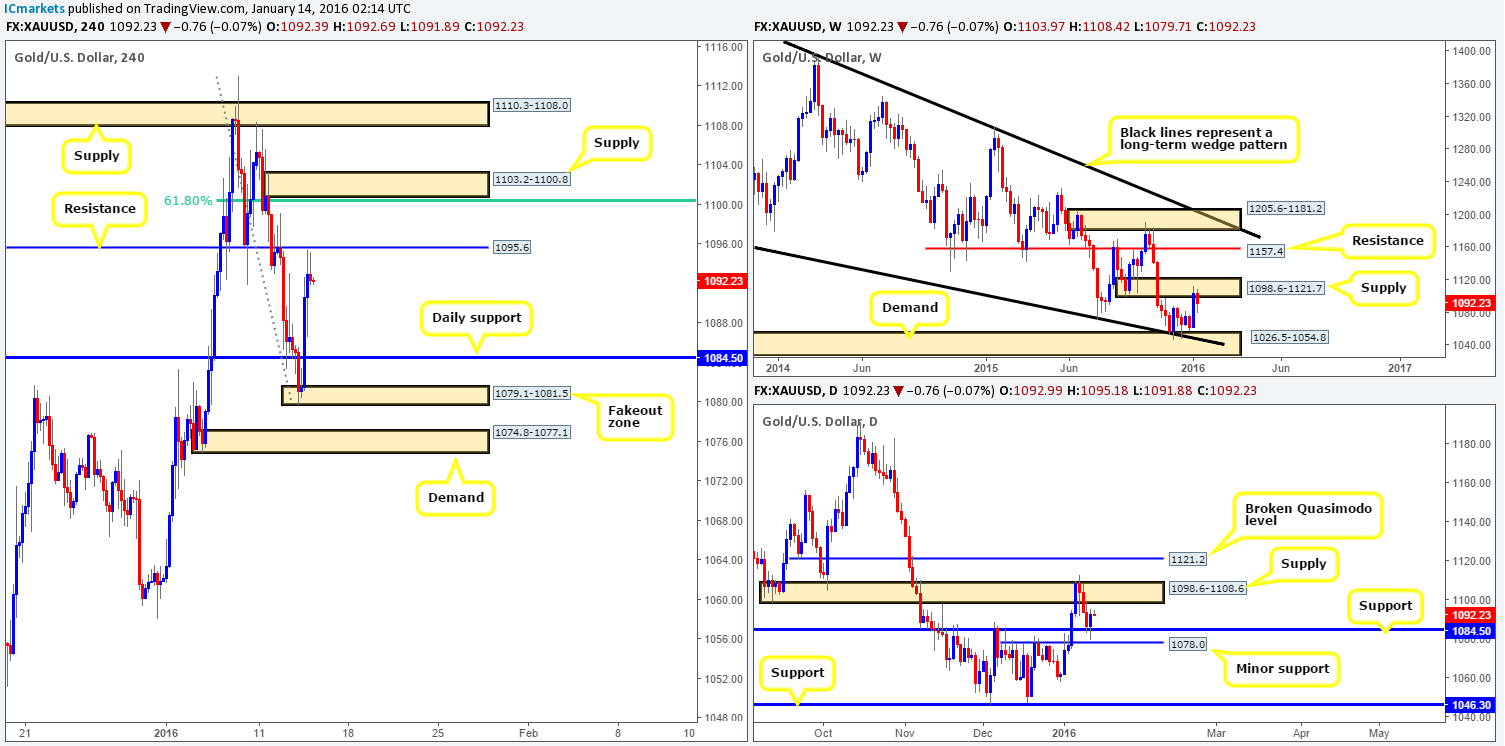
Coming at you directly from the pits of the weekly timeframe this morning, we can see that Gold remains offered from supply painted at 1098.6-1121.7. On the flip side, daily action shows that after a three-day fall, the yellow metal exhibited its brighter side during yesterday’s session. Price faked below support at 1084.5, just missing minor support at 1078.0 before closing the day positive at 1092.9. However, before all you Gold hounds start rushing for the door to buy, keep in mind that there’s supply hanging just above at 1098.6-1108.6.
Moving down a level to the H4, price has recently printed two selling wicks at the underside of H4 resistance coming in at 1095.6. For all that though, shorting from here is a risky trade in our book due to the more attractive area being located above in the form of H4 supply drawn from 1103.2-1100.8. Ultimately, this is the only zone we’d consider shorting today due to the following converging structures:
- Sits within the above said weekly supply zone.
- Also loiters within the aforementioned daily supply area.
- Ties in nicely with the 61.8% Fibonacci level at 1100.0.
Even though this area boasts relatively strong confluence, however, our team is still insisting on trading it with lower timeframe confirmation, due to the possibility that price could fake above our chosen H4 area higher into the larger zones.
Levels to watch/live orders:
- Buys: Flat (Stop loss: N/A).
- Sells: 1103.2-1100.8 [Tentative – confirmation required] (Stop loss: dependent on where one confirms this area).


