
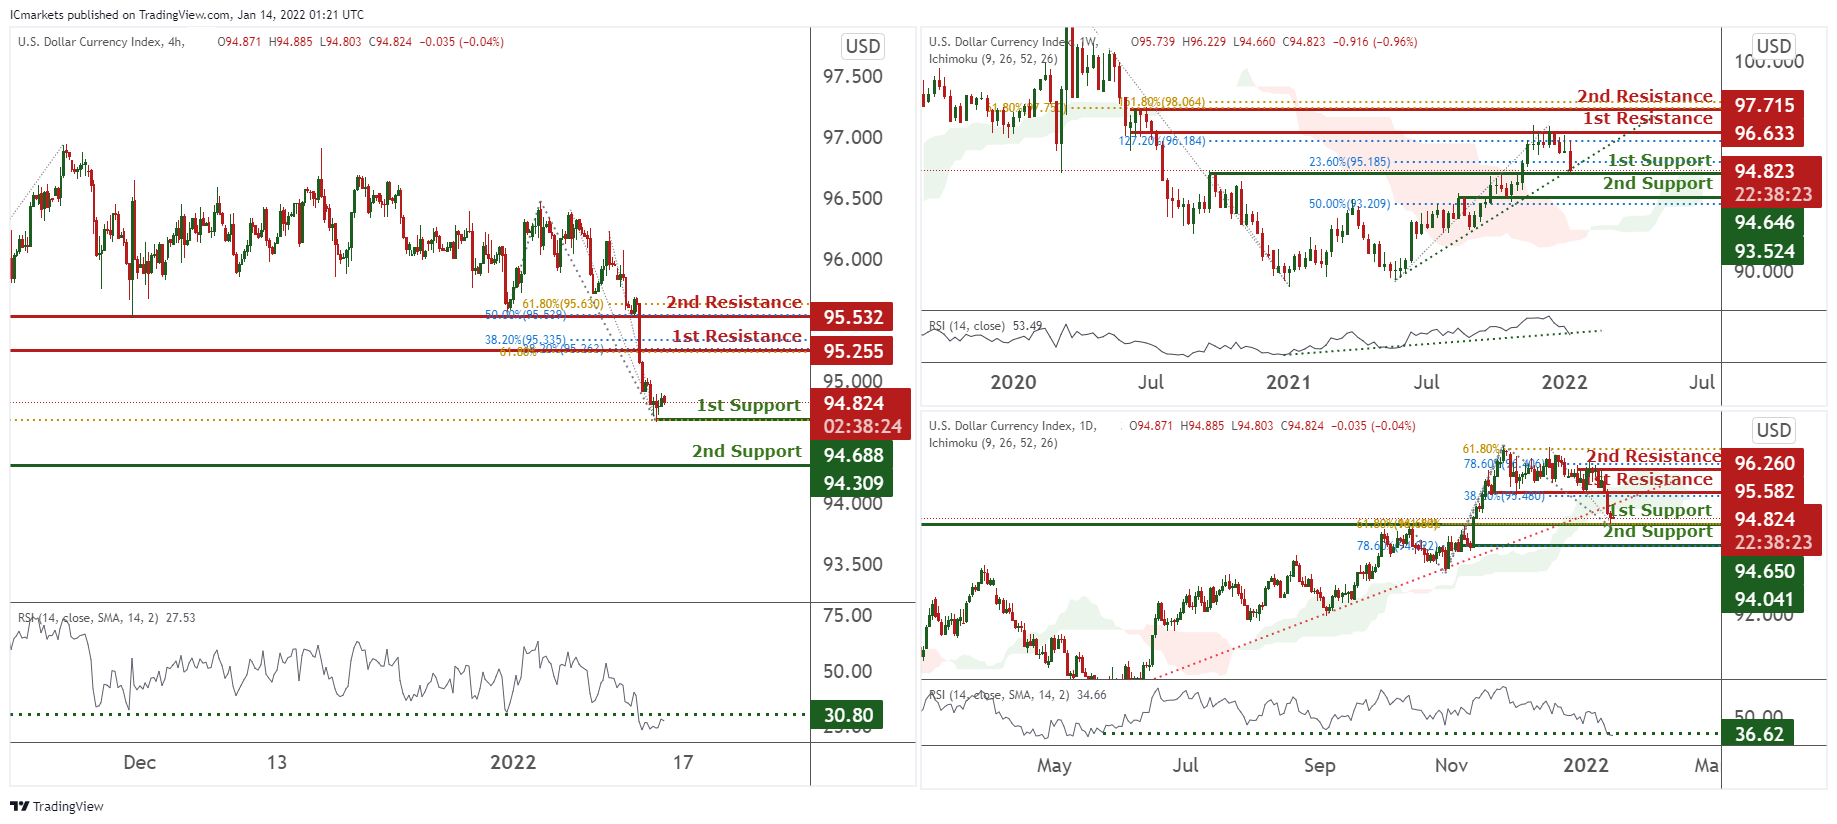
DXY:
On the weekly, prices are on bullish momentum and abiding to our ascending trendline. We see potential for prices to bounce from our 1st support at 94.646 in line with 23.6% Fibonacci retracement towards our 1st resistance at 96.633 in line with 127.2% Fibonacci extension. Ichimoku clouds are forecasting bullish bounce.
On the daily, prices have recently broken out of our ascending trendline. We see potential for prices to bounce from our 1st support at 94.650 in line with 61.8% Fibonacci retracement and 61.8% Fibonacci extension towards our 1st resistance at 95.582 in line with 38.2 Fibonacci retracement to retest our ascending trendline. RSI is at a level where bounces previously happened.
On the H4 timeframe, prices have reached a graphical swing low. We would expect a bounce from our 1st support at 94.688 in line with 61.8% Fibonacci retracement towards our 1st resistance at 95.255 which is an area of FIbonacci confluences. RSI is at a level where bounces previously occurred.
Areas of consideration:
- H4 time frame, 1st resistance at 95.255
- H4 time frame, 1st support at 94.688
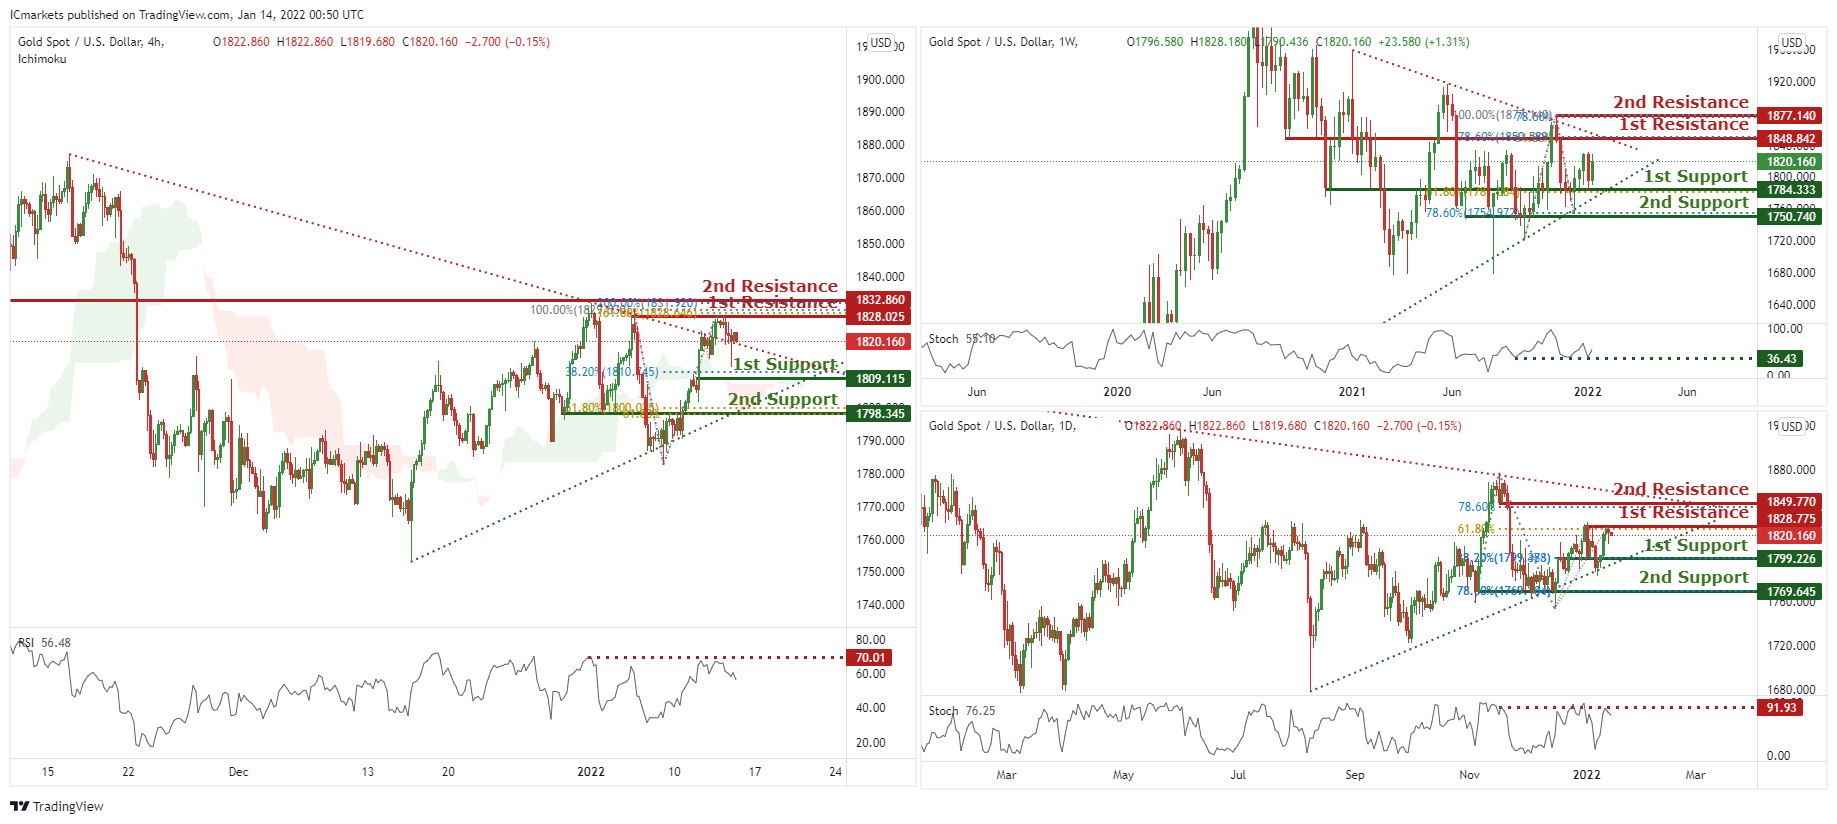
XAU/USD (GOLD):
On the weekly, prices are consolidating in a triangle and have the potential to bounce from our 1st support at 1784.333 in line with 61.8% Fibonacci extension towards our 1st resistance at 1848.842 in line with 78.6% Fibonacci retracement and 61.8% Fibonacci extension. Technical indicators are showing bullish momentum.
On the daily, prices are consolidating in a triangle. We see potential for a dip from our 1st resistance at 1828.775 in line with 61.8% Fibonacci retracement and 78.6% Fibonacci retracement towards our 1st support at 1799.226 in line with 38.2% Fibonacci retracement. Our bias is further supported by RSI at a level where dips previously occurred.
On the H4 chart, prices are abiding to our daily bearish trendline. We see potential for prices to dip from our 1st resistance at 1828.025 which is an area of Fibonacci confluences towards our 1st support at 1809.115 in line with 38.2% Fibonacci retracement. RSI is at a level where dips previously occurred. Alternatively, breaking our 1st resistance will find prices climbing further towards our 2nd resistance at 1832.860 which is a graphical overlap.
Areas of consideration:
- 4h 1st support at 1809.115
- 4h 1st resistance at 1828.025
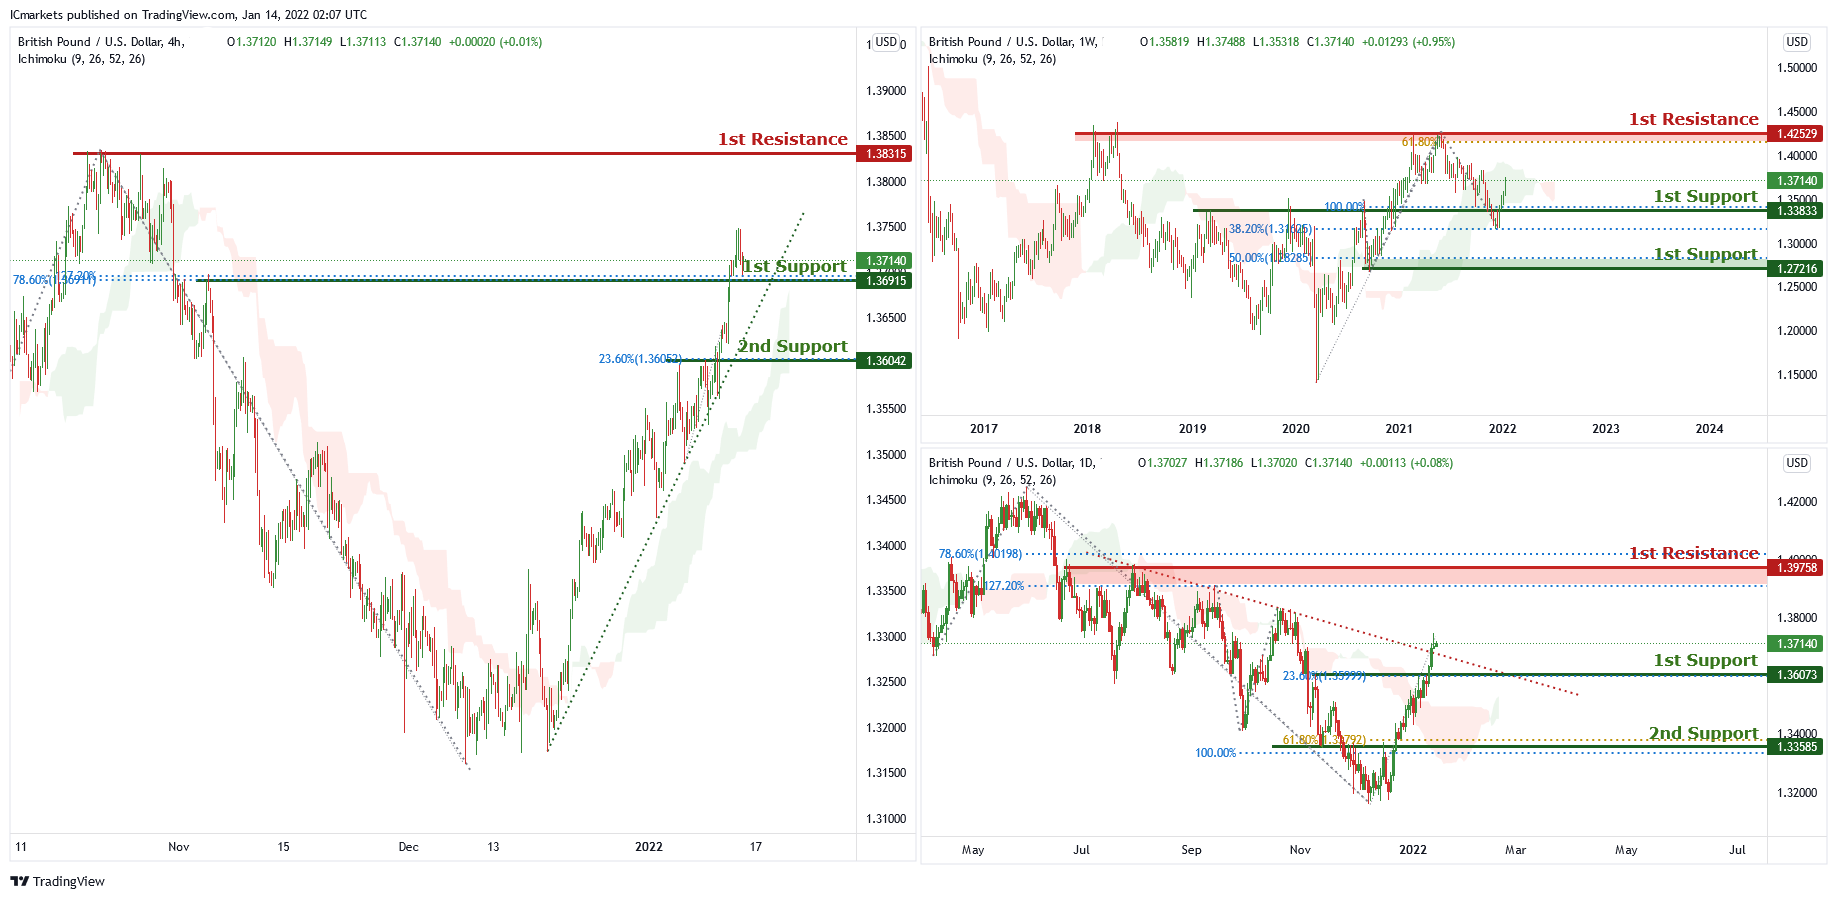
GBP/USD
On the weekly chart, price is near the support level of 1.33833 which is also 100% Fibonacci projection and 38.2% Fibonacci retracement. Price can potentially go to the 1st resistance level of 1.42529 which is also 61.8% Fibonacci projection and graphical swing high. Our bullish bias is supported by the ichimoku cloud indicator as price is trading above it.
On the daily chart price has recently broken out of the descending trendline and is near 1st support level of 1.36073 which is also 23.6% Fibonacci retracement. Price can potentially go to the 1st resistance level of 1.39758 which is also 78.6% Fibonacci retracement and 127.2% Fibonacci projection. Our bullish bias is supported by the ichimoku cloud indicator as price is trading above it.
On the H4 chart price is abiding by an ascending trendline and near the first support level of 1.36915 which is also 78.6%% Fibonacci retracement and 127.2% Fibonacci projection . Price can potentially go to the 1st resistance level of 1.38315 which is the graphical swing high level. Our bullish bias is supported by the ichimoku cloud indicator as price is trading above it.
Areas of consideration:
- H4 1st resistance at 1.38315
- H4 1st support 1.36915
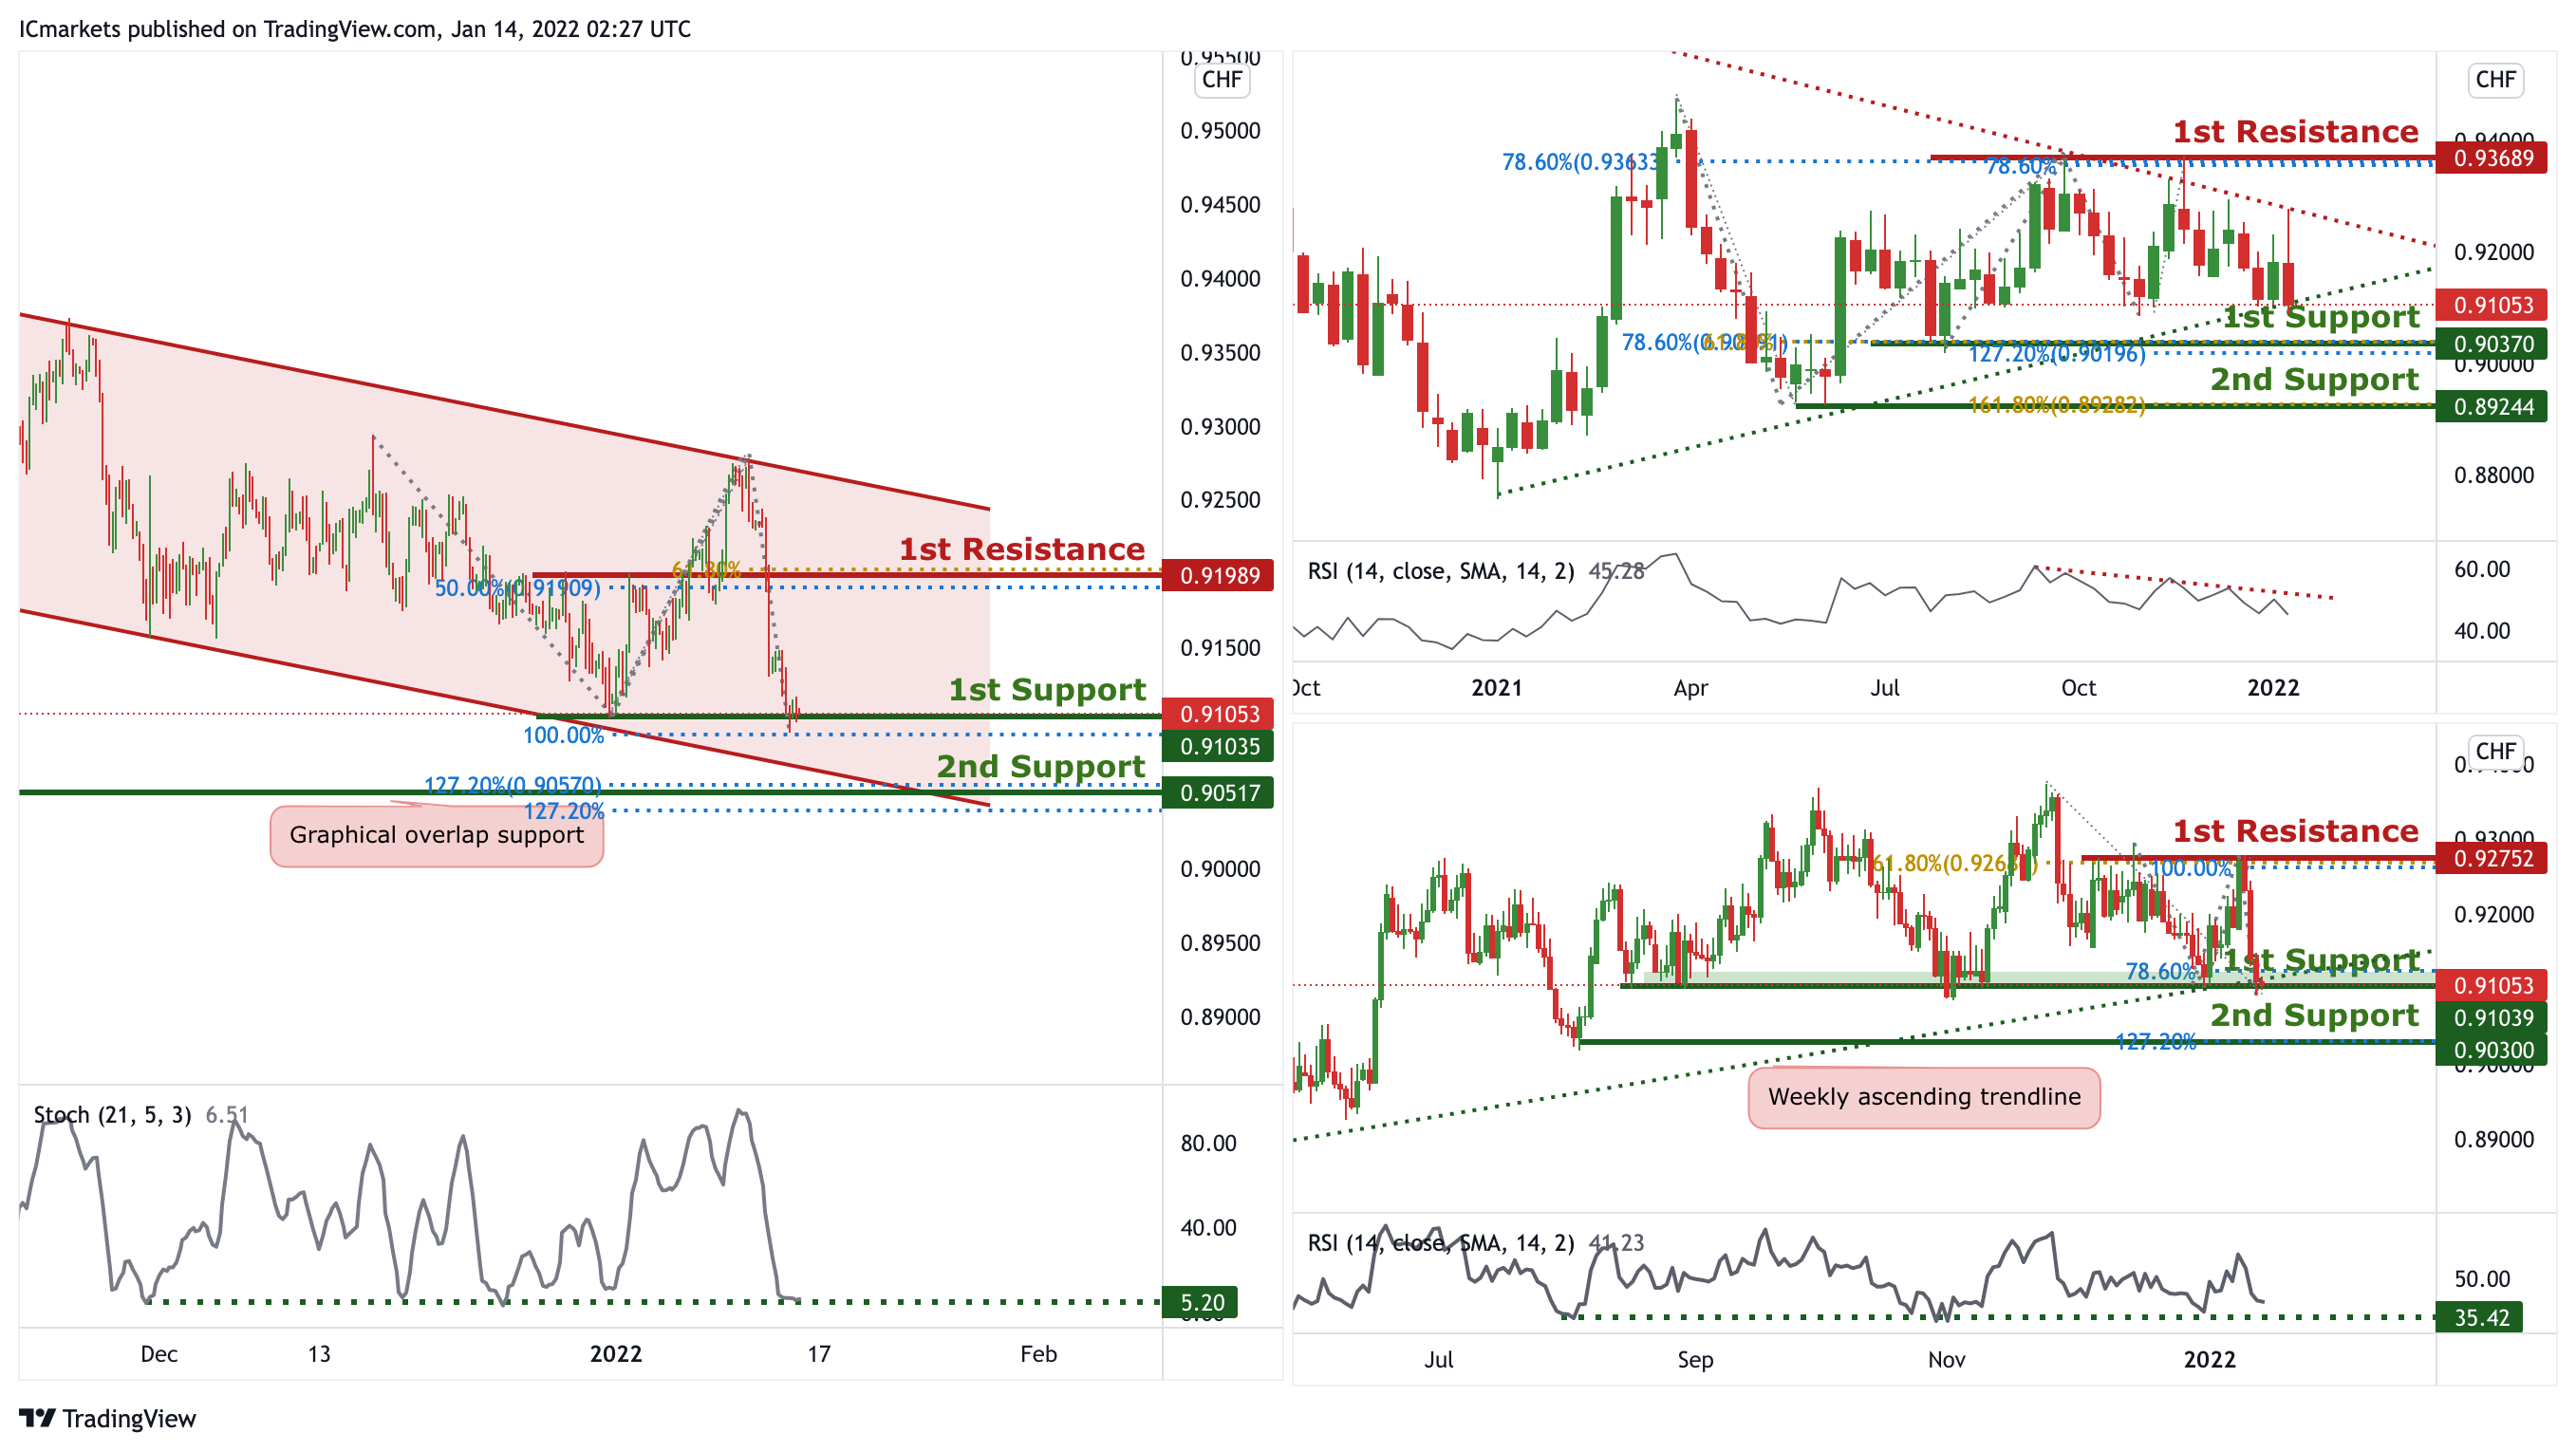
USD/CHF
On the Weekly timeframe, price is reacting in a triangle pattern. Traders should wait for the price to swing higher or lower before entering. On the Daily timeframe, price is abiding to the ascending trendline support on the weekly,we can expect an overall bullish momentum. Price could bounce from 1st Support in line with 78.6% Fibonacci retracement and 78.6% FIbonacci projection towards 1st Resistance in line with 61.8% Fibonacci retracement and 100% Fibonacci projection. Our bullish bias is further supported by the RSI indicator where it is at the support level.
On the H4 timeframe, price is abiding to a descending channel, signifying a bearish momentum. Price is approaching a support level, we can expect price to make a short-term bullish bounce in line with 78.6% Fibonacci Projection and 161.8% Fibonacci retracement towards 1st Resistance in line with 78.6% Fibonacci projection. Our short-term bullish bias is further supported by the stochastic indicator where the %K line is approaching the support level.
Areas of consideration:
- Watch 1st Support at 0.91113
- Watch 1st Resistance at 0.92698
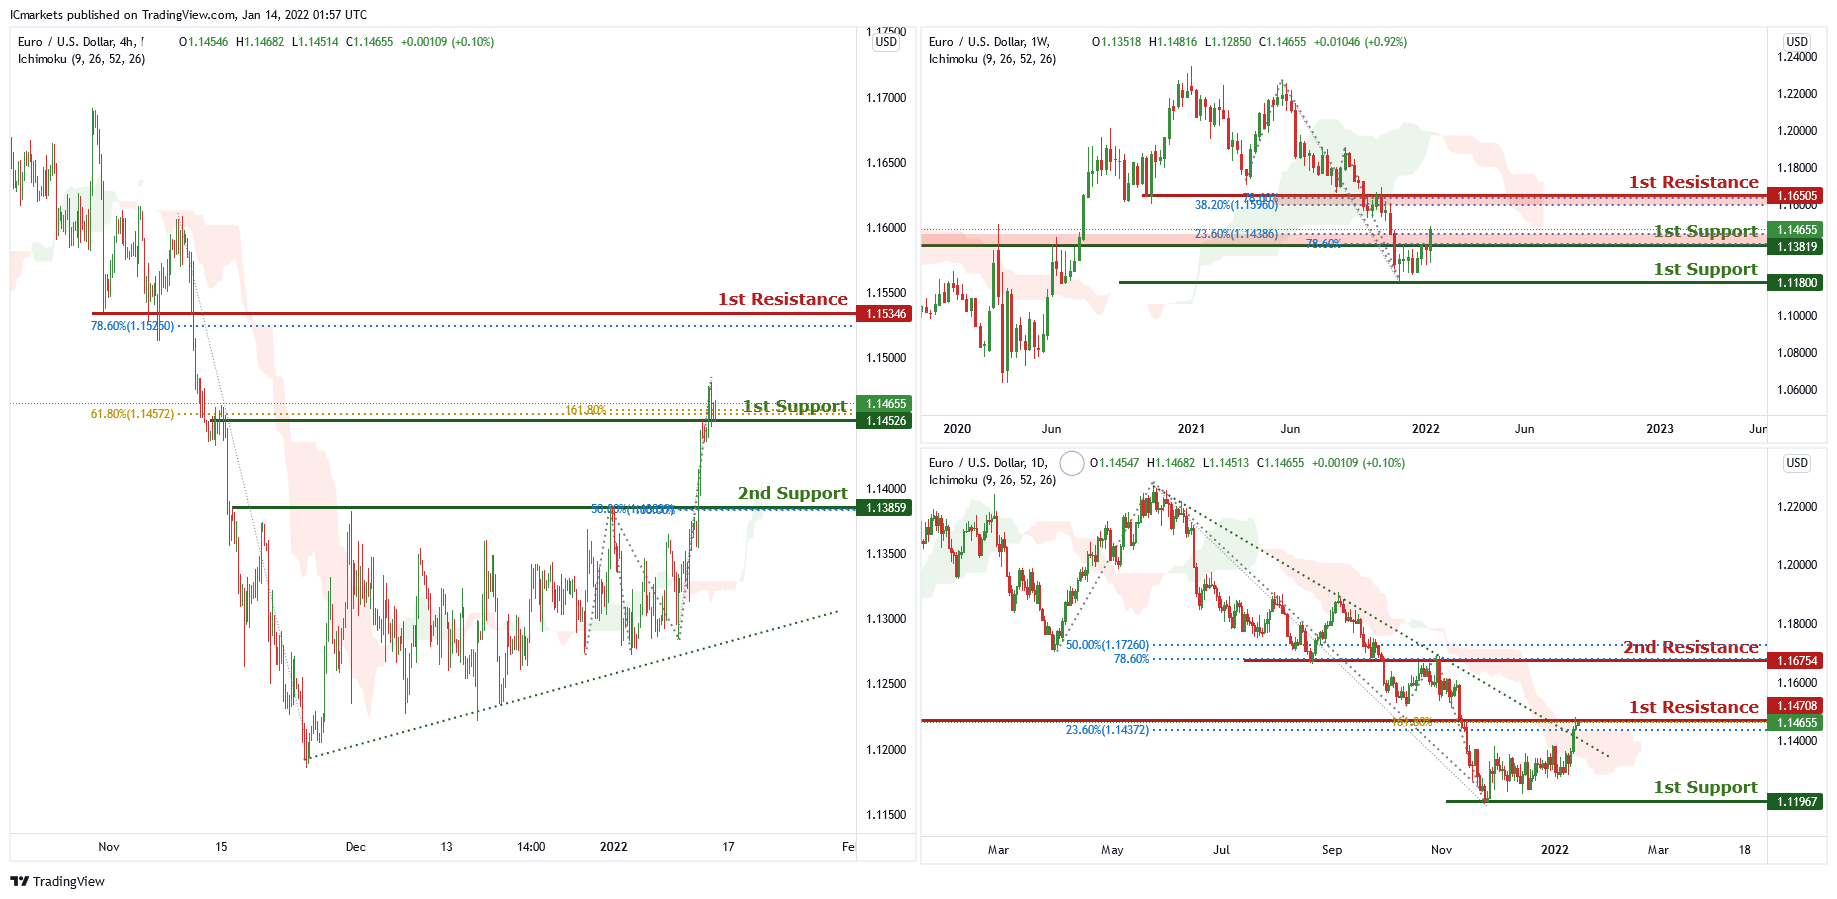
EUR/USD :
On the weekly chart, price is near the 1st support level of 1.13819 which is also 23.6% Fibonacci retracement and 78.6% Fibonacci projection. Price can potentially go to the 1st resistance level of 1.16505 which is also 78.6% Fibonacci projection and 38.2% Fibonacci retracement. Our bullish bias is supported by the stochastic indicator as it is near support level.
On the daily chart, price has recently broken out of the descending trendline and is near 1st resistance level of 1.14708 which is also 23.6% Fibonacci retracement. Price can potentially go to the graphical overlap resistance level of 1.16754 which is also 50% Fibonacci retracement and 78.6% Fibonacci projection. Our bullish bias is supported by the ichimoku cloud indicator as price is trading above it.
On the H4 chart , price is abiding by an ascending trendline and is near 1st support level of 1.14526 which is also 161.8% Fibonacci projection and 61.8% Fibonacci retracement. Price can potentially go to the 1st resistance level of 1.15346 which is also 78.6% Fibonacci retracement. Our bullish bias is supported by the ichimoku cloud indicator as price is trading above it.
Areas of consideration:
- H4 1st resistance at 1.15346
- H4 1st support at 1.14526
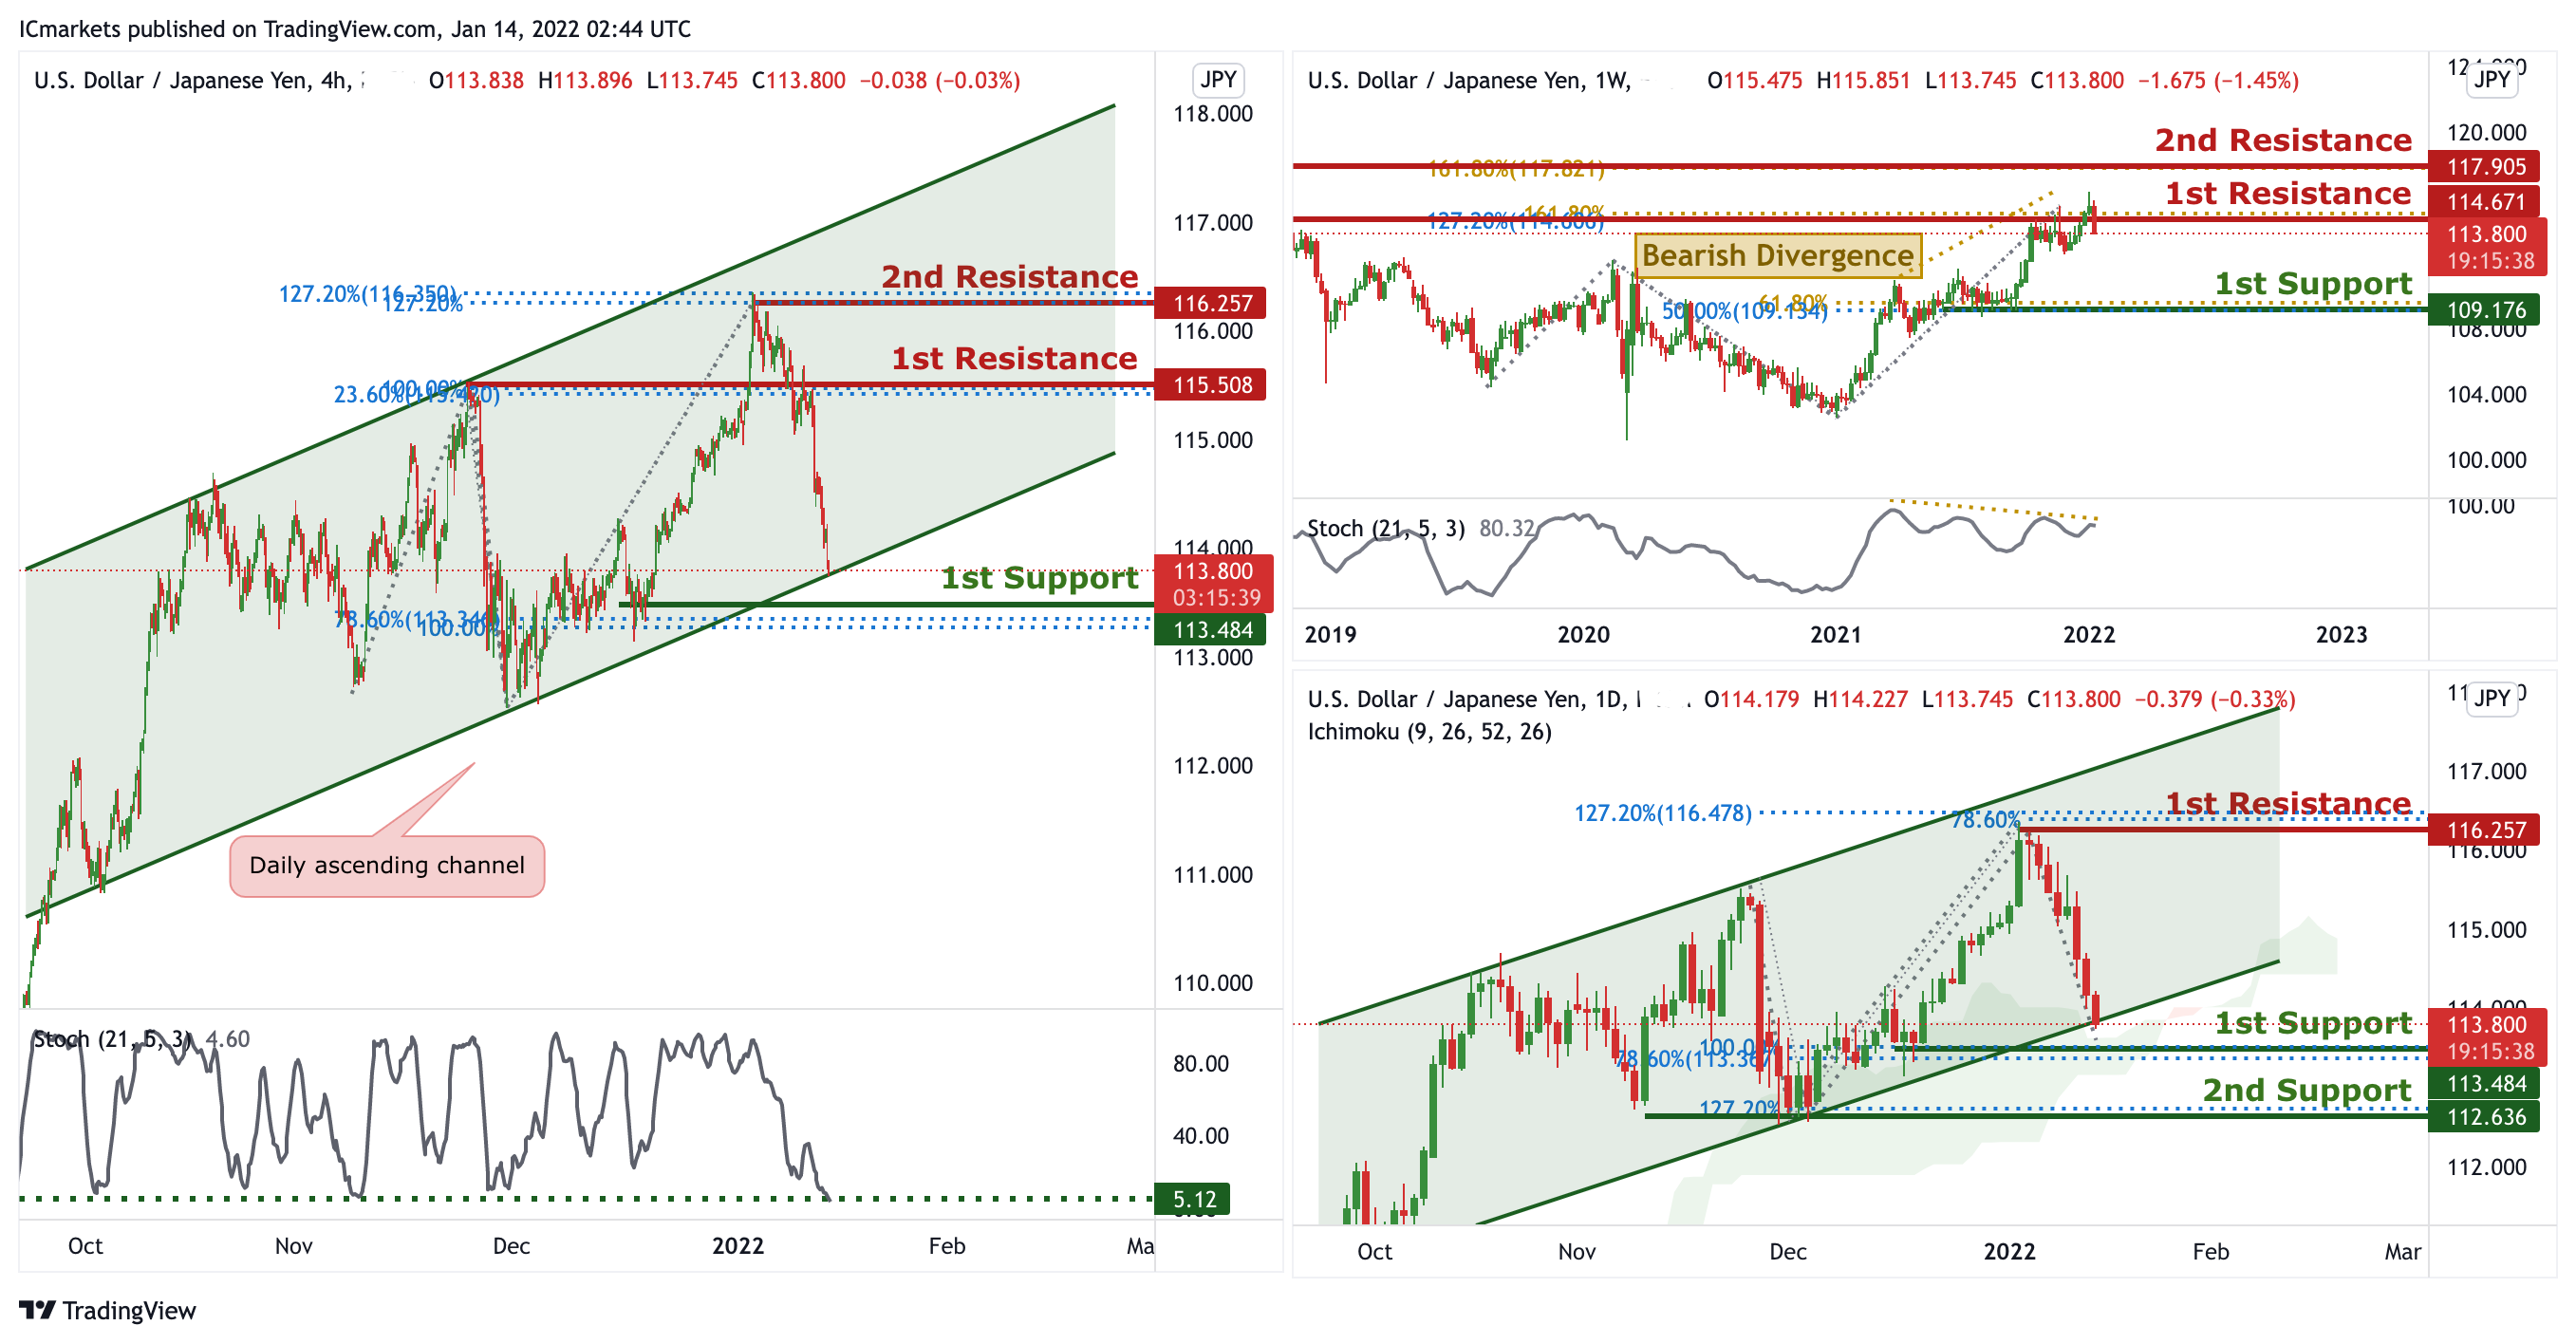
USD/JPY
On the Weekly timeframe, we can see that price touched the 1st resistance in line with horizontal swing highs and 127.2% FIbonacci Retracement and 161.8% Fibonacci Projection. We can expect the price to drop from the 1st Resistance towards the 1st Support in line with 61.8% Fibonacci projection and 50% Fibonacci retracement. Our short-term bearish momentum is further supported by the stochastic %K line holding below the descending trendline resistance and bearish divergence spotted. In reference to last week’s analysis, on the Daily timeframe price indeed dropped to the 1st Support. Price is now abiding to the ascending channel, we can expect price to bounce from 1st Support in line with 100% Fibonacci projection and 78.6% Fibonacci extension towards 1st Resistance in line with previous swing high, 127.2% Fibonacci expansion and 78,6% Fibonacci projection. Our bullish bias is further supported by the Ichimoku cloud acting as a support level.
In reference to yesterday’s analysis, price indeed moved down nicely to the 1st Support. On the H4 timeframe, is abiding to the ascending channel on the daily, signifying an overall bullish momentum. We can now expect price to bounce from 1st Support in line with daily support, 78.6% Fibonacci retracement and 100% FIbonacci projection. Our bullish bias is further supported by the stochastic indicator where the %K line is at the support level.
Areas of consideration:
- H4 1st resistance level 115.508
- H4 1st support level 113.484
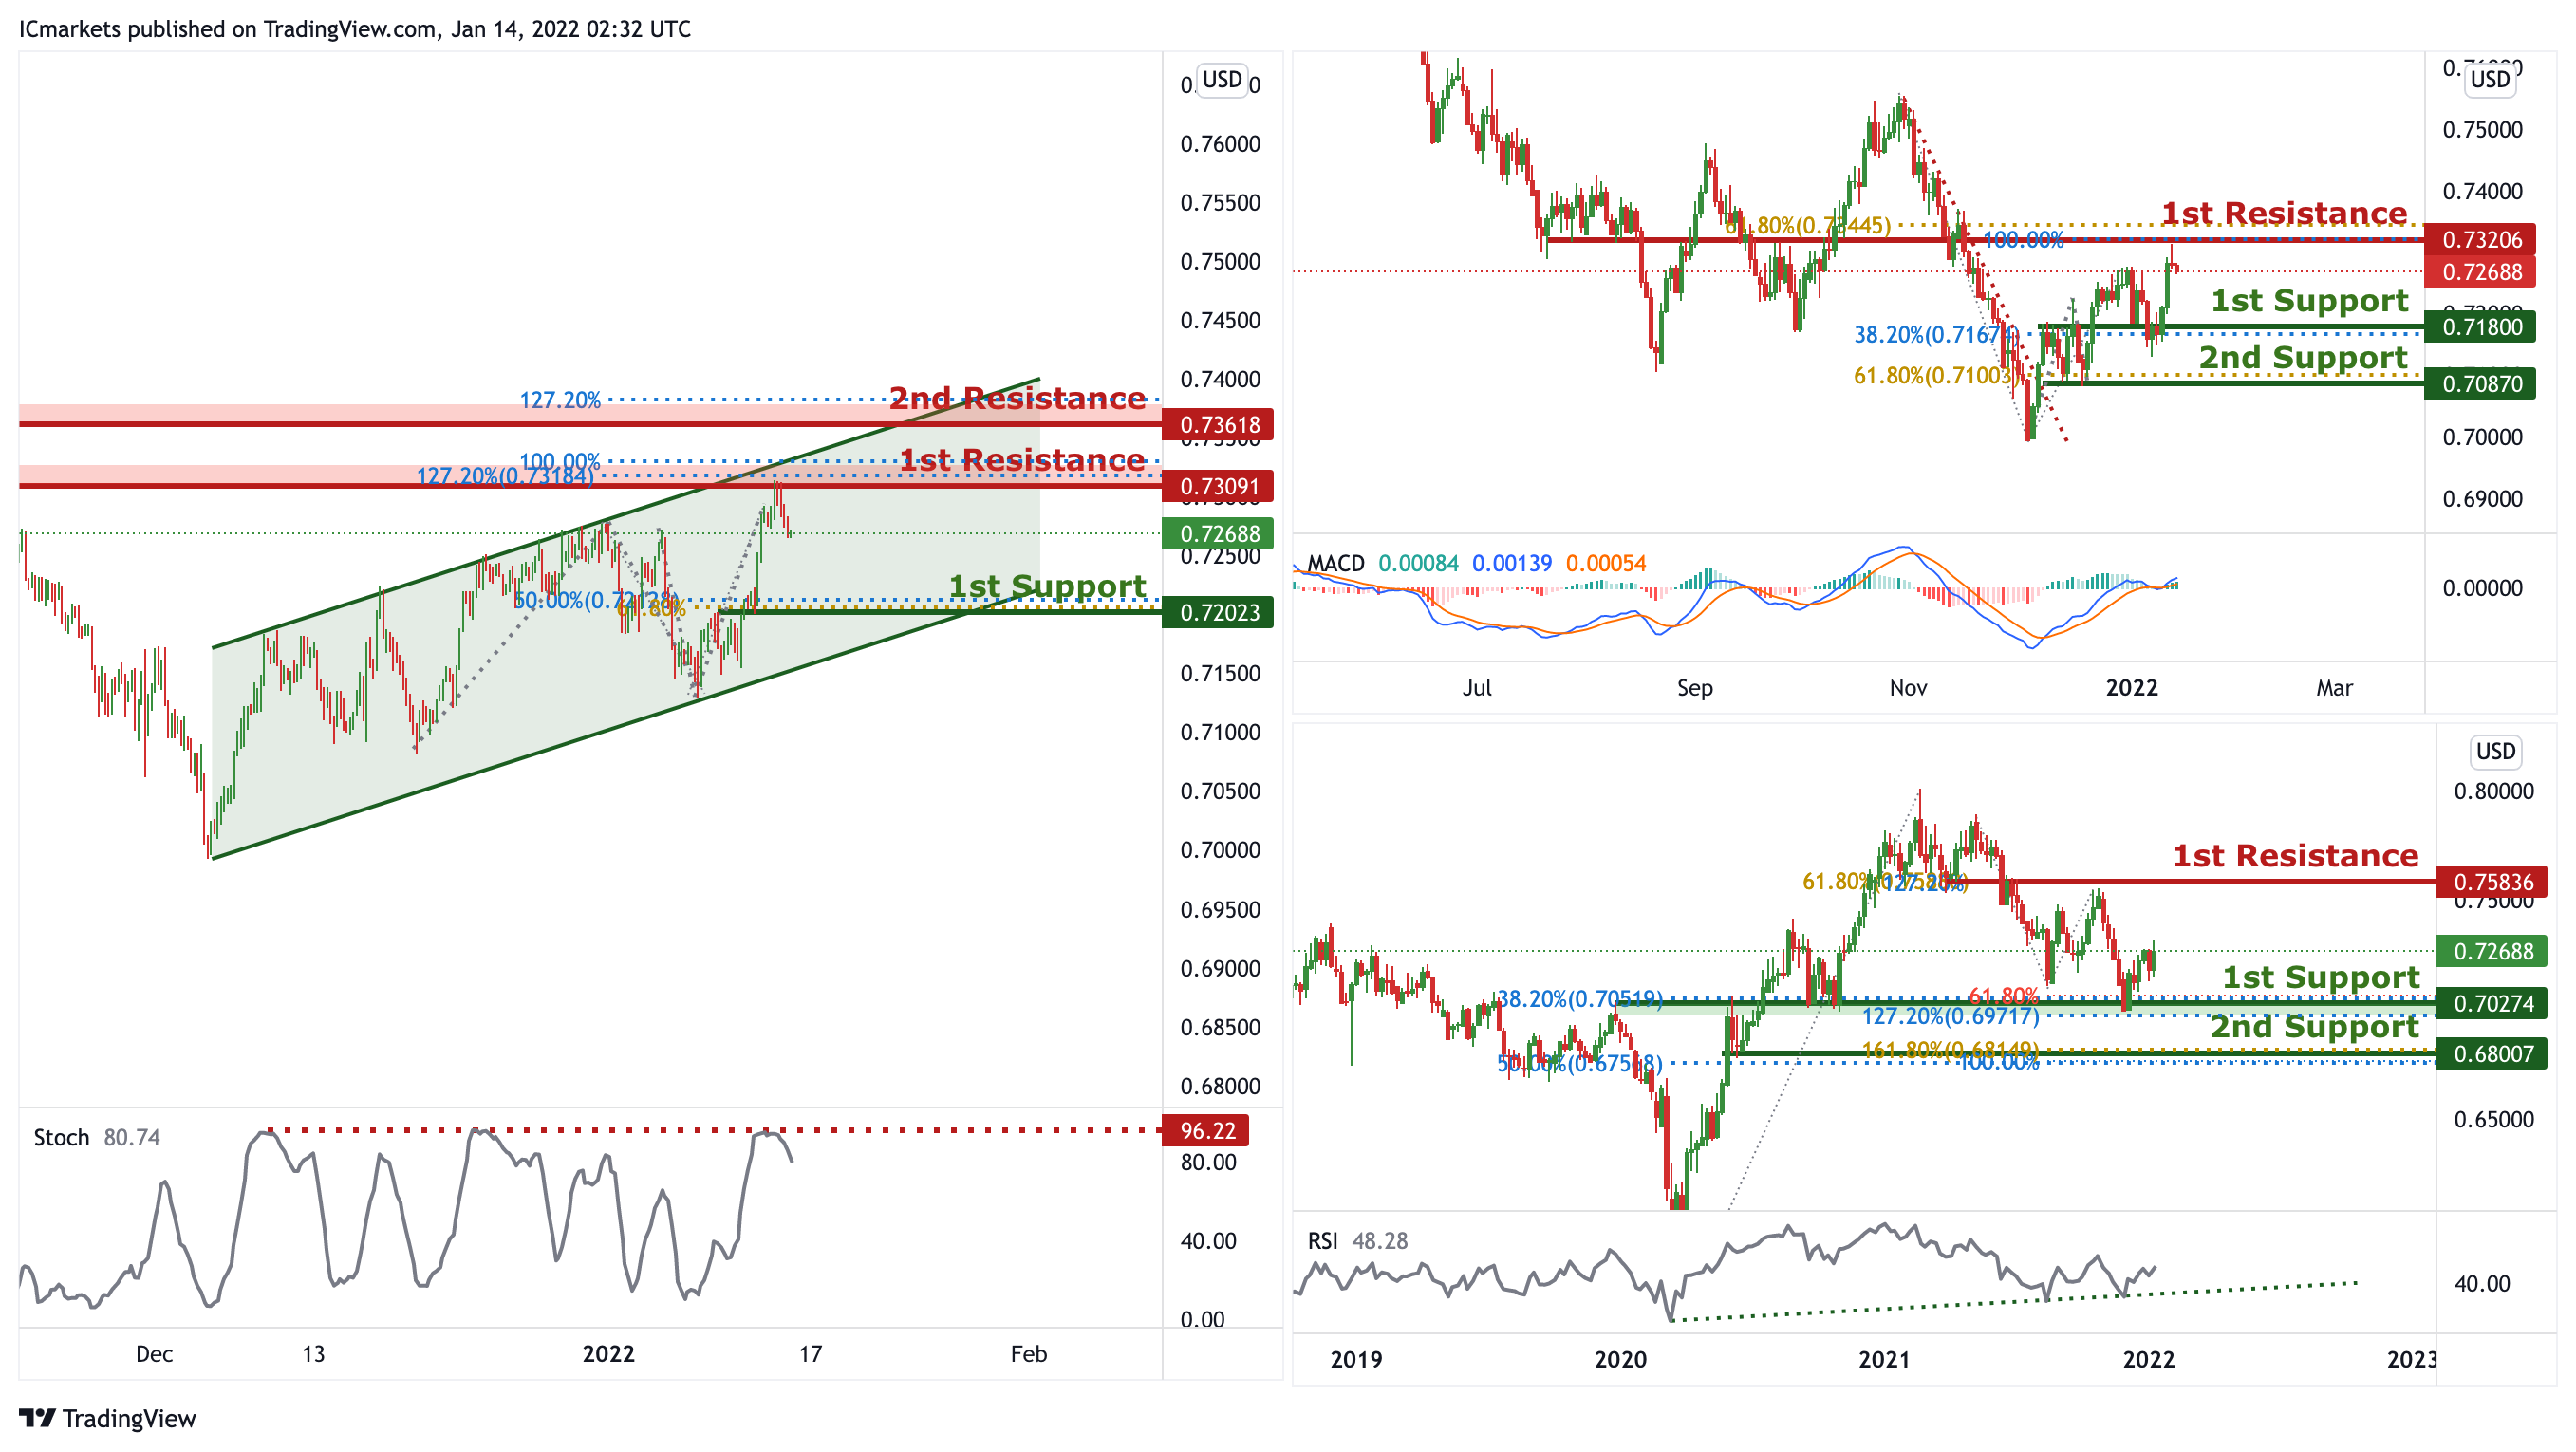
AUD/USD:
In reference to last week’s analysis, price has bounced nicely on the 1st Support. On the weekly, we can now expect the price to continue to push higher from the 1st Support in line with 61.8% Fibonacci projection, 38.2 % FIbonacci retracement and 127.2% Fibonacci extensions. Our bullish bias is further supported by the RSI indicator abiding to an ascending trendline. Traders should wait for prices to swing higher or lower before entering again. In reference to last week’s analysis price indeed bounced nicely on the 1st Support on the daily timeframe. On the Daily, the price is at the 1st support, we can expect the price to continue to push higher from 1st Support in line with 38.2% Fibonacci retracement towards 1st Resistance in line with 100% Fibonacci projection and 61.8% Fibonacci retracement. Our bullish bias is further supported by the MACD indicator where the MACD line is above the signal line.
On the H4, price is reacting within the ascending channel, signifying an overall bullish momentum. Price is approaching the 1st Resistance, we can expect to see price make a short-term bearish drop from 1st Resistance in line with 127.2% Fibonacci extension and 100% Fibonacci projection towards 1st Support in line with 50% Fibonacci retracement and 61.8% Fibonacci projection. Our short-term bearish bias is further supported by the stochastic indicator where the %K line is at the resistance level.
Areas of consideration:
- H4 1st Support level 0.72023
- H4 1st resistance level 0.73091
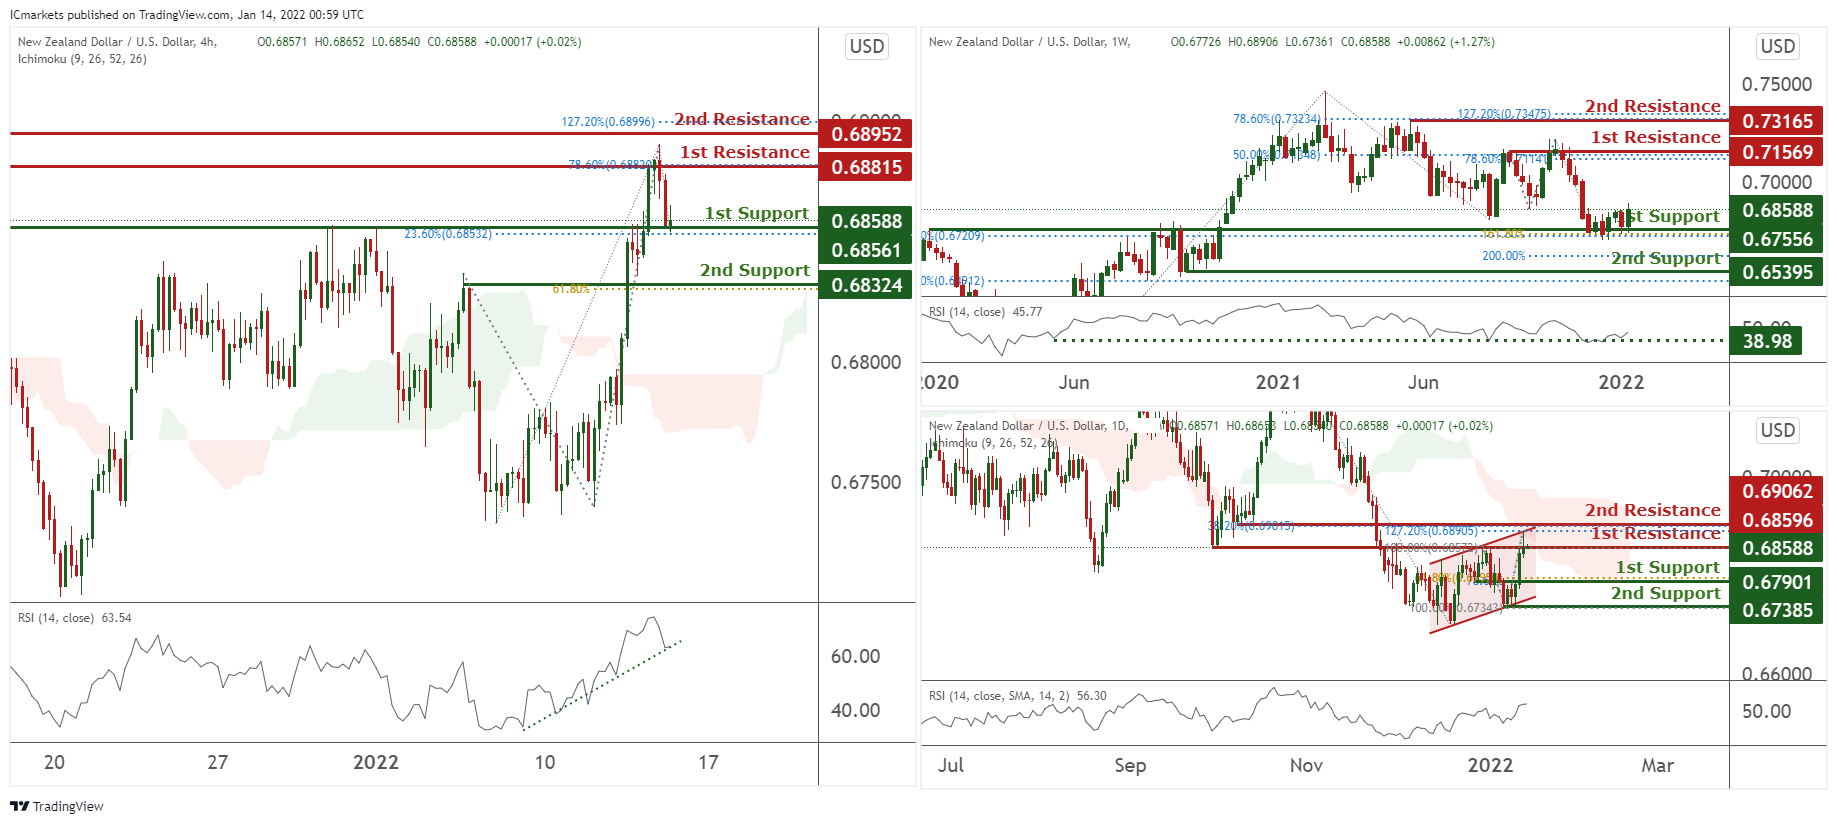
NZD/USD:
On the weekly, prices are on a bullish momentum. We see potential for a bounce at 1st support at 0.67556 in line with 23.6% Fibonacci retracement towards 1st resistance at 61.8% Fibonacci retracement. Technical indicators are showing bullish momentum. Alternatively, if prices break our 1st support, we might find it dipping towards our 2nd support at 0.69794 in line with 61.8% and 78.6% Fibonacci retracement.
On the daily, prices are consolidating in a channel. We see potential for prices to dip from our 1st resistance at 0.68596 in line with 100% Fibonacci retracement towards our 1st support at 0.67901 in line with 61.8% Fibonacci retracement. Ichimoku clouds are forecasting the dips.
On the H4 timeframe, prices are at a daily support and strong graphical overlap. We see potential for prices to bounce from our 1st support at 0.68588 in line with 23.6% Fibonacci retracement towards our 1st resistance at 0.68815 in line with 78.6% Fibonacci extension. Our bias is further supported by the Ichimoku Clouds forecasting bullish momentum and also RSI portraying an upward trend. If prices break our 1st support, we can potentially find prices dipping towards our 2nd support at 0.68324 in line with 61.8% Fibonacci retracement.
Areas of consideration:
- H4 time frame, 1st resistance at 0.68815
- H4 time frame, 1st support at 0.68588
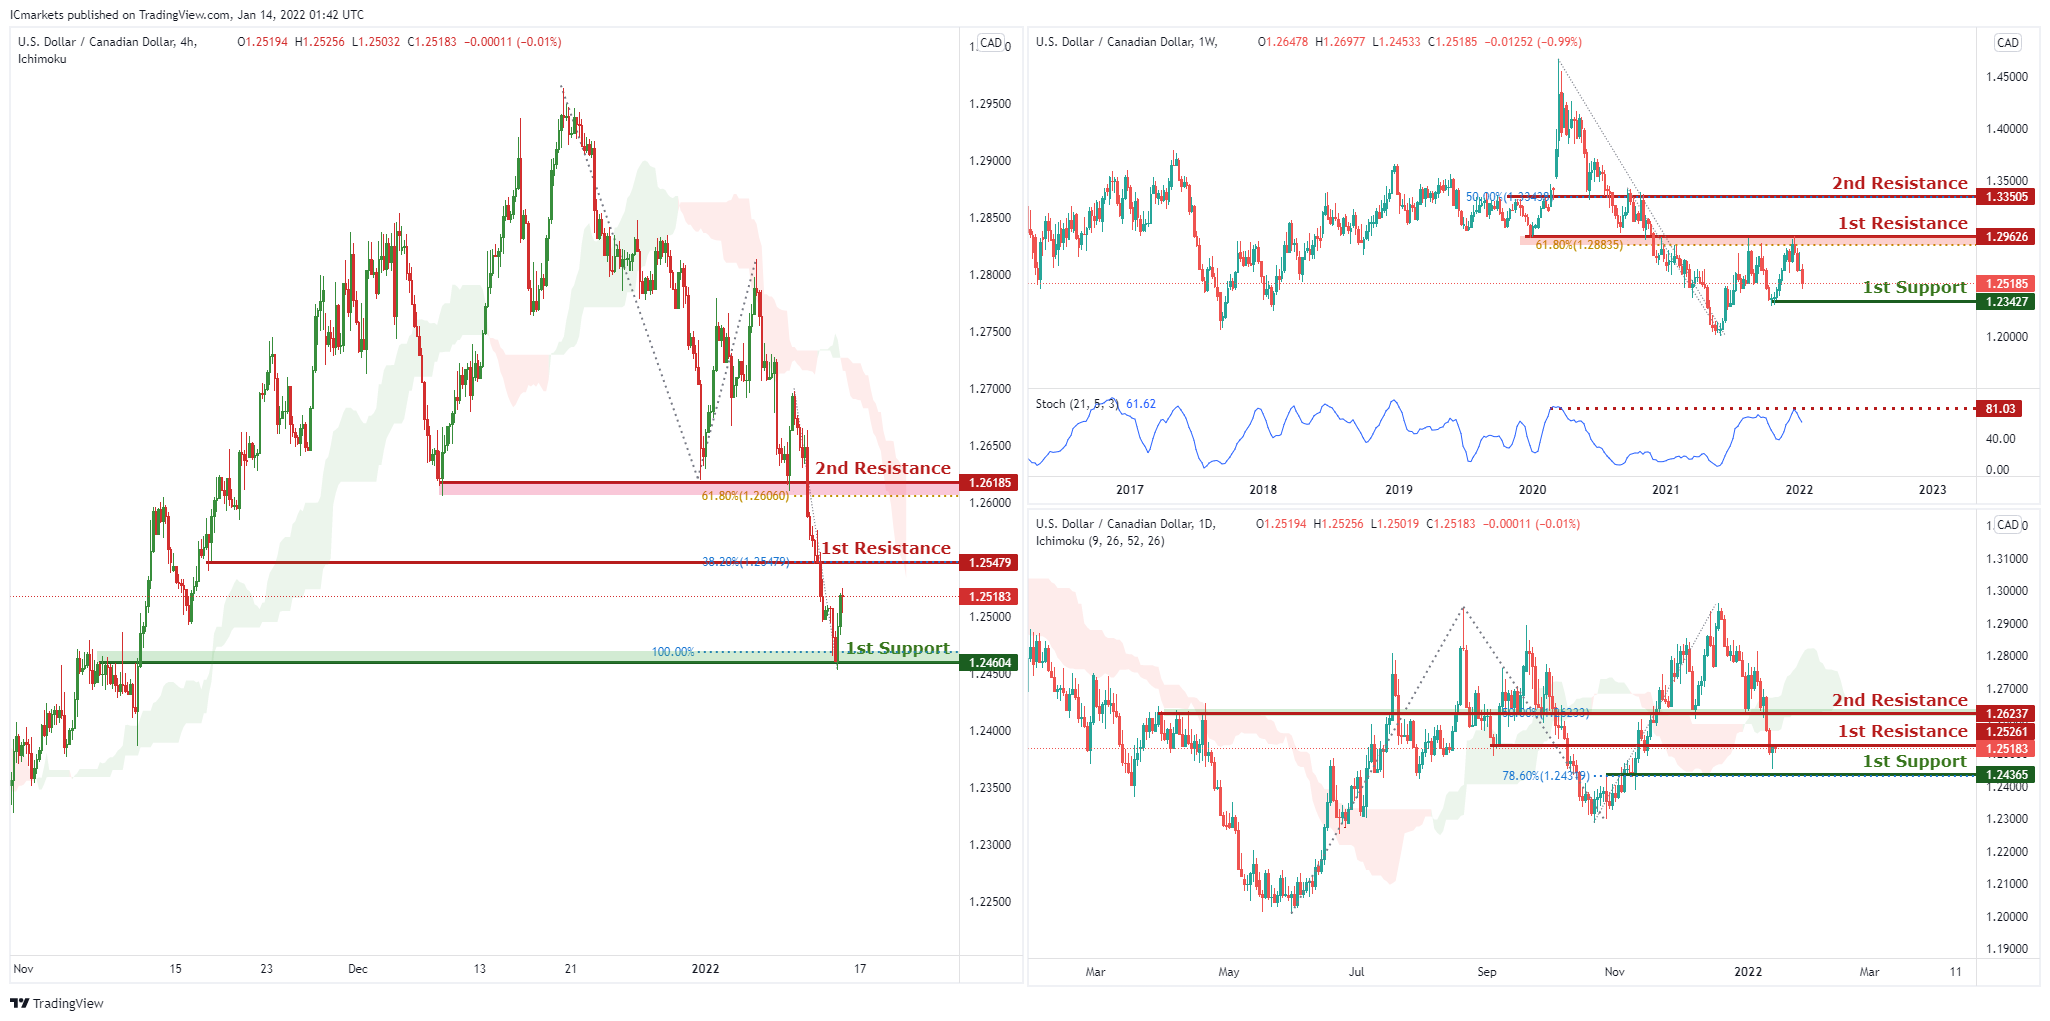
USD/CAD:
On the Weekly, with price reversing from the resistance of the stochastics, we have a bearish bias that price will from from our 1st resistance at 1.29626 which is in line with horizontal overlap resistance and 61.8% Fibonacci retracement to 1st support at 1.23427, which is in line with horizontal swing low support. Alternatively, price may break 1st resistance structure and head for 2nd resistance at 1.33505, which coincides with horizontal overlap resistance and 50% Fibonacci retracement.
On the Daily, with price moving below the ichimoku cloud, we have a bearish bias that price will from from our 1st resistance at 1.25261 which is in line with horizontal overlap resistance to 1st support at 1.24365, which is in line with horizontal overlap support and 78.6% Fibonacci retracement level. Alternatively, price may break 1st resistance structure and head for 2nd resistance at 1.26237, which coincides with horizontal overlap resistance and 50% Fibonacci retracement.
On the H4, with price moving below the ichimoku cloud, we have a bearish bias that price will from from our 1st resistance at 1.25479 which is in line with horizontal overlap resistance and 38.2% Fibonacci retracement to 1st support at 1.24604, which is in line with horizontal overlap support and 100% Fibonacci projection level. Alternatively, price may break 1st resistance structure and head for 2nd resistance at 1.26185, which coincides with horizontal overlap resistance and 61.8% Fibonacci retracement.
Areas of consideration:
- H4 time frame, 1st support at 1.24604
- H4 time frame, 1st resistance at 1.25479
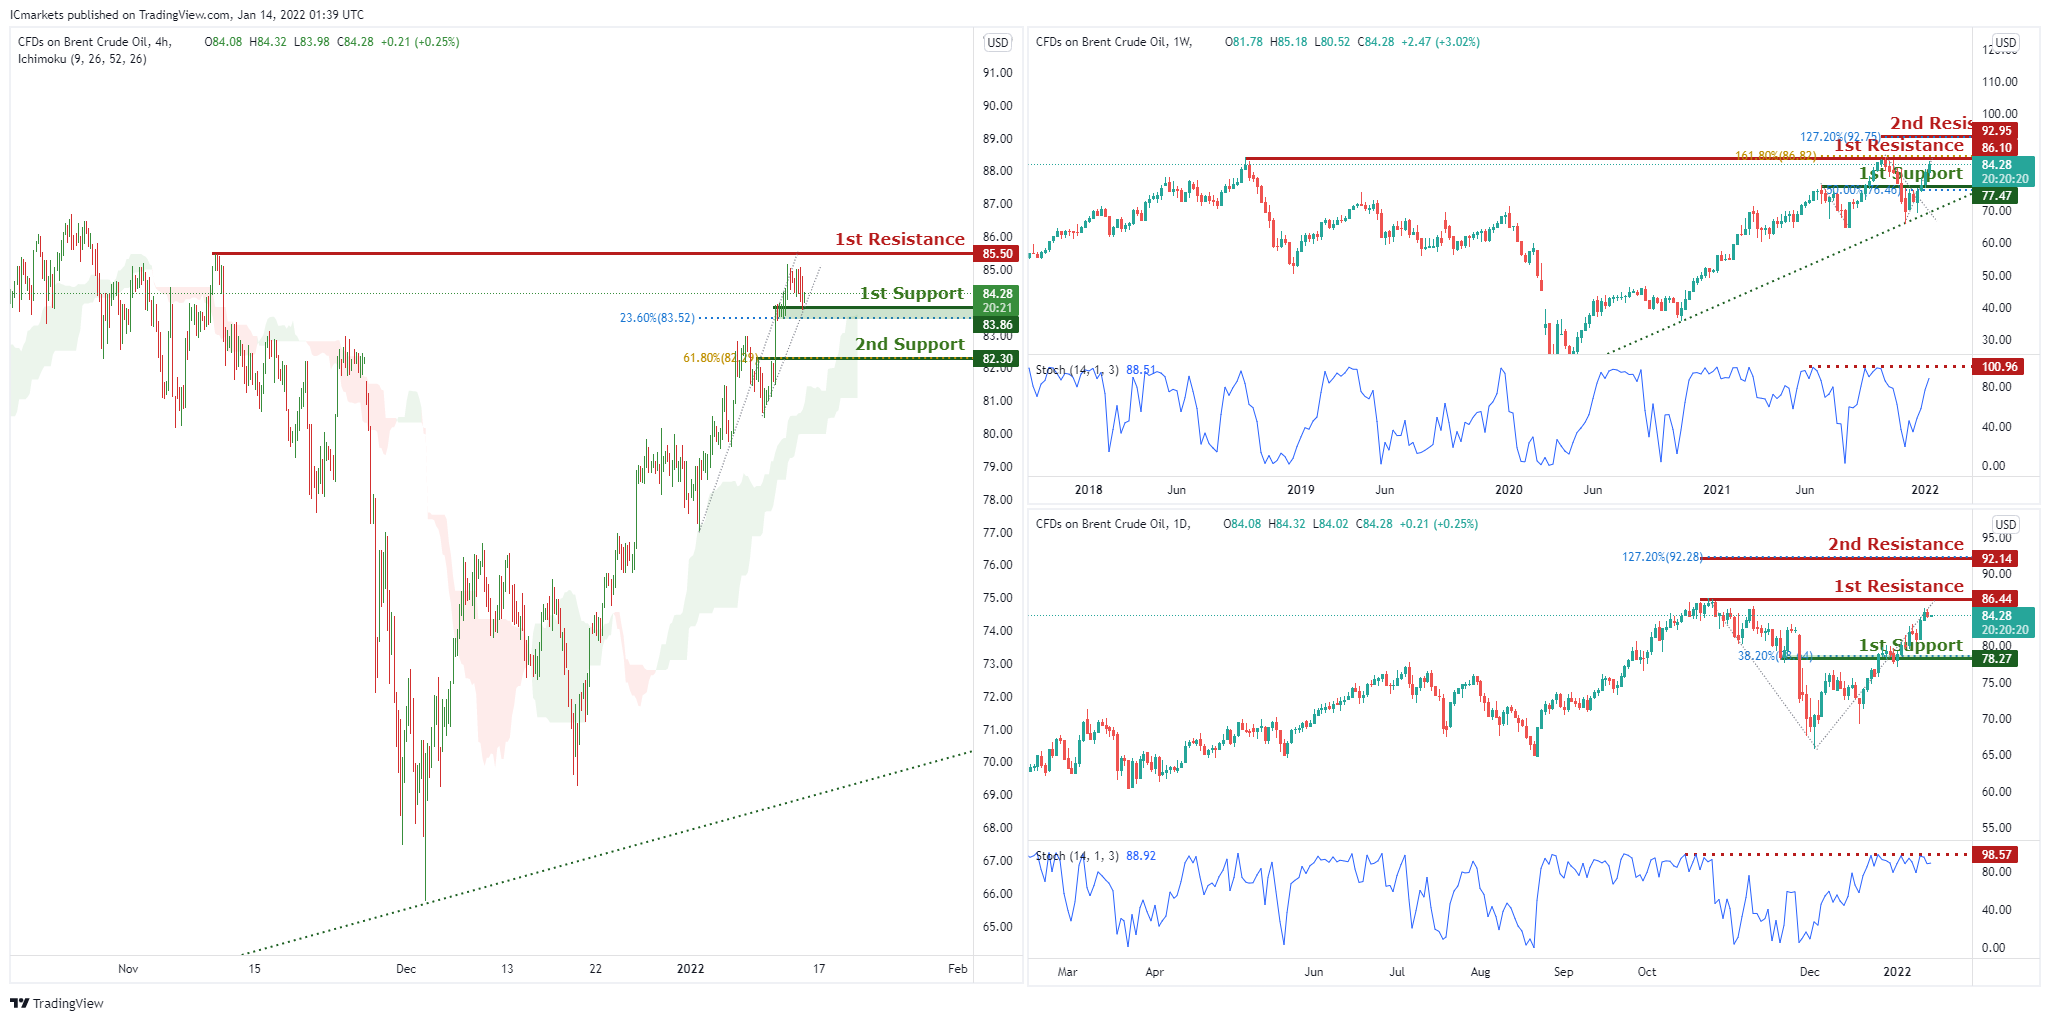
OIL:
On the Weekly, with price approaching the resistance of the stochastics, we have a bearish bias that price will from from our 1st resistance at 86.10 which is in line with horizontal swing high resistance and 161.8% Fibonacci projection to 1st support at 77.47, which is in line with horizontal overlap support and 50% Fibonacci retracement level. Alternatively, price may break 1st resistance structure and head for 2nd resistance at 92.95, which coincides with horizontal swing high resistance and 127.2% Fibonacci extension level.
On the Daily, with price at the resistance of the stochastics zone, we have a bearish bias that price will from from our 1st resistance at 86.44 which is in line with horizontal swing high resistance to 1st support at 78.27, which is in line with horizontal overlap support and 38.2% Fibonacci retracement level. Alternatively, price may break 1st resistance structure and head for 2nd resistance at 92.14, which coincides with horizontal swing high resistance and 127.2% Fibonacci extension level.
On the H4, with price moving above the ichimoku cloud, we have a bullish bias that price will rise to our 1st resistance at 85.5 which is in line with horizontal swing high resistance from 1st support at 83.86, which is in line with horizontal overlap support and 23.6% Fibonacci retracement level. Alternatively, price may break 1st support structure and head for 2nd support at 82.30, which coincides with horizontal swing low support and 61.8% Fibonacci retracement level .
Areas of consideration:
- H4 time frame, 1st resistance of 85.5
- H4 time frame, 1st support of 83.86
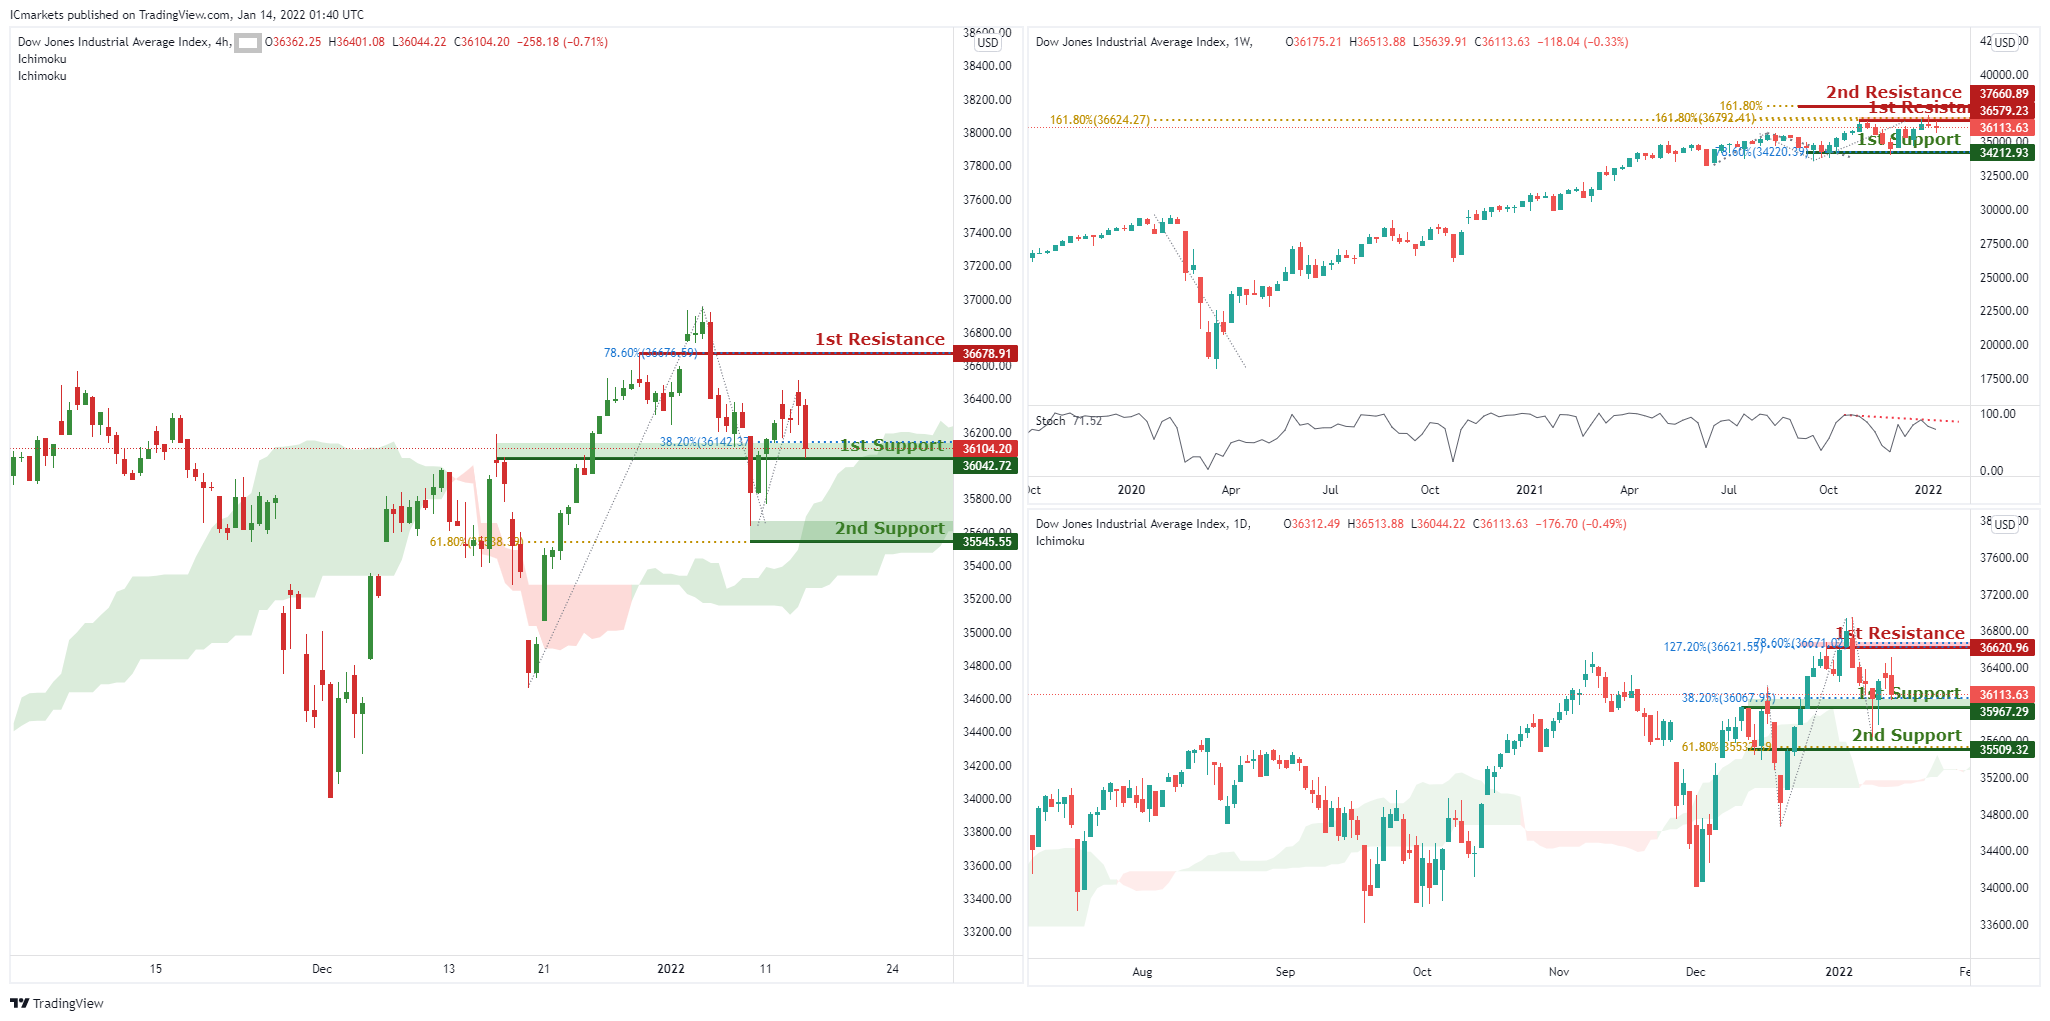
Dow Jones Industrial Average:
On the Weekly, with price reacting off the resistance of the stochastics, we have a bearish bias that price will from from our 1st resistance at 36579 which is in line with horizontal swing high resistance and 161.8% Fibonacci projection level to 1st support at 34212, which is in line with horizontal swing low support and 78.6% Fibonacci retracement level. Alternatively, price may break 1st resistance structure and head for 2nd resistance at 37660, which coincides with horizontal swing high resistance and 161.8% Fibonacci projection level.
On the Daily, with price moving above the ichimoku cloud, we have a bullish bias that price will rise to our 1st resistance at 36620 which is in line with horizontal swing high resistance, 78.6% Fibonacci projection and 127.2% Fibonacci extension from 1st support at 35967, which is in line with horizontal overlap support and 38.2% Fibonacci retracement level. Alternatively, price may break 1st support structure and head for 2nd support at 35509, which coincides with horizontal overlap support and 61.8% Fibonacci retracement level.
On the H4, with price moving above the ichimoku cloud, we have a bullish bias that price will rise to our 1st resistance at 36678 which is in line with horizontal swing high resistance and 78.6% Fibonacci retracement level from 1st support at 36042, which is in line with horizontal overlap support and 38.2% Fibonacci retracement level. Alternatively, price may break 1st support structure and head for 2nd support at 35545, which coincides with horizontal swing low support and 61.8% Fibonacci retracement level.
Areas of consideration:
- H4 time frame, 1st resistance of 36678
- H4 time frame, 1st support of 36042
The accuracy, completeness and timeliness of the information contained on this site cannot be guaranteed. IC Markets does not warranty, guarantee or make any representations, or assume any liability regarding financial results based on the use of the information in the site.
News, views, opinions, recommendations and other information obtained from sources outside of www.icmarkets.com.au, used in this site are believed to be reliable, but we cannot guarantee their accuracy or completeness. All such information is subject to change at any time without notice. IC Markets assumes no responsibility for the content of any linked site.
The fact that such links may exist does not indicate approval or endorsement of any material contained on any linked site. IC Markets is not liable for any harm caused by the transmission, through accessing the services or information on this site, of a computer virus, or other computer code or programming device that might be used to access, delete, damage, disable, disrupt or otherwise impede in any manner, the operation of the site or of any user’s software, hardware, data or property.


