
Key risk events:
German Prelim GDP q/q; US Core Retail Sales m/m; US Retail Sales m/m; US Prelim UoM Consumer Sentiment.
(Previous analysis as well as outside sources – italics).
EUR/USD:
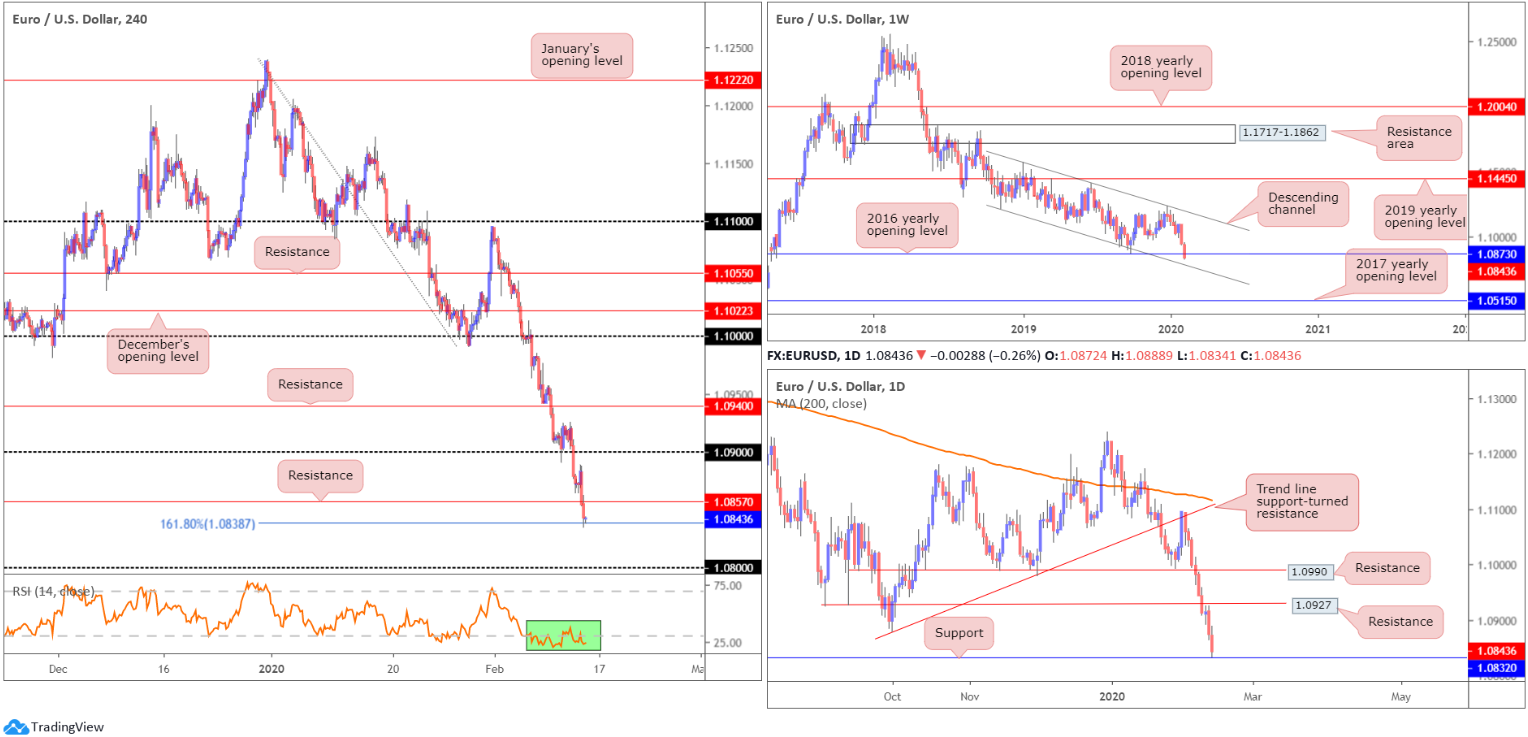
EUR/USD held on to the bulk of its losses Thursday after breaching H4 support at 1.0857, consequently shaking hands with a 161.8% Fibonacci extension at 1.0838. Yesterday’s descent, aside from a brief pause on February 11th, registered its eighth successive decline. The US dollar index continues to firm north of 99.00, despite dipping to lows of 98.85 during the session. Indicator-based traders might also be interested to note the EUR/USD’s relative strength index (RSI) has remained within oversold waters since February 6th.
On the data front, US headline inflation for January ticked lower by 0.1% vs. the 0.2% consensus. Core US inflation, excluding food and energy, reported a 0.2% increase, but fell in-line with expectations.
Further afield, technically, weekly price brushed aside support at 1.0873, the 2016 yearly opening level, and revealed a potential ‘floor’ nearby off channel support, taken from the low 1.1109. However, as of current price, this is not expected to enter the fold until around the 1.0780ish neighbourhood, assuming a continued decline.
The story on the daily timeframe has the unit hovering north of support coming in at 1.0832, following a near-retest at resistance drawn from 1.0927 on Wednesday.
Areas of consideration:
With price crossing the 2016 yearly opening level at 1.0873, further selling on the weekly timeframe is certainly a possibility, at least until we reach channel support around the 1.0780 region. Daily support at 1.0832 could spark some interest, though given the euro’s weakness over the past weeks, its unlikely to hold. The same can be said for the 161.8% H4 Fibonacci extension at 1.0838. H4 resistance at 1.0857 is likely going to be a tough nut to crack in the event we pull higher.
Therefore, traders may look for bearish scenarios south of daily support 1.0832, targeting the 1.08 handle on the H4. 1.08, while a downside target, is also a potential barrier of support, having seen channel support on the weekly timeframe position itself 20 points beneath the round number.
GBP/USD:
Sterling firmed against its US counterpart Thursday, driven by UK politics. According to The Guardian, Sajid Javid resigned as chancellor after Boris Johnson asked him to sack all his advisers in a move by No 10 to seize control of the Treasury. Javid has been replaced by his deputy, Rishi Sunak, the chief secretary to the Treasury, who is a favourite within No 10.
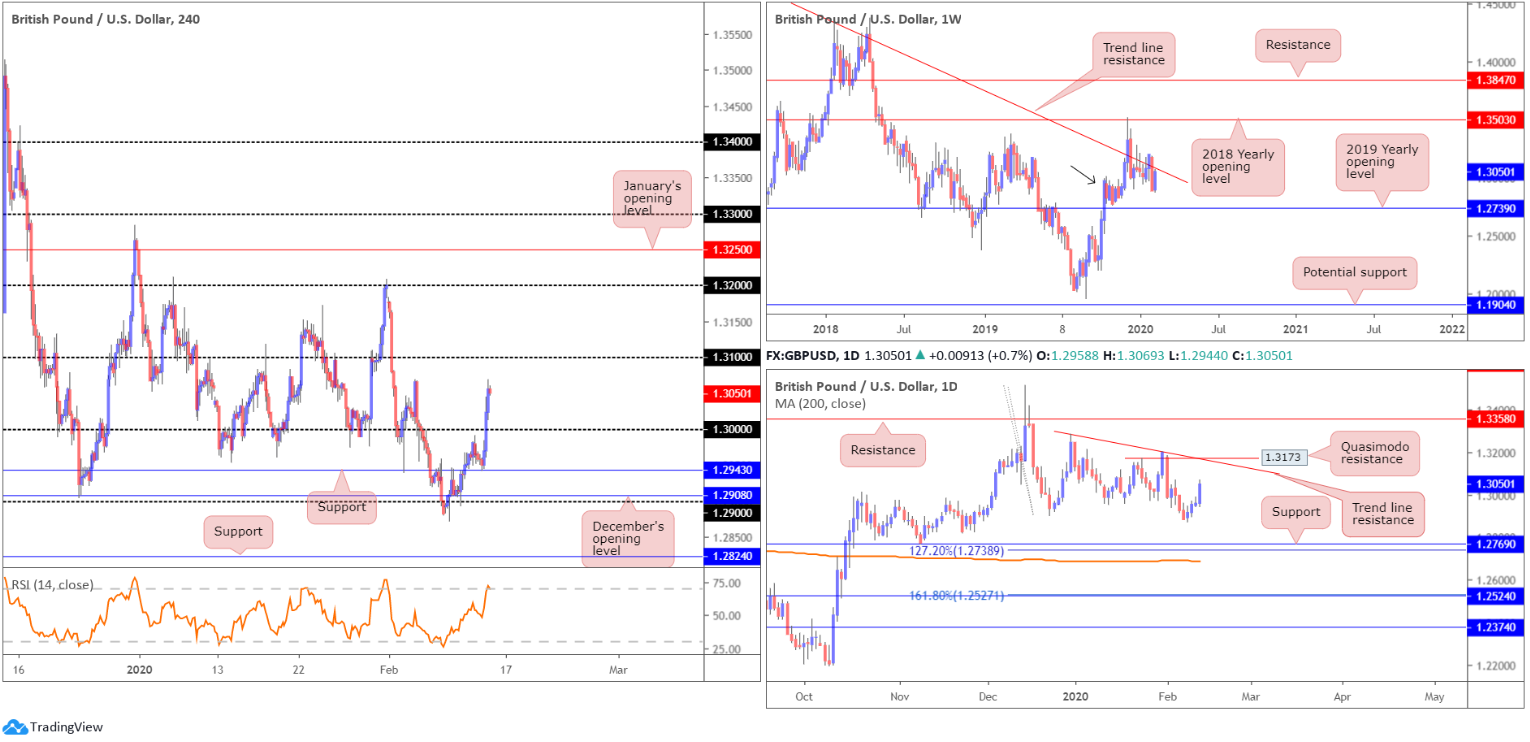
1.30 surrendered mid-way through London, with price clocking the 1.3069 February 5th high. Beyond here, limited resistance is in sight until reaching 1.31 on the H4 timeframe. Note the said psychological boundary offered reasonably strong support/resistance over the past couple of months. In addition, the relative strength index (RSI) recently entered overbought territory.
On a wider perspective, daily price displays scope to climb further, targeting trend line resistance, etched from the high 1.3284, with a break exposing nearby Quasimodo resistance at 1.3173.
From the weekly timeframe, price action trades beneath long-standing trend line resistance, pencilled in from the high 1.5930, though demand around the 1.2939 region is also still in motion (black arrow). Continued downside may imply a break of the said demand, tripping sell stops and testing the 2019 yearly opening level at 1.2739. A break higher, on the other hand, could see the 2018 yearly opening level enter the fight at 1.3503.
Areas of consideration:
The 1.31 handle on the H4 may entice selling, in the event of a test, knowing we’re trading nearby the current weekly trend line resistance.
A retest at the 1.30 handle may also occur, though 1.31 is the more prominent base given its connection to weekly structure.
Both psychological levels are prone to whipsaws, owing to the number of orders typically assembling around these figures. Traders looking to fade either level today are urged to wait for additional candlestick confirmation to form before pulling the trigger. This helps identify buyer/seller intent and provides entry/risk levels to work with.
AUD/USD:
Early trade observed the Australian dollar turn south vs. the US dollar Thursday, scoring a session low at 0.6707. MI consumer inflation expectations out of Australia came in lower, decreasing by 0.7% in February to 4.0%. Alongside this, the Reserve Bank of Australia Governor Lowe noted the coronavirus is having an uncertain impact on the economy.
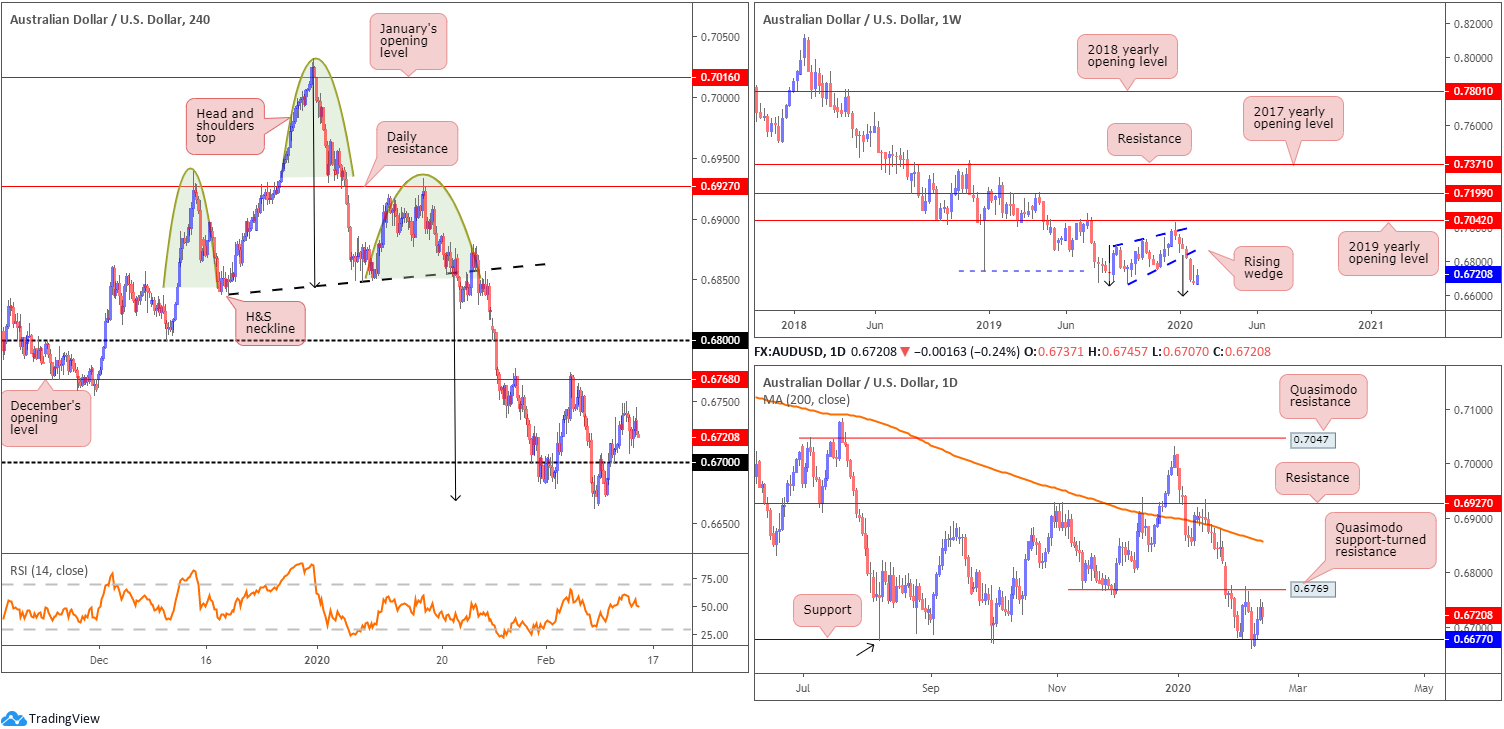
The H4 head and shoulders top in January finally hit the H&S take-profit target at 0.6668 (black arrows – calculated by taking the distance between the head and the neckline and adding it to the breakout point) late last week. It took nearly three weeks to complete. Well done to any readers who held tight.
As you can see, price has remained firm since testing the H&S take-profit target and meanders north of the 0.67 handle, faced with the possibility of a run to December’s opening level at 0.6768.
Going forward, the weekly timeframe portends further selling:
Since registering a bottom in late September at 0.6670 (2019), price carved out a rising wedge formation, typically considered a continuation pattern within a trending environment. The past six weeks witnessed price decline back into the rising wedge and, thanks to recent selling, break and extend beyond the lower edge. With the primary downtrend having been in full force since topping at 0.8135, in early 2018, further downside is possible.
Assuming a close beneath the 0.6670 September 30th low, the rising wedge take-profit (black arrows – calculated by taking the height of the base and adding it the breakout point) is seen at 0.6599, followed by support at 0.6359 (not visible on the screen).
The daily timeframe has buyers and sellers squaring off between support from 0.6677 and Quasimodo support-turned resistance at 0.6769. The next support target beyond 0.6677, in the event of further selling, falls in around 0.6508 (not visible on the screen). Traders may also want to note the 200-day SMA (orange – 0.6857) continues to point south, trading lower since April 2018.
Areas of consideration:
Weekly price invites further selling, according to our chart studies. Daily price could, nonetheless, pop to 0.6769 before we navigate lower ground, as could H4 price to 0.6768.
In light of this, focus shifts to the 0.6768 region for potential shorting opportunities. The combination of H4 and daily resistance is likely to prompt a move lower, with the 0.67 handle on the H4 open as an initial downside target. Conservative traders may wish to explore an alternative entry approach, in order to help avoid being taken out on a whipsaw. This could be something as simple as a bearish candlestick signal, though this is trader dependent.
USD/JPY:
Early hours Thursday saw demand for the safe-haven Japanese yen surge, carrying USD/JPY south of the 110 handle amid increasing concerns over the coronavirus outbreak. Price remained south of 110 throughout Europe and the US session, testing lows of 109.62.
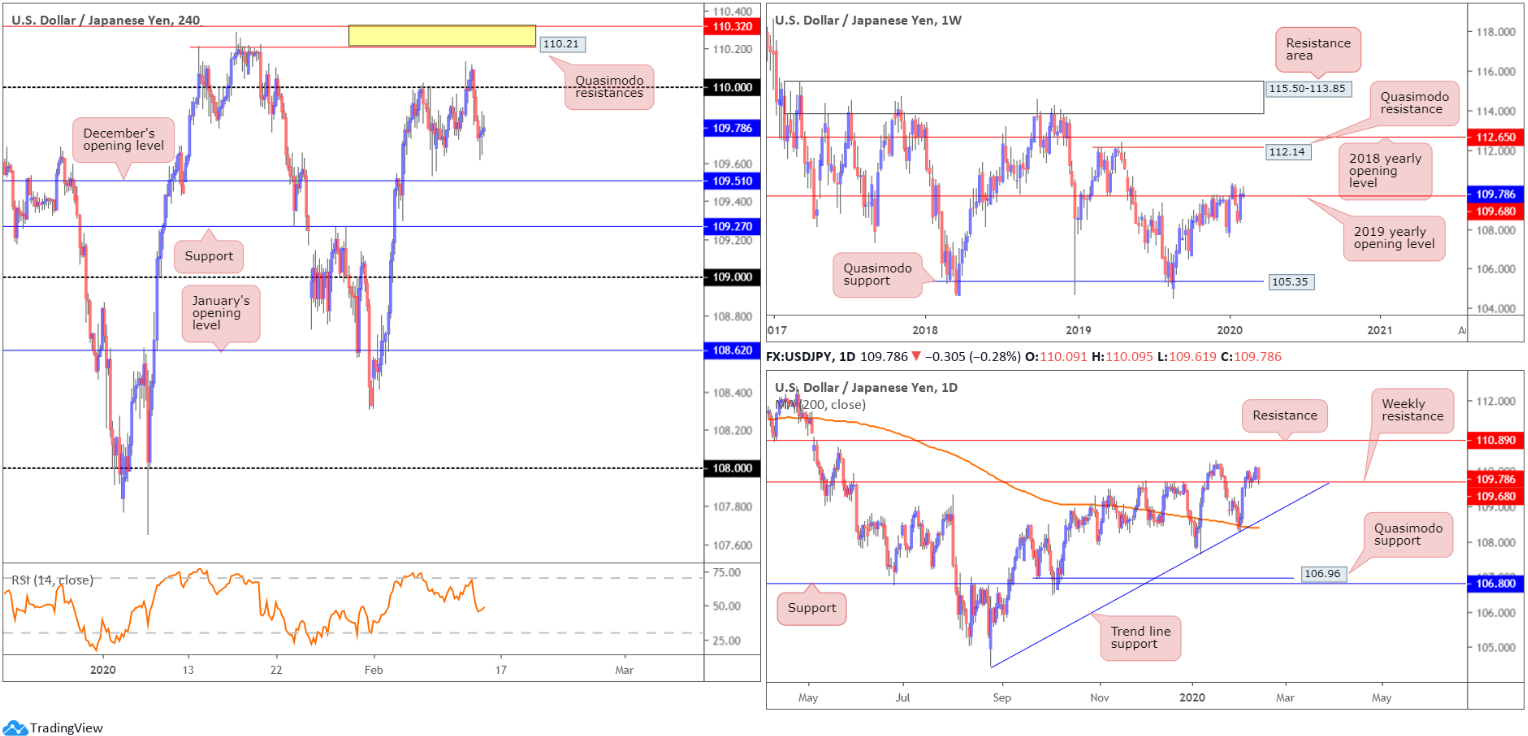
H4 action attempted to pare earlier losses during US trade, though failed to sustain gains above the 109.85 mark. December’s opening level at 109.51 may provide support should the market continue lower today, with a violation drawing the spotlight to support at 109.27.
Interestingly, the higher timeframes have price retesting the top edge of weekly resistance at 109.68, the 2019 yearly opening level, following last week’s minor close north of the level.
From the weekly timeframe:
A decisive push above the current resistance underlines a possible approach towards Quasimodo resistance at 112.14, closely followed by the 2018 yearly opening level at 112.65, over the coming weeks. A rejection, however, could entice moves to the 107.65 January 6th low. Beneath the aforementioned low, limited support is evident until reaching the 106.48 September 30th low, followed by Quasimodo support coming in at 105.35.
From the daily timeframe:
Price is seen retesting the current weekly resistance as support on the daily timeframe. A move lower has trend line support, extended from the low 104.44, in view, followed by the 200-day SMA (orange – 108.38). Moves higher, however, could have resistance at 110.89 enter the mix.
Areas of consideration:
Based on the weekly timeframe’s structure, the 2019 yearly opening level at 109.68 remains a probable resistance. The recent close above the level is not a cause for concern on the weekly timeframe, and unlikely sufficient to excite breakout buying.
Daily price shows the unit retesting the weekly level as support, but has yet to pencil in anything of note to the upside, therefore pushing buyers to the sidelines for now.
This leaves H4 movement, which, as highlighted above, trades south of 110, down from Wednesday’s peak of 110.13.
According to the technical studies presented here, neither a long nor short seems attractive right now, due to uncertain direction on the higher timeframes.
USD/CAD:
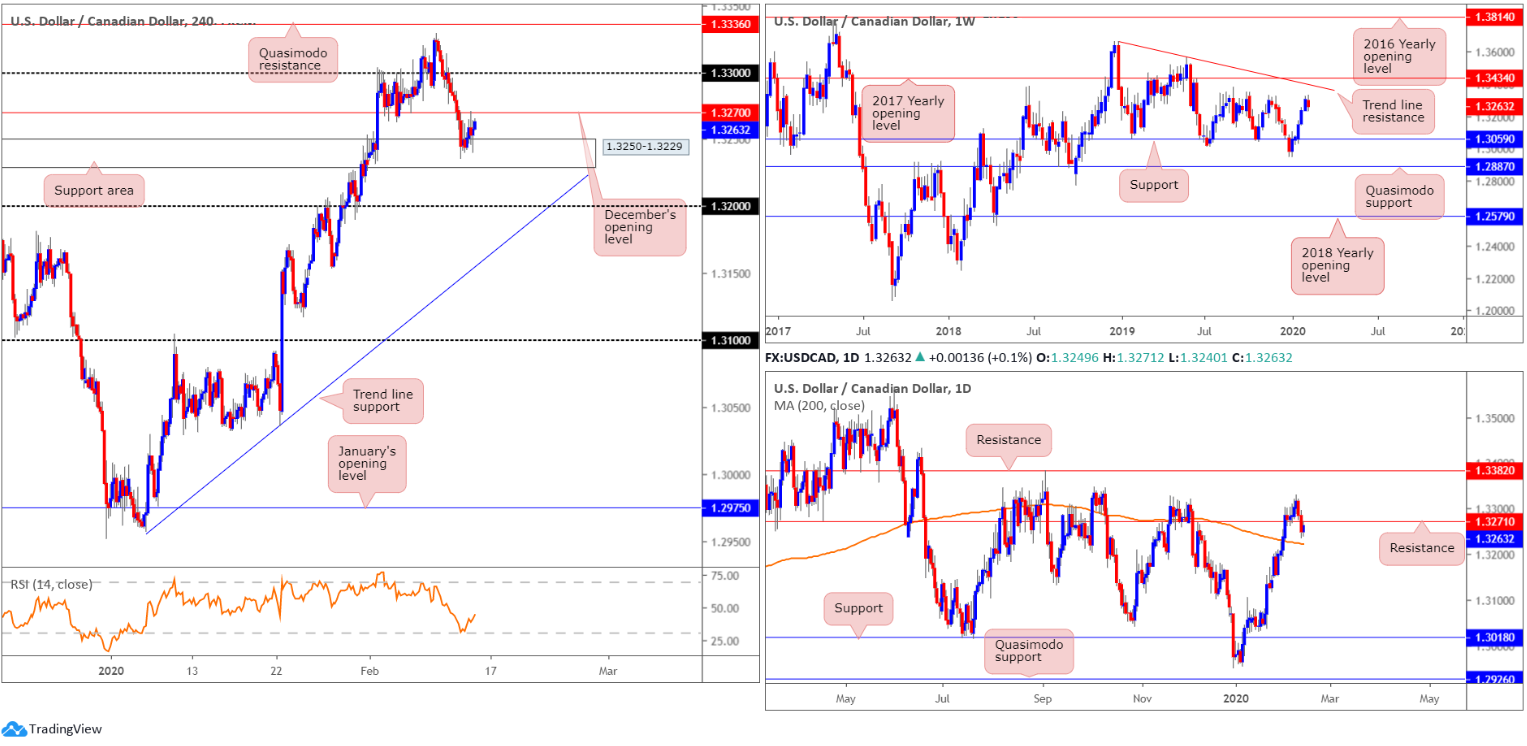
The US dollar concluded a shade higher against the Canadian dollar Thursday, adding more than 10 points, or 0.10%. Waning crude oil prices, as well as the US dollar index crunching above 99.00, saw USD/CAD climb out of a H4 support area at 1.3250-1.3229 to highs of 1.3271.
December’s opening level at 1.3270 currently serves as resistance on the H4, as does a daily level priced in at 1.3271. Further rejection off 1.3270 could overwhelm buyers at 1.3250-1.3229 and expose the 1.32 handle. Downside on the daily timeframe, however, has the 200-day SMA (orange – 1.3222) as potential support.
Higher on the curve, weekly price fades tops around 1.3340, on course to snap a five-week bullish phase. Additional resistance resides at trend line resistance (1.3661) and the 2017 yearly opening level at 1.3434. Support, on the other hand, is seen around the 1.3059 neighbourhood.
Areas of consideration:
Going off the presented chart studies, sellers appear to have the upper hand right now. December’s opening level at 1.3270 on the H4, along with daily price fading resistance at 1.3271 and weekly price coming within a whisker of weekly tops at 1.3340, is likely enough evidence to encourage additional selling today and possibly next week.
Traders are urged to consider waiting for a H4 bearish candlestick formation to form off 1.3270 before pulling the trigger, however; this should help overthrow the current H4 support area at 1.3250-1.3229. Take-profit targets reside around the 200-day SMA (1.3222), shadowed by the 1.32 handle on the H4.
USD/CHF:
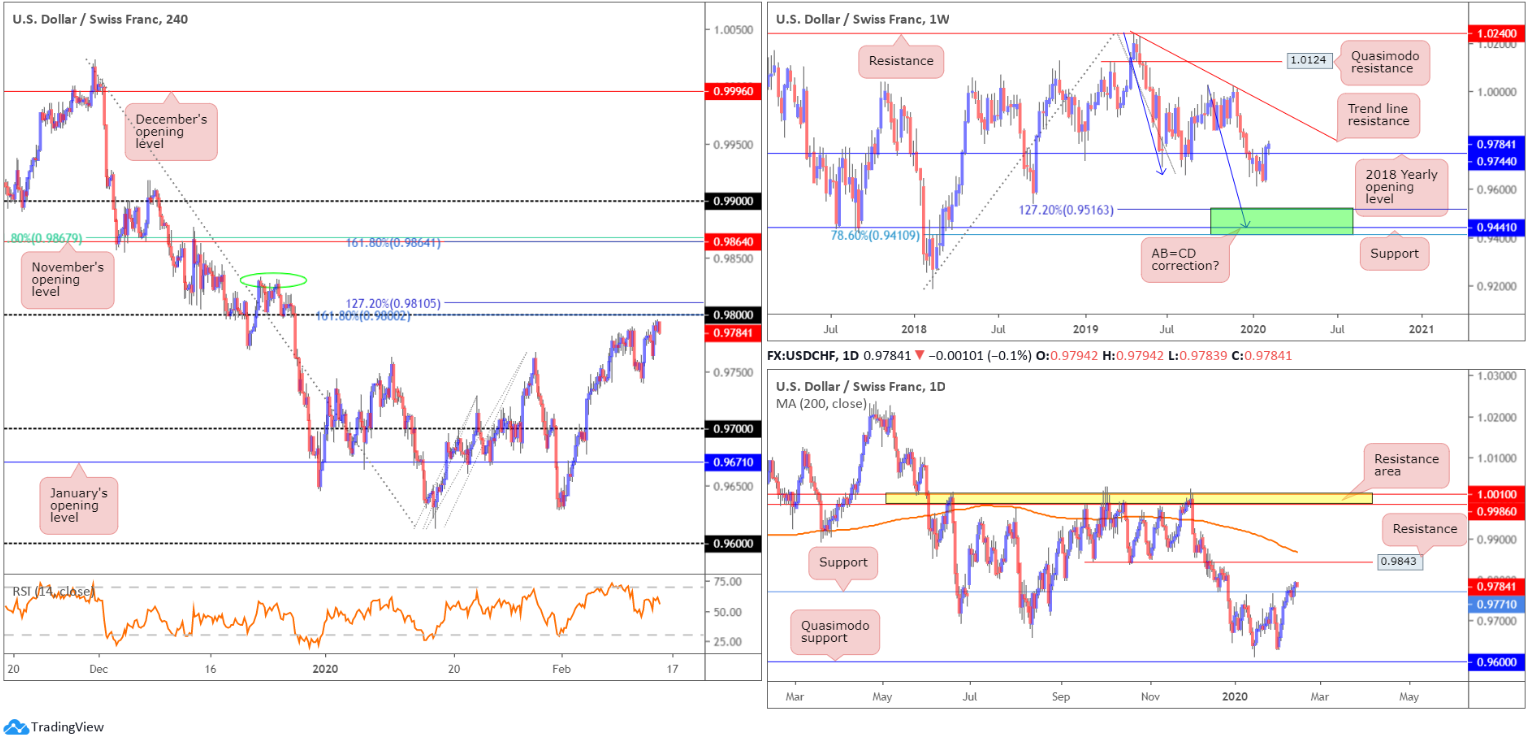
Despite dipping to lows of 0.9760 amid early risk-off trade that benefitted the safe-haven Swiss franc, USD/CHF recovered on the back of broad-based USD bidding and landed the H4 candles within touching distance of 0.98. Note also this level comes with a 161.8% Fibonacci extension as well as a 127.2% Fibonacci extension at 0.9810.
A violation of the 0.9810/0.98 region today has local tops to contend with around 0.9830 (green oval), with a break possibly setting the stage for a run to November’s opening level at 0.9864. What’s interesting here is this level also comes with a 161.8% Fibonacci extension and a 61.8% Fibonacci retracement at 0.9867.
A stronger-than-expected recovery emerged last week, marginally brushing aside the 2018 yearly opening level at 0.9744 on the weekly timeframe. At this stage, price is navigating higher, following a retest motion off 0.9744, perhaps targeting trend line resistance, etched from the high 1.0236.
Shaped by way of five consecutive bullish candles on the daily timeframe, USD/CHF approached resistance coming in at 0.9771 last week. As evident from the chart, price elbowed above the said resistance, in some respects confirming buyer intent on the weekly timeframe, following a retest at 0.9771 yesterday. Daily resistance at 0.9843 is the next target in the firing range, with a break revealing the 200-day SMA (orange – 0.9867). The said SMA converges with November’s opening level at 0.9864 on the H4 timeframe.
Areas of consideration:
Despite both the weekly and daily timeframes suggesting moves higher, H4 between 0.9810/0.98 is an appealing area of resistance for an intraday reaction. Whether one feels this zone requires additional confirmation before becoming valid is, of course, trader dependent. The risk is higher-timeframe buying may be too much for sellers here, therefore trade cautiously.
In the event of a H4 close north of 0.9810, traders will likely seek long positions, targeting daily resistance at 0.9843 as the initial port of call, preferably off the back of a retest pattern at 0.98.
Dow Jones Industrial Average:
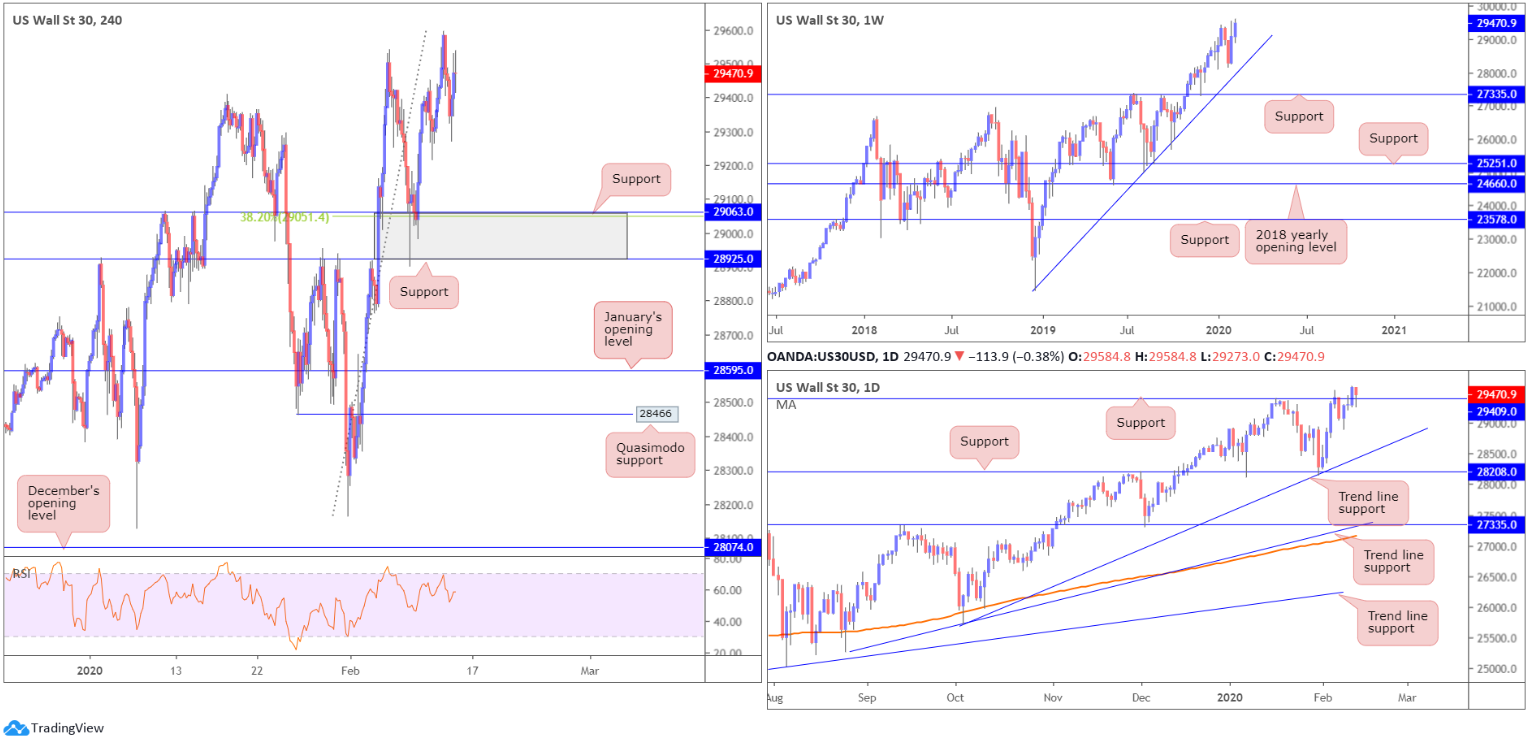
US equities retreated from Wednesday’s all-time high of 29595 Thursday on renewed coronavirus fears, following an unexpectedly large jump in reported coronavirus cases and deaths. China, nevertheless, cited a methodological change for the ramp higher. The Dow Jones Industrial Average dipped 128.11 points, or 0.43%; the S&P 500 dropped 5.51 points, or 0.16% and the tech-heavy Nasdaq 100 ended lower by 17.50 points, or 0.18%.
Technically, the weekly candles remain healthy north of trend line support, taken from the low 21452. Outside of the aforementioned trend line, support rests at 27335.
Closer analysis of the daily timeframe has current price attempting to defend support at 29409. Should the current candle close by way of a bullish candlestick signal, such as a hammer pattern, longs on the back of this formation will likely materialise.
Across the page on the H4 timeframe, the area marked in grey between 28925/29063 remains particularly attractive as it holds a 38.2% Fibonacci value at 29051 within.
Areas of consideration:
Two potential scenarios are in the offing today:
- Daily price closes off 29409 in the shape of a hammer candlestick signal and prompts a long entry. Protective stop-loss orders are generally sited south of its lower shadow.
- A pullback to the H4 support area at 28925/29063. A reaction from here, preferably formed by a H4 bullish candlestick signal (the reason for recommending additional confirmation is due to the area already being tested once) will likely attract additional longs.
XAU/USD (GOLD):
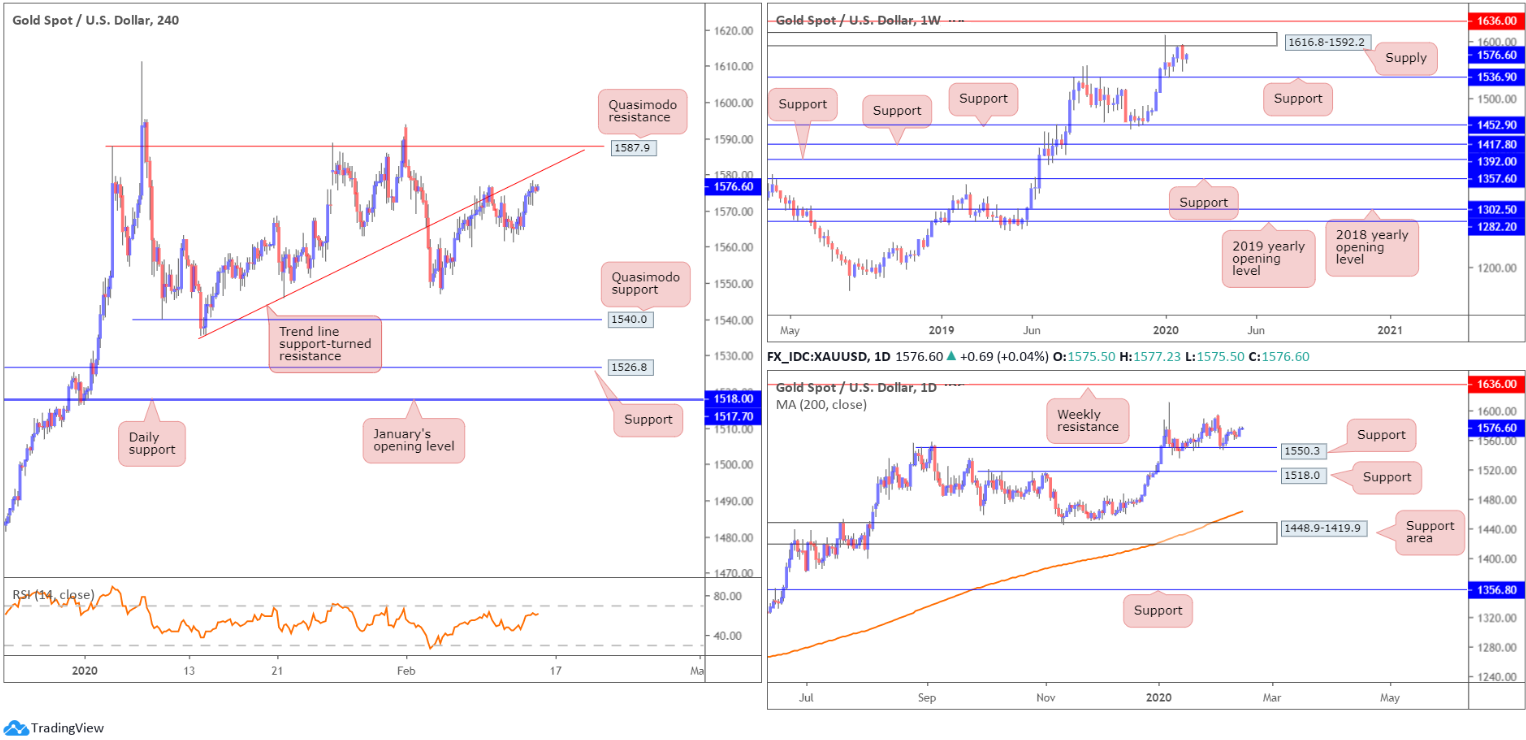
Bullion dipped lower in early trade Thursday amid risk-off conditions, scoring a session low of 1568.8. Despite the US dollar index holding onto the bulk of its daily gains and the 10-year US Treasury yield staging a healthy bid, the price of gold recovered, paring earlier losses and pushing higher throughout European and US sessions.
Since the beginning of the year, longer-term candles on the weekly timeframe have been confined to a range between supply drawn from 1616.8-1592.2 and support at 1536.9. Areas outside of this range can be seen at resistance from 1636.0 and support fixed at 1452.9.
A closer reading of price action on the daily timeframe has the unit rebounding from support at 1550.3, fixed north of another layer of support at 1518.0. As you can see, weekly and daily structure have diverging views right now: weekly recently rebounding from supply and daily from support.
Shorter-term developments has H4 stationed a few points south of trend line support-turned resistance, taken from the low 1536.2. Continued bidding beyond here invites an approach towards Quasimodo resistance coming in at 1587.9, whereas a rejection from the said trend line, aside from Wednesday’s low at 1561.4, has the 1547.3 February 5th low and Quasimodo support at 1540.0 to target.
Areas of consideration:
Although further recovery off daily support at 1550.3 may develop, the threat of further selling on the weekly timeframe to support at 1536.9 is certainly there. With higher timeframes usually taking precedence over lower timeframes, an additional turn at the current H4 trend line resistance is possible today. Failure here, though, may see the H4 Quasimodo resistance at 1587.9 tested for potential short sales.
The accuracy, completeness and timeliness of the information contained on this site cannot be guaranteed. IC Markets does not warranty, guarantee or make any representations, or assume any liability regarding financial results based on the use of the information in the site.
News, views, opinions, recommendations and other information obtained from sources outside of www.icmarkets.com.au, used in this site are believed to be reliable, but we cannot guarantee their accuracy or completeness. All such information is subject to change at any time without notice. IC Markets assumes no responsibility for the content of any linked site.
The fact that such links may exist does not indicate approval or endorsement of any material contained on any linked site. IC Markets is not liable for any harm caused by the transmission, through accessing the services or information on this site, of a computer virus, or other computer code or programming device that might be used to access, delete, damage, disable, disrupt or otherwise impede in any manner, the operation of the site or of any user’s software, hardware, data or property.


