
EUR/USD:
The US dollar advanced across the board Thursday amid hotter-than-expected macroeconomic data, consequently reclaiming 97.00+ status on the US dollar index. The producer price index for final demand rose 0.6% in March, seasonally adjusted, the US Bureau of Labour Statistics reported. In addition to this, in the week ending April 6, the advance figure for seasonally adjusted initial claims was 196,000, a decrease of 8,000 from the previous week’s revised level. This is the lowest level for initial claims since October 4, 1969 when it was 193,000 (Department of Labour).
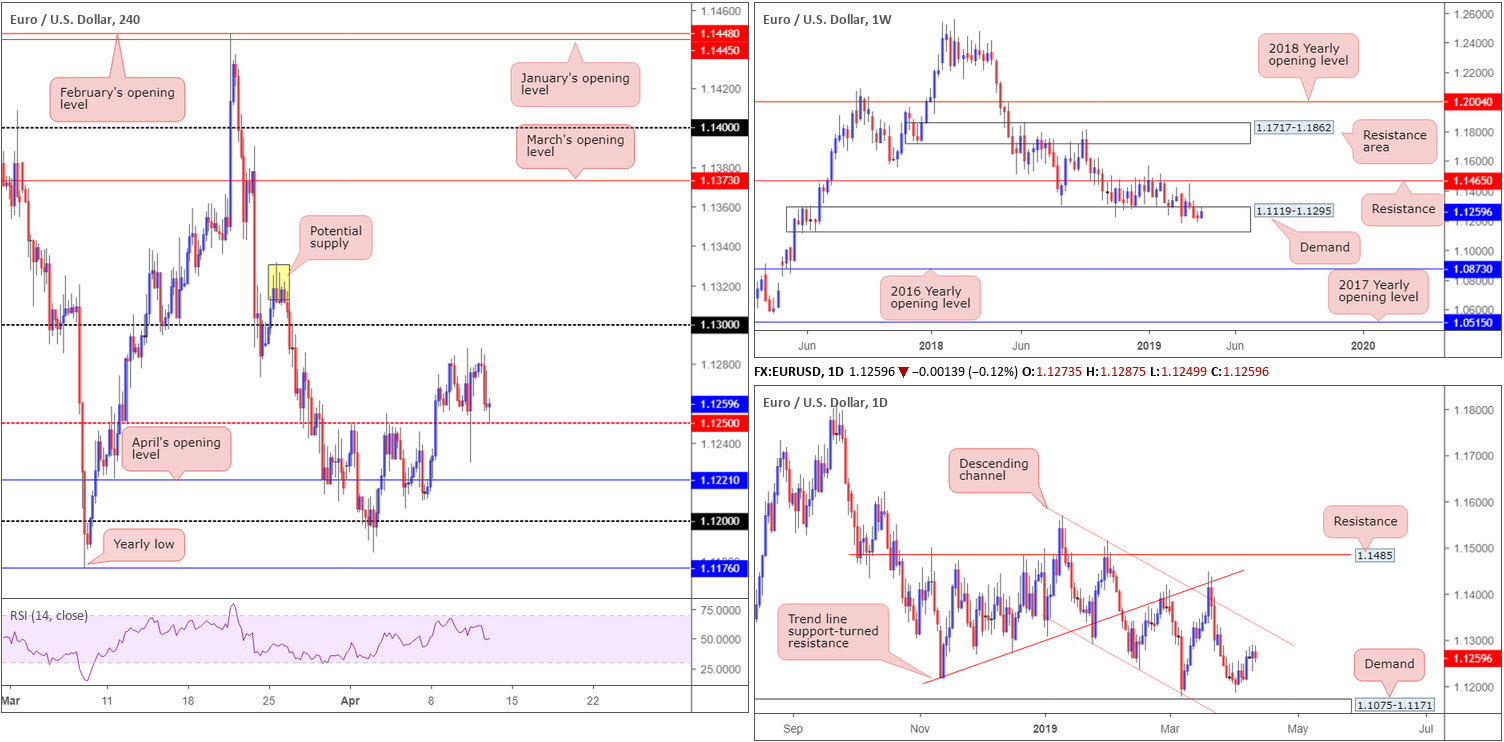
The euro-to-dollar relationship on the H4 timeframe settled a few points north of 1.1250, following a modest bout of selling from familiar tops around 1.1284ish. Aside from this topping formation, traders may have also sketched in potential resistance from 1.13, trailed closely by supply at 1.1331/1.1310 (yellow). Sub 1.1250, however, has April’s opening level at 1.1221, and 1.12.
On more of a broader perspective, weekly flow remains unchanged within the parapets of demand at 1.1119-1.1295, with the candles still attempting to breakout of the zone. Overall, though, the long-term trend on the weekly timeframe continues to face a southerly direction, with traders’ crosshairs likely fixed on 1.1176 as the next viable support: the 2019 yearly low.
A closer analysis on the daily timeframe has the candles poised to cross swords with channel resistance (drawn from the high 1.1569). Yet, on more of a southerly note, demand at 1.1075-1.1171 is in sight as the next downside objective.
Areas of consideration:
Having noted weekly flows holding within the walls of demand as well as daily activity demonstrating scope to press higher, a long off 1.1250 is an idea today, targeting 1.13 and finally the H4 supply at 1.1331/1.1310 (yellow). Should the current H4 candle close in the form of a bullish pin-bar pattern, not only does this signal buyer intent it also provides entry and risk levels to work with.
Today’s data points: US Prelim UoM Consumer Sentiment.
GBP/USD:
Sterling opened Thursday on a reasonably strong footing, continuing to price out a no-deal Brexit, though failed to sustain gains heading into London hours in the face of USD strength. Traders may have also noticed the GBP/USD pair has been behaving remarkably well considering the news of a lengthy Brexit extension until October 31.
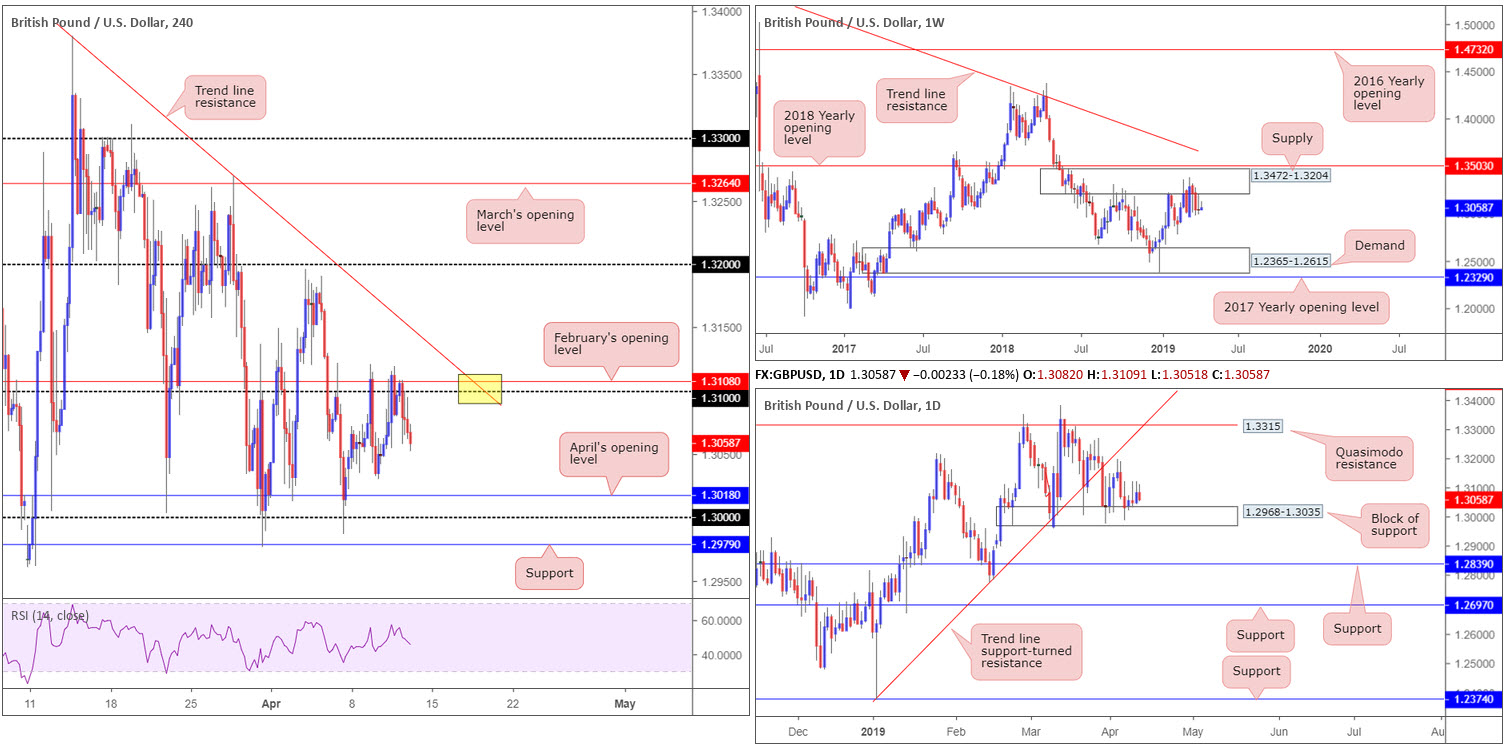
The technical front offers limited change on the higher timeframes. Weekly movement continues to consolidate around the underside of supply at 1.3472-1.3204. Since the end of February this area has been home to many traders. The flip side to this, daily action remains teasing a block of support at 1.2968-1.3035. Buying from here is likely to find resistance around trend line support-turned resistance (extended from the low 1.2373), closely merging with a Quasimodo resistance plotted at 1.3315.
The key observation on the H4 timeframe remains at 1.31, which dovetails closely with February’s opening level nearby at 1.3108. Overhead, the research team also notes trend line resistance (etched from the high 1.3380). Support, on the contrary, has Tuesday’s low 1.3030 on the radar, tailed by April’s opening level at 1.3018, key figure 1.30 and support priced in at 1.2979.
Areas of consideration:
In similar fashion to Thursday’s briefing, higher-timeframe structures offer an indecisive picture at present, leaving traders with only H4 levels to work with today.
Selling from 1.31 was an option highlighted in yesterday’s report – well done to any of our readers who managed to jump aboard this move. Fresh to the board, nonetheless, is the point the current H4 trend line resistance (1.3380) merges with 1.3108/1.31 (yellow). This is attractive confluence and, therefore, likely to produce a bounce if tested.
Traders interested in entering long from the 1.30 region, according to our technical studies, bring with them a clear block of daily support at 1.2968-1.3035 backing up the trade, along with nearby H4 supports highlighted above in bold. Though this is likely to encourage buyers, the main concern remains on the weekly timeframe: supply at 1.3472-1.3204. This area is proving a troublesome beast to overcome and, therefore, could weigh on any longs.
Irrespective of the H4 level selected, waiting for additional confirmation to form prior to pulling the trigger is recommended. This is, aside from a long out of the 1.30ish area which has a connection to daily structure, due to limited higher-timeframe convergence being seen.
Today’s data points: US Prelim UoM Consumer Sentiment.
AUD/USD:
Australian consumer inflation expectations declined to 3.9% in April compared to 4.1% in March, while China’s March inflation came in as expected at 2.3% year on year. This – coupled with the US dollar exploring ground above its 97.00 mark – weighed on the commodity-linked currency Thursday.
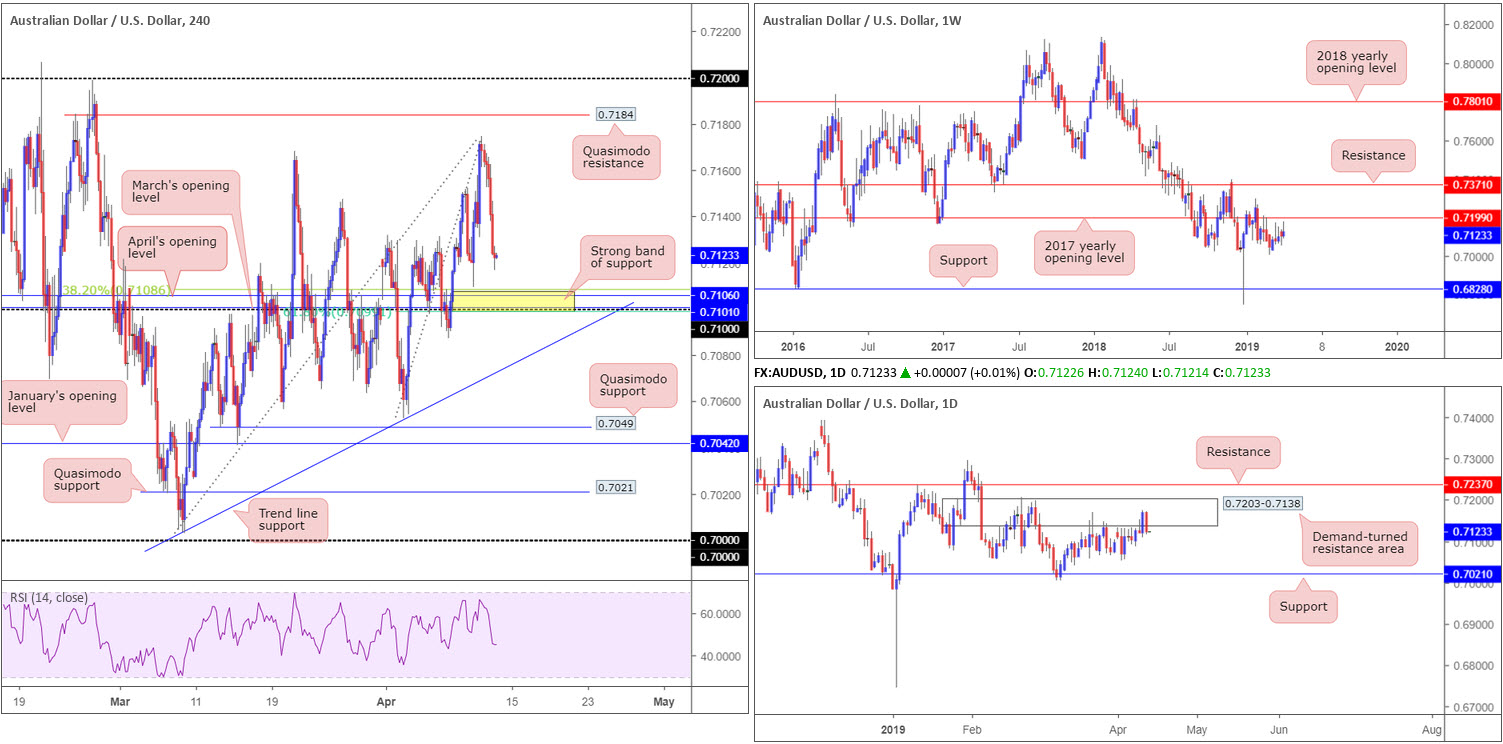
Leaving H4 Quasimodo resistance at 0.7184 unopposed, the AUD/USD declined 0.64% on the day, eroding a large portion of Wednesday’s gains. Consequent to this, the H4 candles are positioned ahead of a particularly interesting band of support covering 0.7099/0.7108 (yellow – comprised of a 61.8% Fibonacci support value at 0.7099, a 0.71 round number, March’s opening level at 0.7101, April’s opening level at 0.7106 and a 38.2% Fibonacci support at 0.7108).
While 0.7099/0.7108 includes a number of key H4 levels, traders cannot rule out the possibility this area may be dethroned, given where we’re coming from on the higher timeframes. According to the weekly timeframe, the unit recently turned lower from just ahead of the 2017 yearly opening level at 0.7199. Further to this, daily structure also has a demand-turned resistance area at 0.7203-0.7138 in motion.
Areas of consideration:
In light of the clear-cut confluence on offer between 0.7099/0.7108, a bounce from here is a possibility today with an initial target objective set around 0.7150ish. To help address the threat of further selling on the higher timeframes, traders are urged to consider waiting for a H4 bullish candlestick formation to develop before pressing the buy button. Although this will not guarantee a winning trade, it’ll help confirm buyer intent and also deliver strict entry/risk levels.
Today’s data points: RBA Financial Stability Review; China Trade Balance; US Prelim UoM Consumer Sentiment.
USD/JPY:
Breaking a two-day bearish phase, US Treasury yields scrambled north Thursday, consequently pulling the USD/JPY higher in the process. Also in favour, the US producer price index for final demand rose 0.6% in March, and initial jobless claims came in at 196,000, a decrease of 8,000 from the previous week’s revised level.
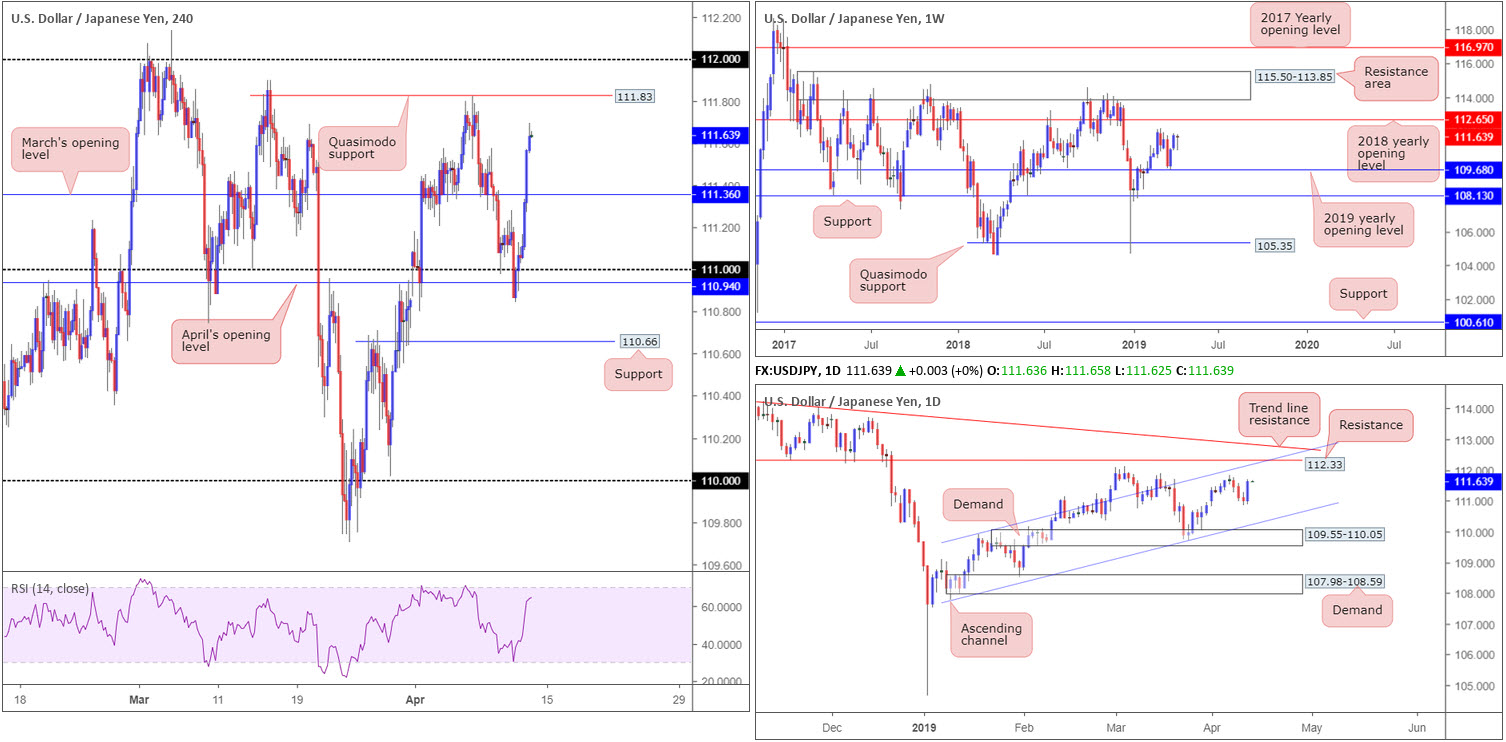
Up 0.57% on the day, the H4 candles conquered a number of resistances in recent trade. The next resistance barrier on tap, falls in around the 111.82 April 5 high/Quasimodo resistance at 111.83, followed closely by the round number 112. It might also interest some traders to note the RSI indicator is seen nearing its overbought value.
On a wider perspective, structure on the weekly timeframe has the candles facing the March 4 high at 112.13, shadowed closely by the 2018 yearly opening level priced in at 112.65. To the downside, the next point of interest falls in around the 2019 yearly opening level at 109.68. In terms of where we stand on the daily timeframe, the March 4 high at 112.13 mentioned above on the weekly timeframe is also a discernible resistance on this scale, though the more prominent level falls in around 112.33, which happens to coincide with channel resistance (taken from the high 109.89), closely tailed by a long-standing trend line resistance (etched from the high 114.55).
Areas of consideration:
A bounce lower from the H4 Quasimodo resistance at 111.83 could emerge today, though a fakeout through this level to 1.12 could just as easily be seen. Unfortunately, 112 could also be victim to a fakeout as daily traders may want to bring in the 112.33 resistance. Therefore, before shorting either of the above, waiting for additional H4 confirmation to develop is worth considering.
In the event we pullback today and retest March’s opening level at 111.36, this base could serve as an ideal platform to buy, targeting 111.83 as an initial port of call. Although the higher timeframes point to higher prices at the moment, additional confirmation is also necessary here the research team notes, due to the possibility a fakeout through the level being likely before buyers step in.
Entry and risk levels can be determined according to the confirmation technique selected.
Today’s data points: US Prelim UoM Consumer Sentiment.
USD/CAD:
The commodity-sensitive Canadian dollar ceded ground to its US counterpart Thursday, amid WTI prices reclaiming $64.00 to the downside and US Treasuries recovering some lost ground after two consecutive days of losses.
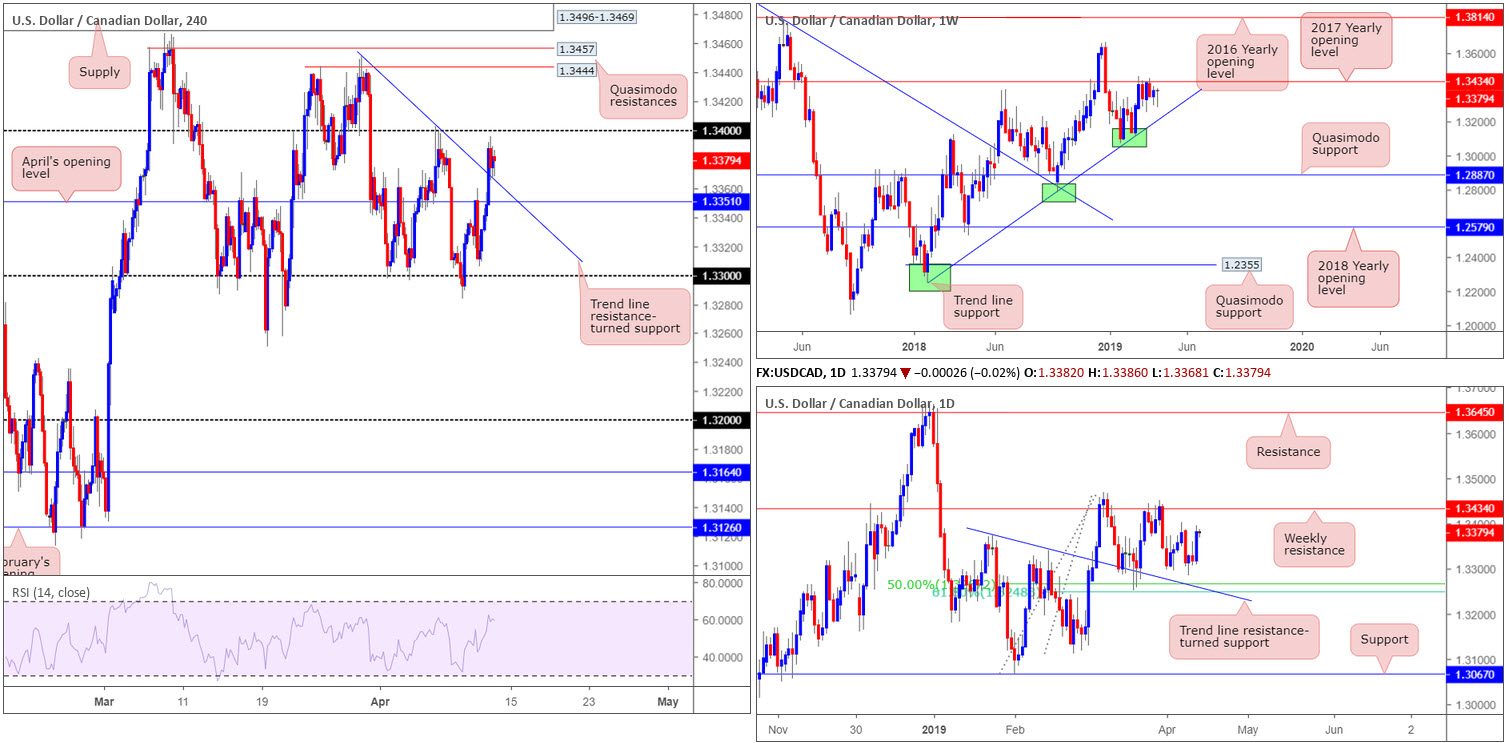
H4 price, as you can see, dipped its toes above trend line resistance (extended from the high 1.3450) and is, at the time of writing, holding as support. Before considering a long in this market, let’s be mindful to the fact 1.34 may offer resistance, as it did late last week. Beyond 1.34, though, a reasonably clear run northbound towards two layers of Quasimodo resistance at 1.3457/1.3444 is visible, trailed closely by a supply zone at 1.3496-1.3469.
Against the backdrop of medium-term flows, daily action’s focus has now shifted to weekly resistance at 1.3434: the 2017 yearly opening level. In the event we turn lower from current price, nonetheless, a 50.0% support is seen at 1.3267. Note this barrier also happens to merge closely with a 61.8% Fibonacci support at 1.3248 and a trend line resistance-turned support (extended from the high 1.3375).
Areas of consideration:
H4 price is, as mentioned above, testing waters north of a recently broken trend line resistance. Regrettably, a long from this line is difficult. Not only is there 1.34 to contend with, the research team also notes above 1.34, we have weekly resistance nearby at 1.3434.
In terms of selling opportunities, the entire range covering the H4 supply at 1.3496-1.3469 and the two Quasimodo resistances at 1.3457/1.3444 is likely a strong ceiling. A notable H4 bearish candlestick pattern printed from within this neighbourhood has ‘sell me’ written all over it, targeting 1.34 as the initial take profit (entry/risk levels can be determined according to the candlestick’s rules of engagement).
Today’s data points: US Prelim UoM Consumer Sentiment.
USD/CHF:
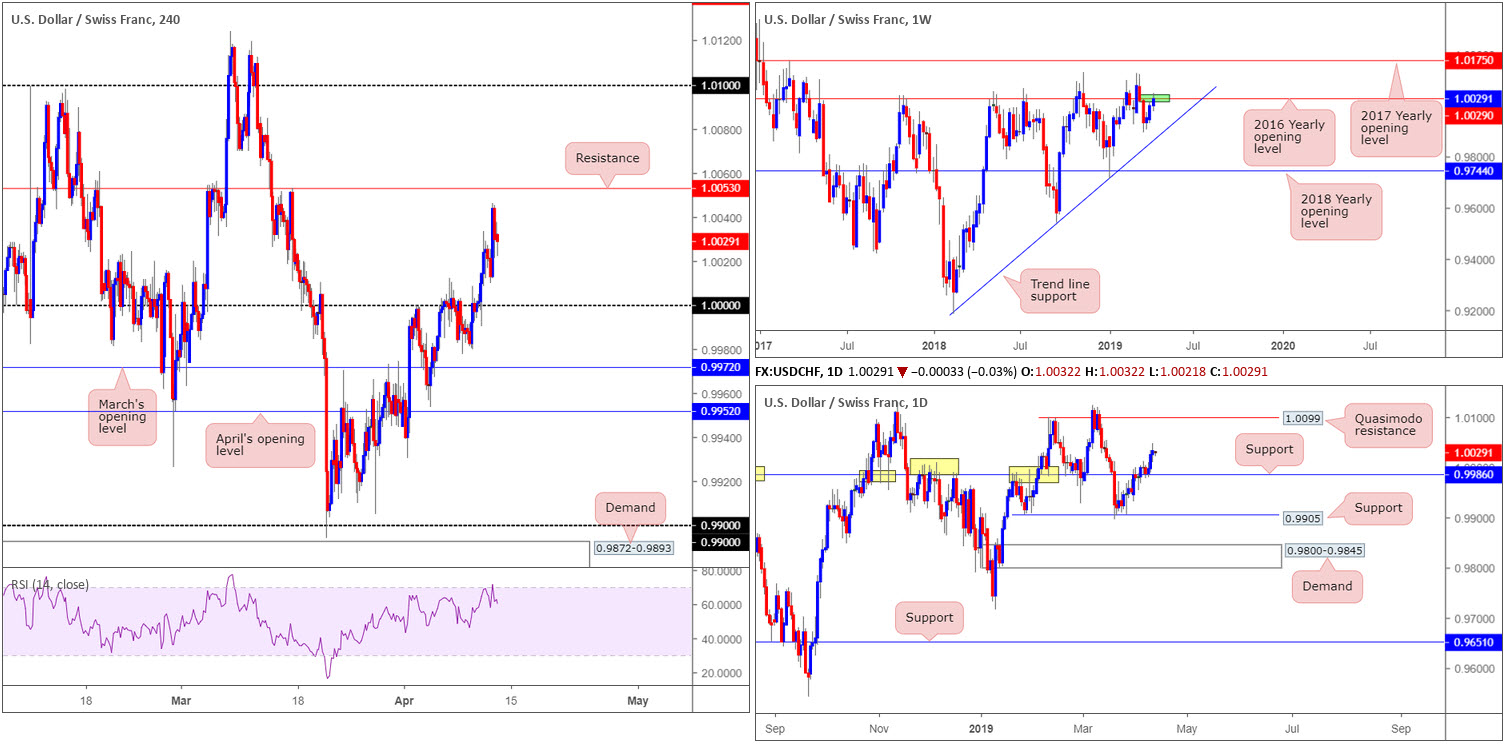
Broad-based USD buying emerged Thursday, hauling the US dollar index back above 97.00. Along with strong US Treasury yields, this lifted the USD/CHF to higher ground, reaching highs of 1.0046 on the day. According to where the candles trade on the H4 timeframe, additional buying could materialise towards resistance at 1.0053. Beyond this level, a run in the direction of 1.01 also seems a reasonable possibility.
Weekly action continues to grapple with its 2016 yearly opening level at 1.0029. A rotation lower from this point will likely see the unit cross paths with a long-standing trend line support (etched from the low 0.9187). Contrary to this, the daily candles are establishing support above a notable base at 0.9986 – note this support and resistance level boasts strong historical significance dating as far back as November 2017. Should the buyers continue bidding this market higher from here, the next area of resistance in sight falls in around a Quasimodo base at 1.0099.
Areas of consideration:
As H4 price nears resistance at 1.0053, as well as weekly price currently chewing on the underside of 1.0029, a sell from 1.0053 could be something to watch out for today. To help overcome the threat of a push higher on the daily timeframe, traders are urged to exercise patience and see if the H4 candles form anything relating to a bearish candlestick pattern. The first downside target from this region will be around 1.0000, followed closely by daily support priced in at 0.9986.
Today’s data points: US Prelim UoM Consumer Sentiment.
Dow Jones Industrial Average:
Outlook unchanged in view of lacklustre price movement.
Most US equity indexes declined amid thin volumes Thursday as investors cast an eye toward the start of earnings season. The S&P 500 was an outlier among stock indexes, however, eking out its 10th consecutive gain.
In light of back-to-back tepid sessions for the DJIA, much of the following piece will echo similar thoughts put forward in yesterday’s briefing.
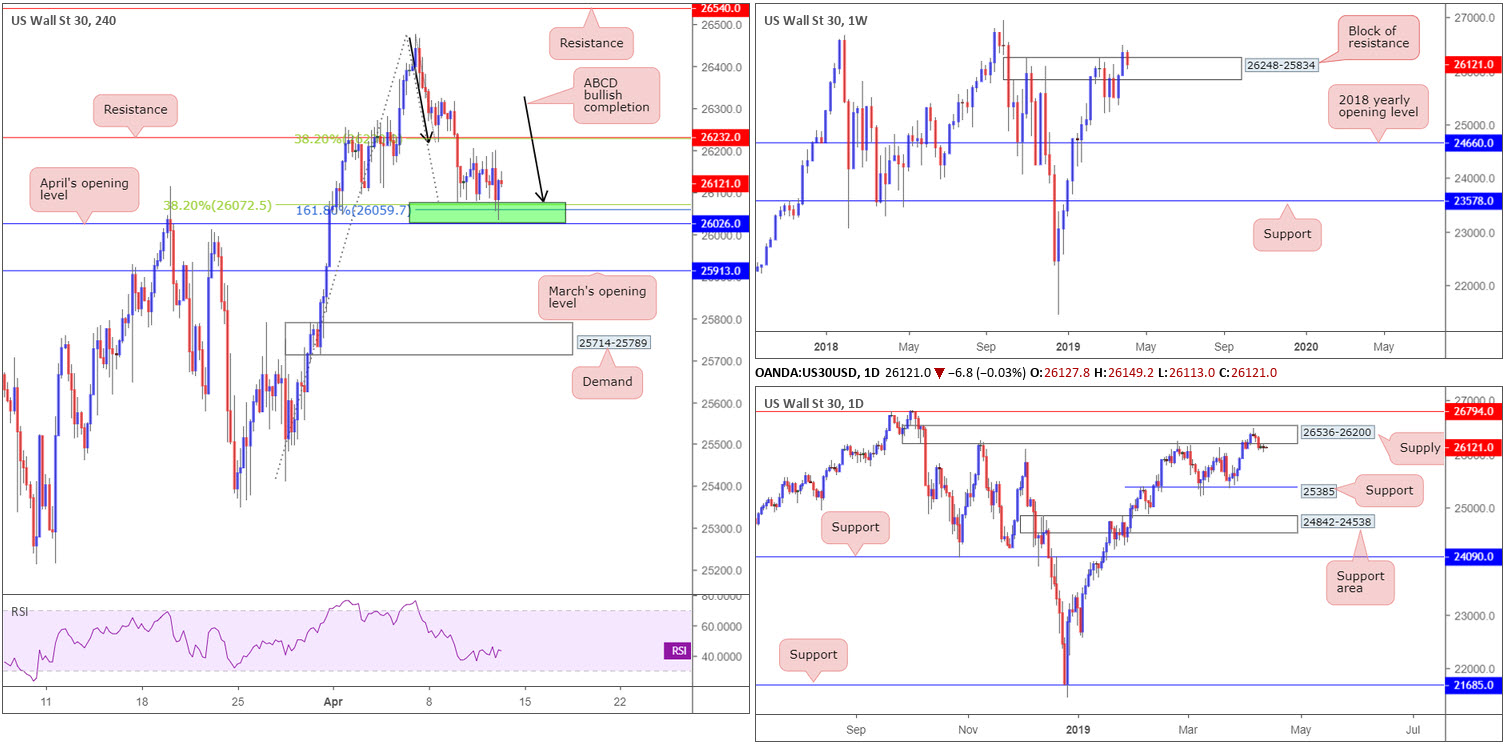
From a technical perspective, H4 price, after overthrowing support at 26232 (now acting resistance) completed an ABCD bullish pattern (black arrows) around 26081. Note this formation bottoms just ahead of April’s opening level at 26026, as well as a 38.2% Fibonacci support at 26072 and a 161.8% Fibonacci ext. point connected to the said ABCD at 26059 (green).
In recent sessions, weekly price dominated a resistance area shown at 26248-25834, which, as you can see, is being retested as potential support now. Interestingly, though, daily supply at 26536-26200 entered the mix at the later stages of last week in the shape of a bearish pin-bar pattern, and is displaying signs of seller intent. The next downside support target from here falls in around 25385.
Areas of consideration:
Harmonic traders interested in trading the recently completed H4 ABCD bullish formation will likely find resistance emerge at 26232. Traders may want to acknowledge this level also boasts a 38.2% Fibonacci resistance value (considered the first take-profit target for the ABCD). Some traders may already be long this formation and have stops tucked beneath April’s opening level mentioned above at 26026. Others, however, could still be waiting on additional candlestick confirmation.
Today’s data points: US Prelim UoM Consumer Sentiment.
XAU/USD (GOLD):
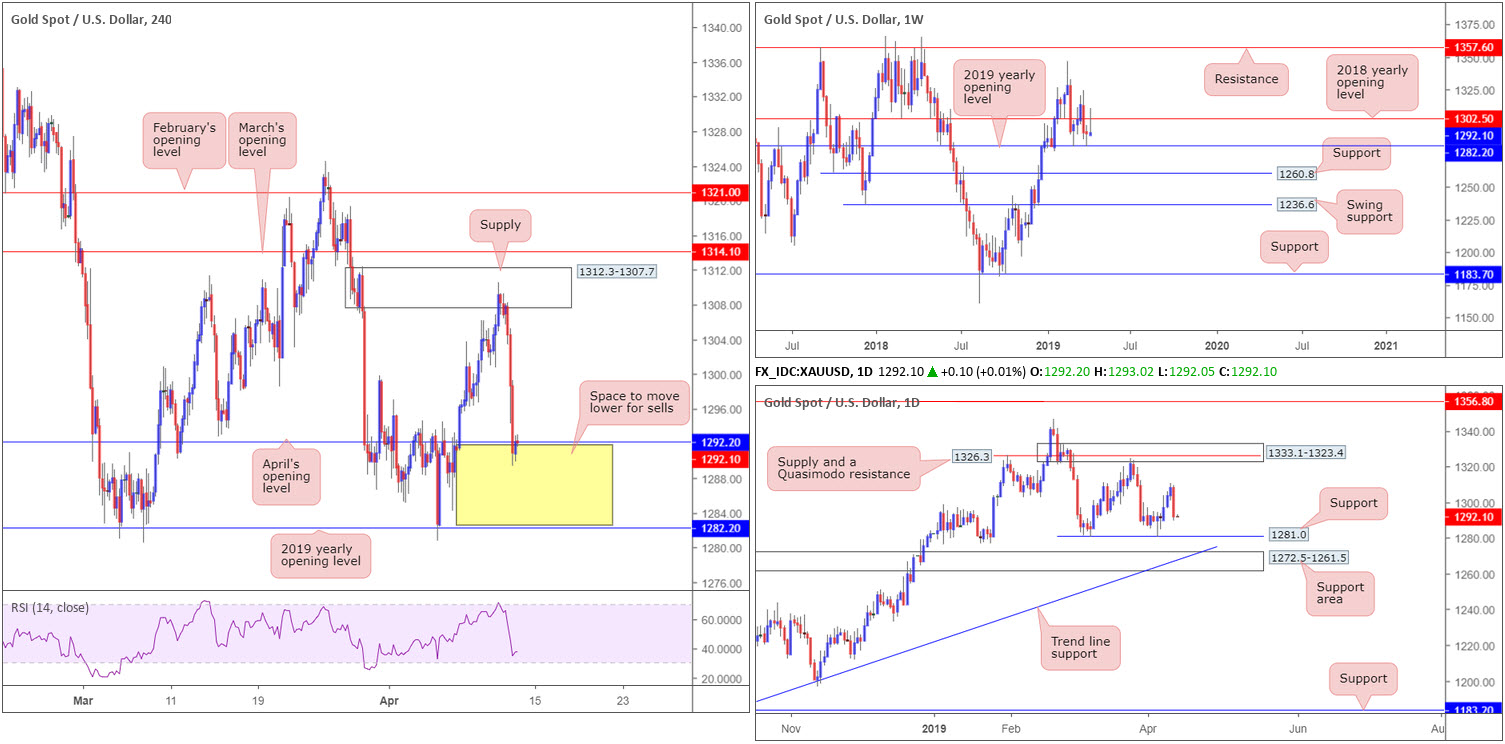
A combination of US Treasuries climbing higher and the US dollar index reclaiming 97.00 to the upside collectively starved the yellow metal of support Thursday. H4 supply at 1312.3-1307.7 (boasts strong downside momentum from its base), confirmed by the RSI indicator testing overbought territory, witnessed bullion retreat lower and conclude the day down 1.24%.
In the shape of a near-full-bodied daily bearish candle, H4 price swarmed April’s opening level at 1292.2 in the later stages of yesterday’s session, likely tripping a number of protective stop-loss orders. This could potentially set the stage for a continuation move towards the 2019 yearly opening level at 1282.2. Note this barrier is also positioned nearby daily support plotted at 1281.0
Areas of consideration:
Seeing H4 price test waters beneath April’s opening level at 1292.2, together with higher-timeframe action pointing to a move lower, a short in this market could be the way forward today. Assuming the H4 candles remain trading beneath 1292.2 (testing the underside of the level as we write) and chalks up a bearish candlestick pattern, a sell from here targeting 1282.2 is on the table.
The accuracy, completeness and timeliness of the information contained on this site cannot be guaranteed. IC Markets does not warranty, guarantee or make any representations, or assume any liability with regard to financial results based on the use of the information in the site.
News, views, opinions, recommendations and other information obtained from sources outside of www.icmarkets.com.au, used in this site are believed to be reliable, but we cannot guarantee their accuracy or completeness. All such information is subject to change at any time without notice. IC Markets assumes no responsibility for the content of any linked site. The fact that such links may exist does not indicate approval or endorsement of any material contained on any linked site.
IC Markets is not liable for any harm caused by the transmission, through accessing the services or information on this site, of a computer virus, or other computer code or programming device that might be used to access, delete, damage, disable, disrupt or otherwise impede in any manner, the operation of the site or of any user’s software, hardware, data or property.


