
Key risk events today:
China New Loans; ECOFIN Meetings; Canada Employment Change and Unemployment Rate; US Prelim UoM Consumer Sentiment; FOMC Member Rosengren Speaks.
EUR/USD:
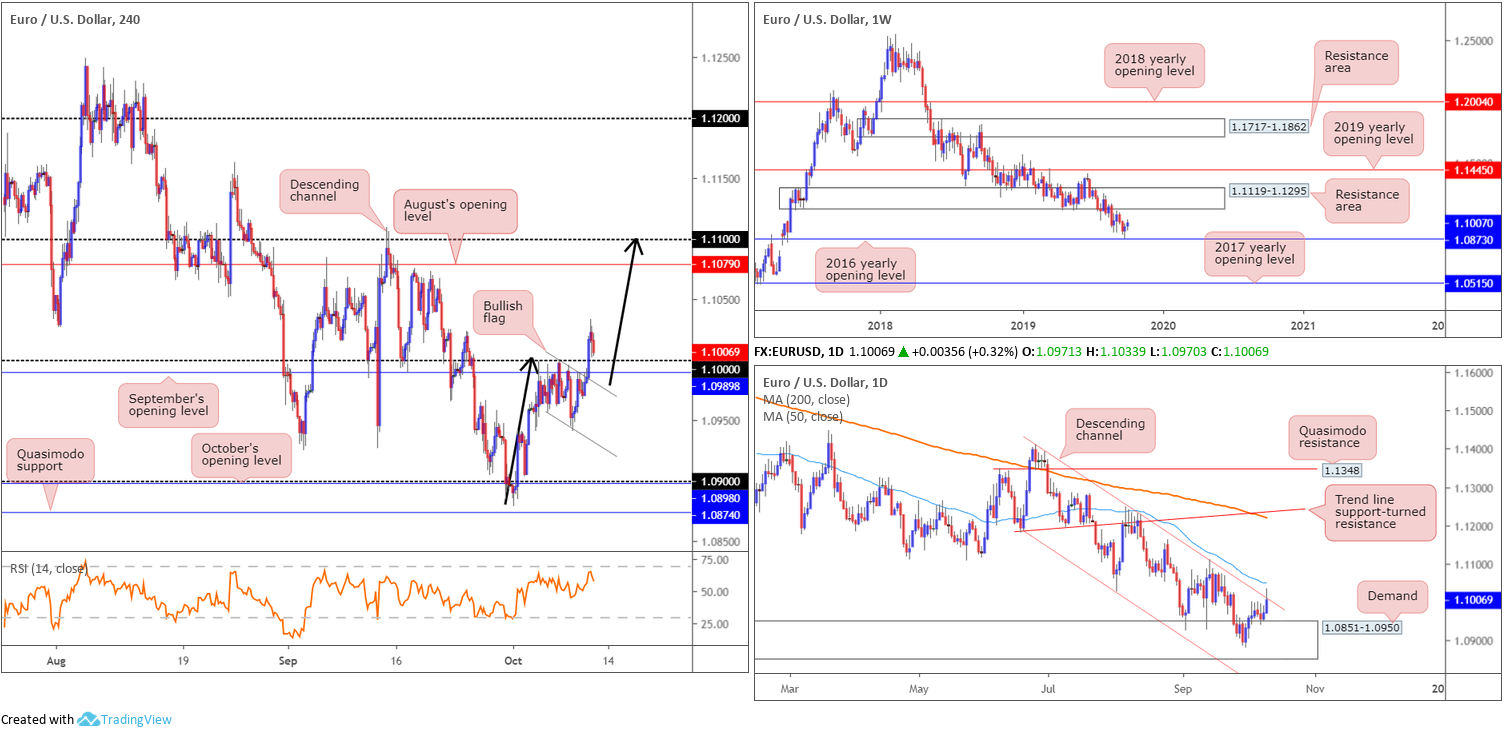
Europe’s shared currency, a beneficiary of dollar softness, clocked a weekly peak at 1.1033 Thursday before mildly paring gains into the close. The dollar index, or DXY, also overthrew 99.00 to the downside in recent movement, having shrugged off mixed US data in the form of CPI and weekly initial claims.
With respect to the H4 timeframe this morning, we can see price broke out north from its bullish flag pattern (1.0957/1.1000), consequently conquering September’s opening level at 1.0989 and the key figure 1.10 along the way. The retreat from recent peaks sited the candles within striking distance of 1.10, which combined with September’s opening level, may be a platform for potential long opportunities, targeting 1.11: the measured take-profit target based on the bullish flag’s preceding move added to the breakout point (black arrows).
On more of a broader perspective, however, daily price is grappling with channel resistance (extended from the high 1.1412), closely shadowed by the 50-day SMA (blue – 1.1049). Recognising this may entice sellers into the market, entering long off 1.10 may not be as appealing. Higher up on the curve, though, we have weekly movement holding things higher ahead of the 2016 yearly opening level at 1.0873 – a notable weekly support/resistance line. Further upside from this point could lead to 1.1119-1.1295 entering the mix: a long-standing resistance area.
Areas of consideration:
Outlook unchanged.
While a breakout of the upper boundary of the H4 bullish flag may be attractive for longs, traders may want to consider the possibility of sellers entering the fray off daily channel resistance (1.1412) which is positioned directly above the bullish flag. To circumvent this issue, consider waiting and seeing if price forms a daily close above the daily channel before executing a long position (entry at the close is then an option with a protective stop-loss order beneath the daily breakout candle’s lower shadow) – consider it a filter. By clearing the daily channel, the only structure, technically that is, stopping price from reaching the bullish flag’s take-profit target is the 50-day SMA.
GBP/USD:
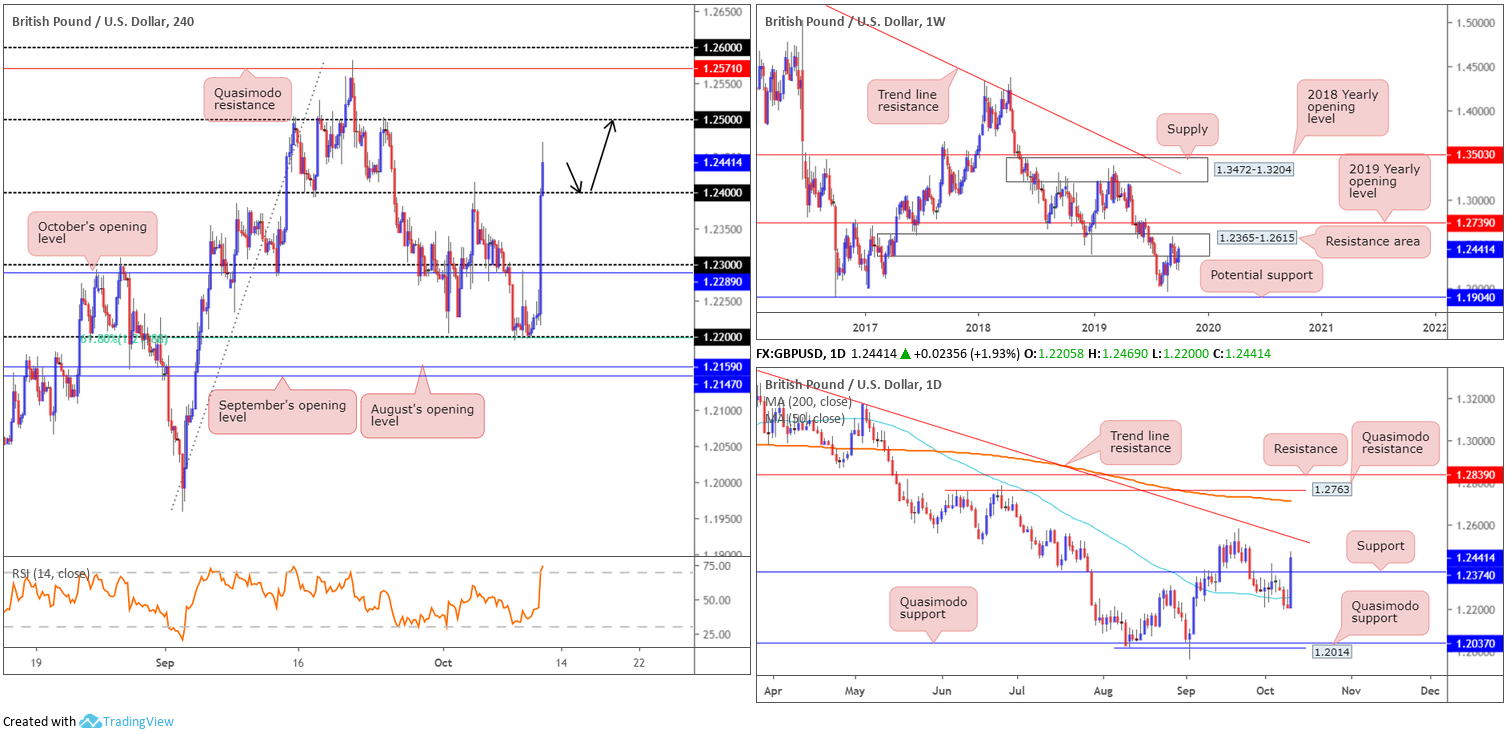
The British pound advanced sharply higher vs. its US counterpart Thursday amid breaking headlines surrounding Brexit. Adding more than 250 points, or 2.00%, the catalyst behind latest moves came following a three-hour meeting between UK and Irish PMs, concluding there is still a route towards reaching a deal on the backstop.
Travelling from a session low at 1.22 to highs at 1.2468, H4 flow settled decisively north of its 1.24 threshold, poised to potentially continue until crossing swords with 1.25. Several buy stops were triggered as a result of recent buying, specifically above 1.24 and the 1.2413 October 3 high.
Focus on the daily timeframe shifts to a break of resistance at 1.2374 (now acting support), likely unbolting the door to further buying towards trend line resistance taken from the high 1.3380. Weekly price, on the other hand, remains contained within the walls of a long-term resistance area at 1.2365-1.2615, sited just south of an additional layer of resistance at 1.2739: the 2019 yearly opening level.
Areas of consideration:
In attempt to take advantage of recent momentum, traders are likely eyeing a retest scenario off 1.24 (black arrows) to 1.25. While this setup houses additional support on the back of daily price recently dethroning resistance at 1.2374, traders are urged to take into account where the unit is positioned on the weekly timeframe: a resistance area.
Should the market dip its toe back into 1.24 today, the possibility of a fakeout through this figure is increased due to daily support being sited a few points south at 1.2374.
With the above in mind, a H4 move that pierces through 1.24 and draws in buyers from daily support might be on the cards. A rebound off 1.2374 followed through with a H4 close back above 1.24 would, despite weekly price, be considered a reasonably strong buy signal (entry may be found on the close of the breakout candle with a protective stop-loss order located either beneath 1.2374 or the breakout candle’s lower shadow).
AUD/USD:
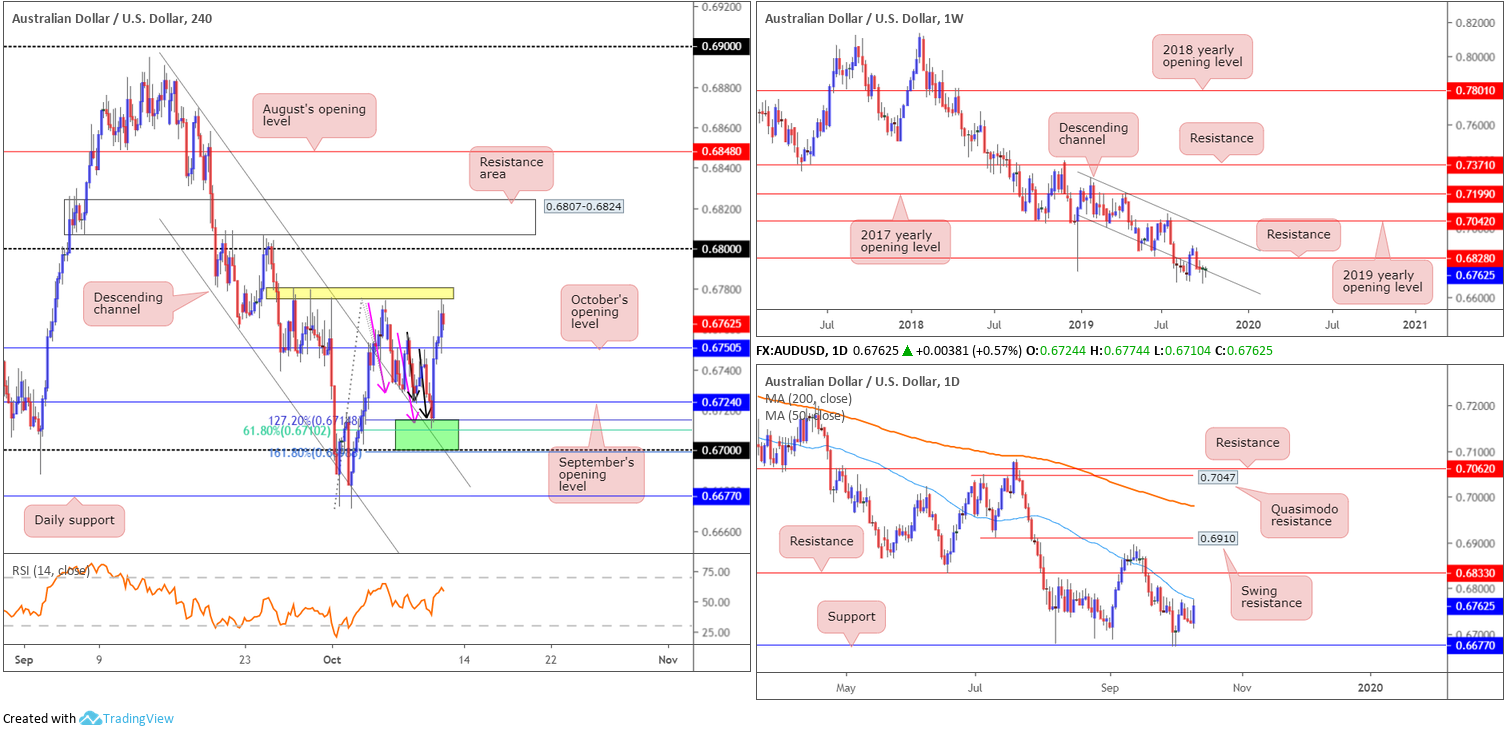
Optimism surrounding US/China trade talks, along with the US dollar index sweeping sub 99.00, appears to be the primary driver behind recent movement. The Australian dollar firmed against the buck Thursday, travelling from a low at 0.6710 to a high of 0.6774.
For traders who read Thursday’s technical research you may recall the following piece (italics):
September’s opening level at 0.6724 remains in motion on the H4 timeframe after, once again, failing to overthrow October’s opening level at 0.6750. An appealing area of H4 support resides a touch beneath 0.6724 between 0.6699/0.6714 (green). Comprised of two potential AB=CD corrections (pink and black arrows), largely formed by the 127.2%/161.8% area at 0.6714/0.6699, a channel resistance-turned support (extended from the high 0.6883), the round number 0.67 and a 61.8% Fibonacci ratio at 0.6710, this area boasts sufficient confluence to hold price, at least for a bounce.
Although the noted H4 support zone at 0.6699/0.6714 holds limited higher-timeframe convergence, local confluence on the H4 timeframe is likely enough to hold price action higher, with the possibility of a run back up to October’s opening level at 0.6750 (this also marks the 61.8% Fibonacci retracement of legs A-D – a common take-profit target for AB=CD patterns).
Well done to any readers who managed to jump onboard recent buying. The move easily cleared October’s opening level at 0.6750 and is now testing familiar tops around 0.6777 (yellow).
Higher-timeframe flow shows weekly price attempting to toughen its grip on channel support (extended from the low 0.7003), while daily price wrapped up yesterday’s session just ahead of the 50-day SMA (blue – 0.6777).
Areas of consideration:
H4 tops around 0.6777, as well as the 50-day SMA currently trading at the same value, is likely to weigh on attempts to reclaim weekly channel support (see above). For that reason, entering long with the expectation of reaching 0.68 may be chancy.
Selling short appears just as perilous. Not only do we have a daily bullish outside day recently formed, October’s opening level on the H4 at 0.6750 is also offering support.
In the absence of clearer price action, opting to remain flat may be the better path to take today.
USD/JPY:
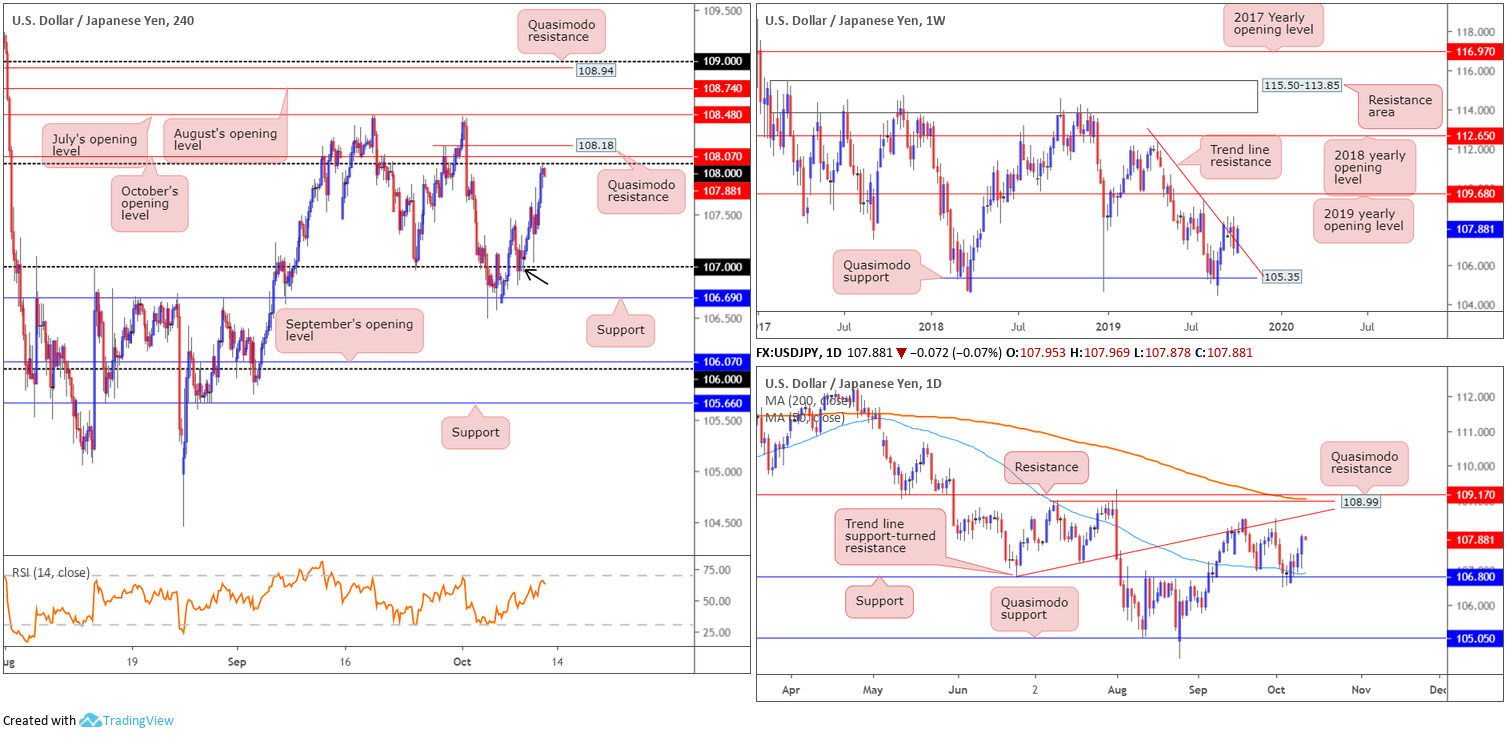
Demand for the safe-haven Japanese yen contracted for a second successive session Thursday, underpinned amid optimism concerning high-level trade talks between senior US and Chinese officials, as well as major US equity indexes recording gains across the board.
Guiding the USD/JPY to peaks just north of 108, traders long 107, based off a H4 hammer candlestick formation – considered a bullish signal (black arrow), have likely locked in handsome profits as 108 was noted as the initial take-profit target (see previous reports for details). Noted resistances positioned close by 108 are October’s opening level at 108.07 and Quasimodo resistance at 108.18. Beyond this range, July’s opening level is present at 108.48, closely followed by August’s opening level at 108.74.
In terms of daily structure, support priced in at 106.80, along with the 50-day SMA (blue – 106.93), recently held ground, exposing trend line support-turned resistance (taken from the low 106.78), shouldered closely together with Quasimodo resistance at 108.99, the 200-day SMA (orange – 109.06) and resistance coming in at 109.17.
Longer term, as stated in Thursday’s technical briefing, weekly action recently crossed above familiar trend line resistance extended from the high 112.40. Quasimodo support at 105.35 is eyed as the next downside target on this scale, while to the upside, the 2019 yearly opening level falls in as the next obvious resistance point at 109.68.
Areas of consideration:
The combination of H4 Quasimodo resistance at 108.18, October’s opening level at 108.07 and the 108 handle, forms a reasonably attractive resistance area, despite boasting limited connection with higher-timeframe flow. No doubt this will likely attract some technical selling today, though whether it’ll be enough to draw in serious sellers after recently breaking through weekly trend line resistance is difficult to judge.
Although unlikely to reach this high today, 109 is likely a point of interest for sellers in this market. Combining the 109 handle, a H4 Quasimodo resistance at 108.94, a daily Quasimodo resistance at 108.99, the 200-day SMA and another layer of daily resistance at 109.17, this area is certainly worthy of any trader’s watchlist.
USD/CAD:
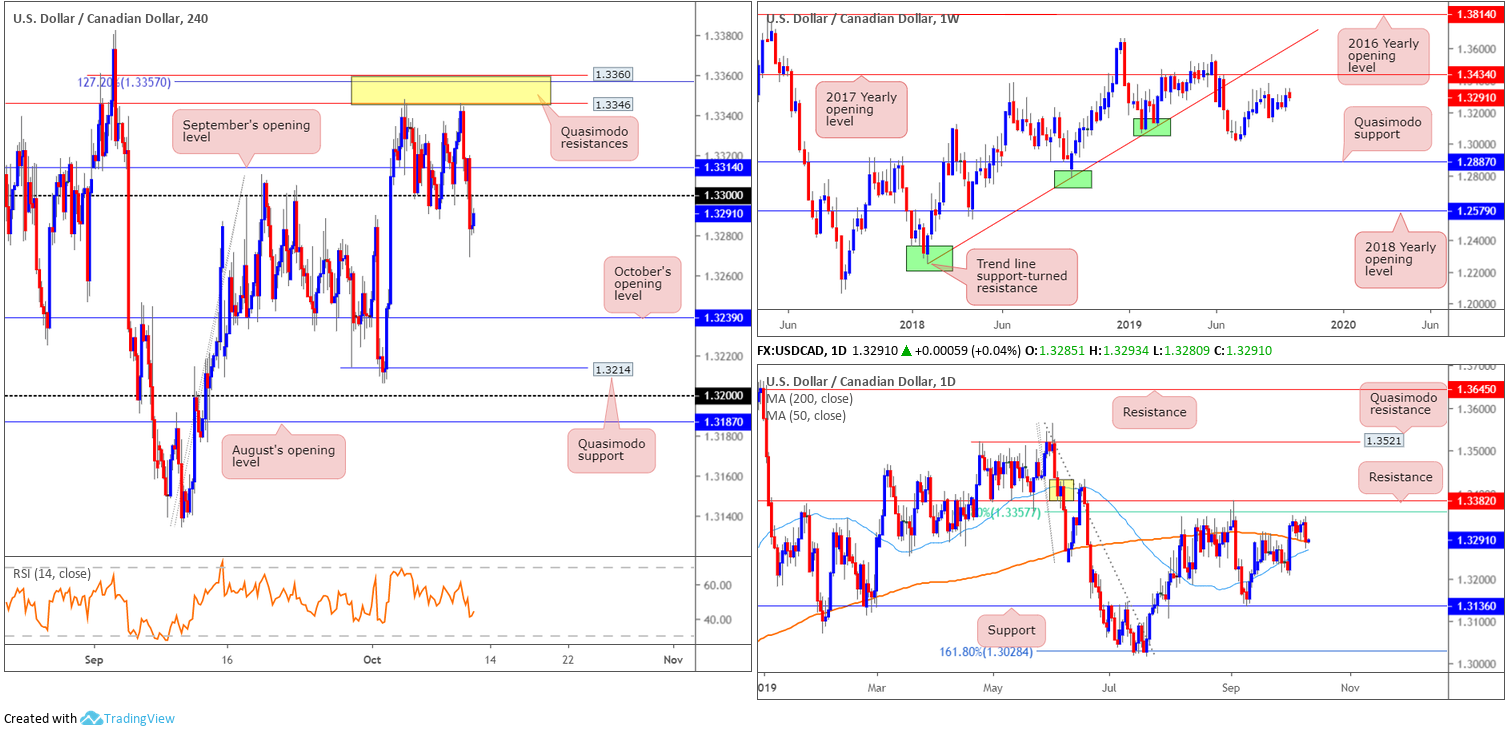
A reasonably dominant recovery in crude oil prices on the back of renewed trade optimism, a waning US dollar that reclaimed 99.00 and markets shrugging off mixed US data in the form of CPI and weekly initial claims, led a USD/CAD decline Thursday.
Chart studies reveal H4 movement reclaimed 1.33 to the downside in strong fashion, clocking session lows at 1.3268. Likely tripping sell stops beneath the psychological threshold, both for traders who attempted to fade the number and those selling the breakout, the move has potentially set the stage for a run to October’s opening level priced in at 1.3239.
Expanding the market’s timeframes, we can see daily price tested the 200-day SMA (orange – 1.3286) yesterday, with the 50-day SMA (blue – 1.3266) closing in fast. To the upside, resistance remains at 1.3382, sited just north of a 61.8% Fibonacci ratio at 1.3357. The story on the weekly timeframe shows that since early August, the candles have been entrenched within a consolidation just ahead of the 2017 yearly opening level at 1.3434.
Areas of consideration:
Initial thoughts are likely an attempt at shorts off the underside of 1.33 today if retested, targeting October’s opening level at 1.3239. This is a valid setup on the H4 timeframe, particularly if the retest forms by way of a bearish candlestick formation (entry and risk can be calculated according to this pattern), but uncertain on the daily timeframe, considering the 200/50-day SMAs. A daily close beneath the SMAs would likely clear out most buyers, targeting a possible move towards daily support at 1.3136.
USD/CHF:
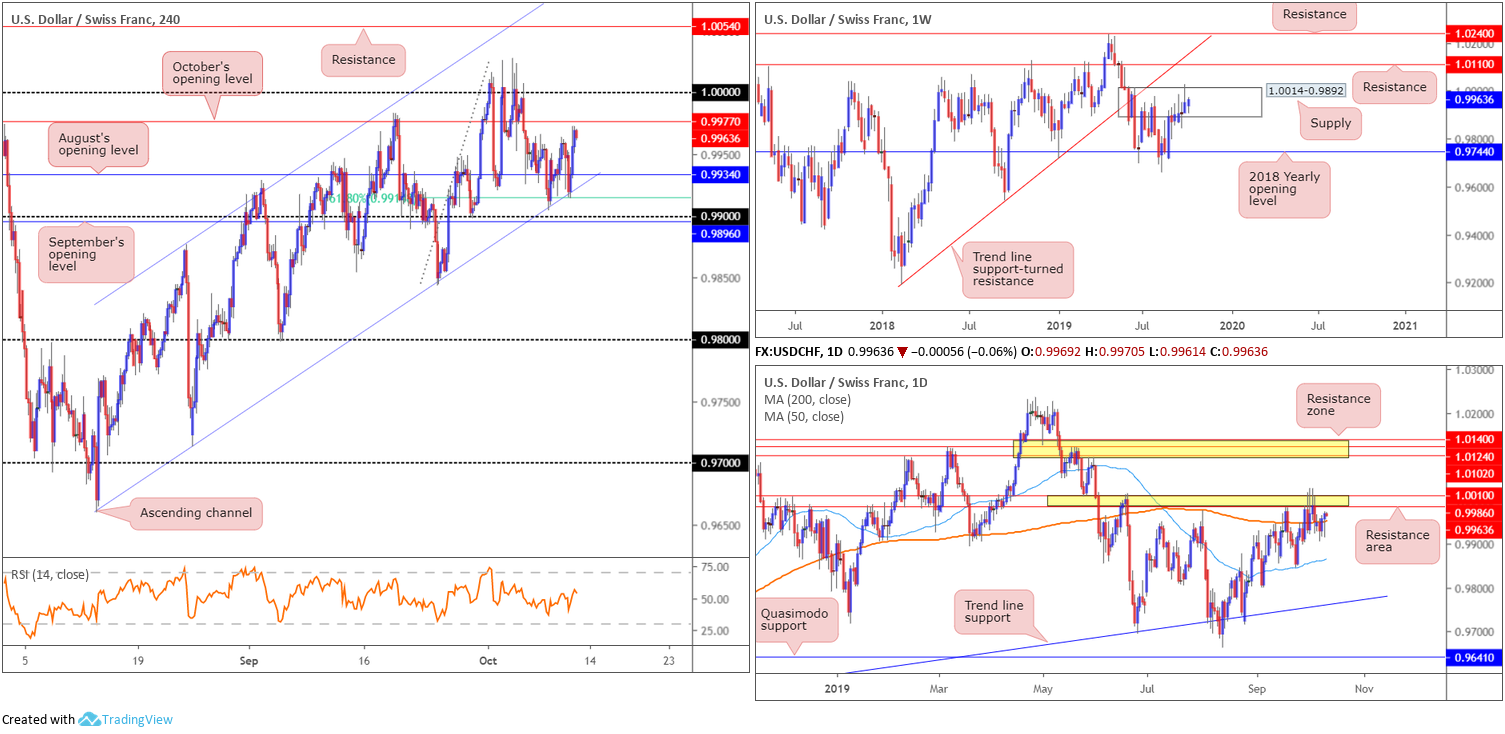
Improving risk sentiment, as markets respond to US/China trade developments, as well as surging US Treasury yields, collectively lifted the USD/CHF northbound Thursday.
Firming daily price north of its 200-day SMA (orange – 0.9952) the pair now faces immediate resistance between 1.0010/0.9986. A decisive push through these orders could lead to an approach towards 1.0140-1.0102.
Latest from the H4 timeframe reveals a modest recovery took shape off channel support (extended from the low 0.9659) combined with a 61.8% Fibonacci ratio at 0.9915. As you can see, price settled a few points south of October’s opening level at 0.9977, closely followed by 1.0000 (parity).
Higher up on the curve, the market remains confined within walls of supply at 1.0014-0.9892. While last week’s move to multi-month peaks at 1.0027 possibly tripped some buy stops, interest from the sell side of the market clearly remains. In the event of a push higher, nonetheless, traders are urged to note resistance coming in at 1.0110, with a break of this barrier exposing trend line support-turned resistance (etched from the low 0.9187). If downside persists, the 2018 yearly opening level at 0.9744 is marked as the next support base.
(Italics – information extracted from previous reports)
Areas of consideration:
Neither a long nor short appears attractive at present.
Entering long faces resistance on the H4 timeframe (0.9977 and 1.0000) and the weekly and daily timeframes (1.0014-0.9892 and 1.0010/0.9986, respectively).
Entering short has the 200-day SMA as potential support on the daily timeframe and H4 support in the form of August’s opening level at 0.9934.
Dow Jones Industrial Average:
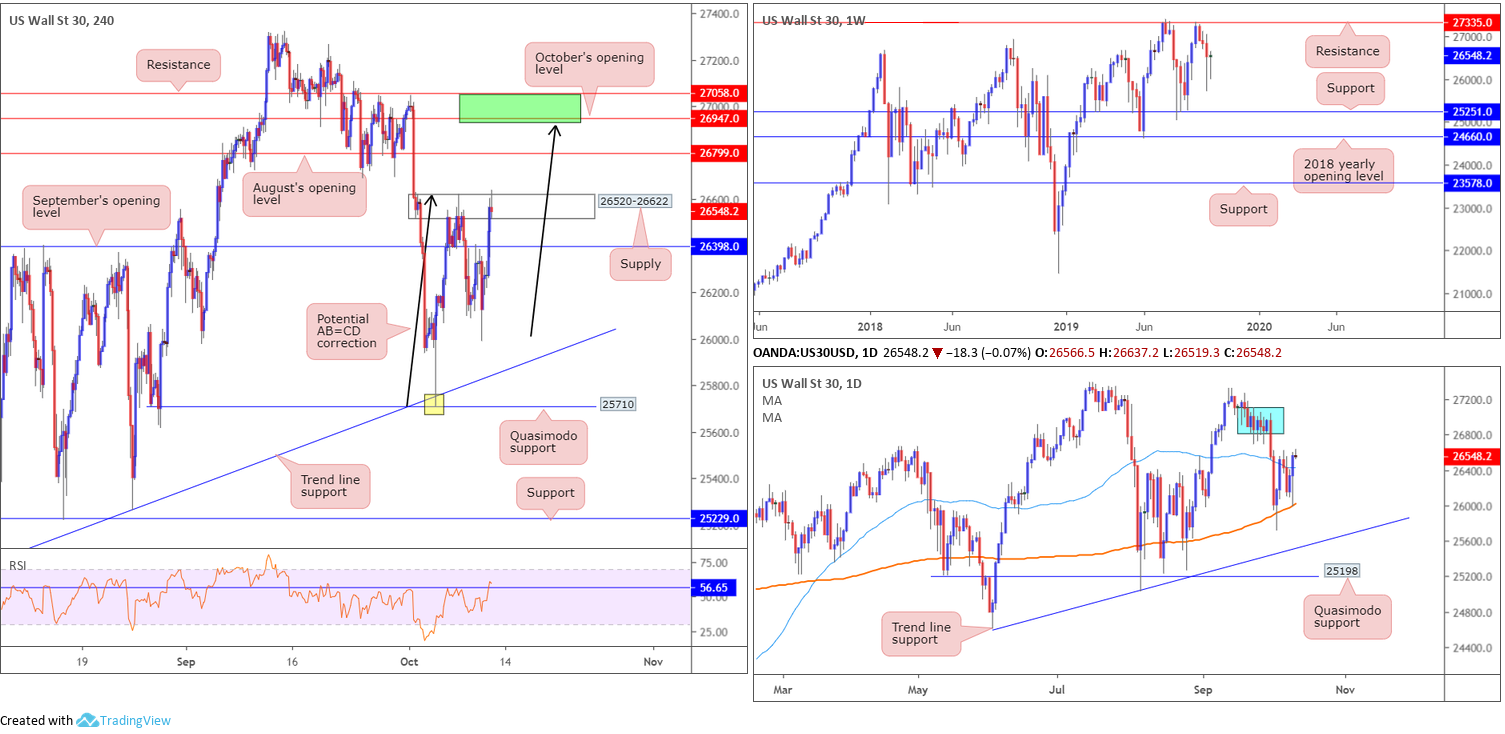
US equity indexes finished higher across the board Thursday as the market took an optimistic stance ahead of the resumption of high-level trade talks. The Dow Jones Industrial Average added 150.66 points, or 0.57%; the S&P 500 also added 18.73 points, or 0.64%, and the tech-heavy Nasdaq 100 gained 49.83 points, or 0.65%.
Technical action has H4 price challenging the upper boundary of supply at 26520-26622, after brushing aside September’s opening level at 26398. Continued bidding from here will not only clear buy stops above the said supply, it’ll likely draw in August’s opening level at 26799. Another consideration on this timeframe is the completion of an AB=CD correction (black arrows) sited just south of October’s opening level at 26947.
The broader landscape has weekly price trading in no man’s land at the moment, meandering between resistance at 27335 and a support coming in at 25251. Daily movement, nonetheless, tunnelled through its 50-day SMA (blue – 26426), consequently exposing supply between 27110-26813 (blue – positioned just south of weekly resistance at 27335).
Areas of consideration:
The area between H4 resistance at 27058, October’s opening level at 26947 and a H4 AB=CD correction (black arrows) marked in green is likely a zone of interest for sellers today/next week. Even more so knowing the H4 sell zone is housed within daily supply at 27110-26813. However, given the area is susceptible to a fakeout to weekly resistance at 27335, traders may consider waiting for additional candlestick confirmation to form before pulling the trigger. That way, seller intent is visible and additional entry and risk levels are available to trade.
XAU/USD (GOLD):
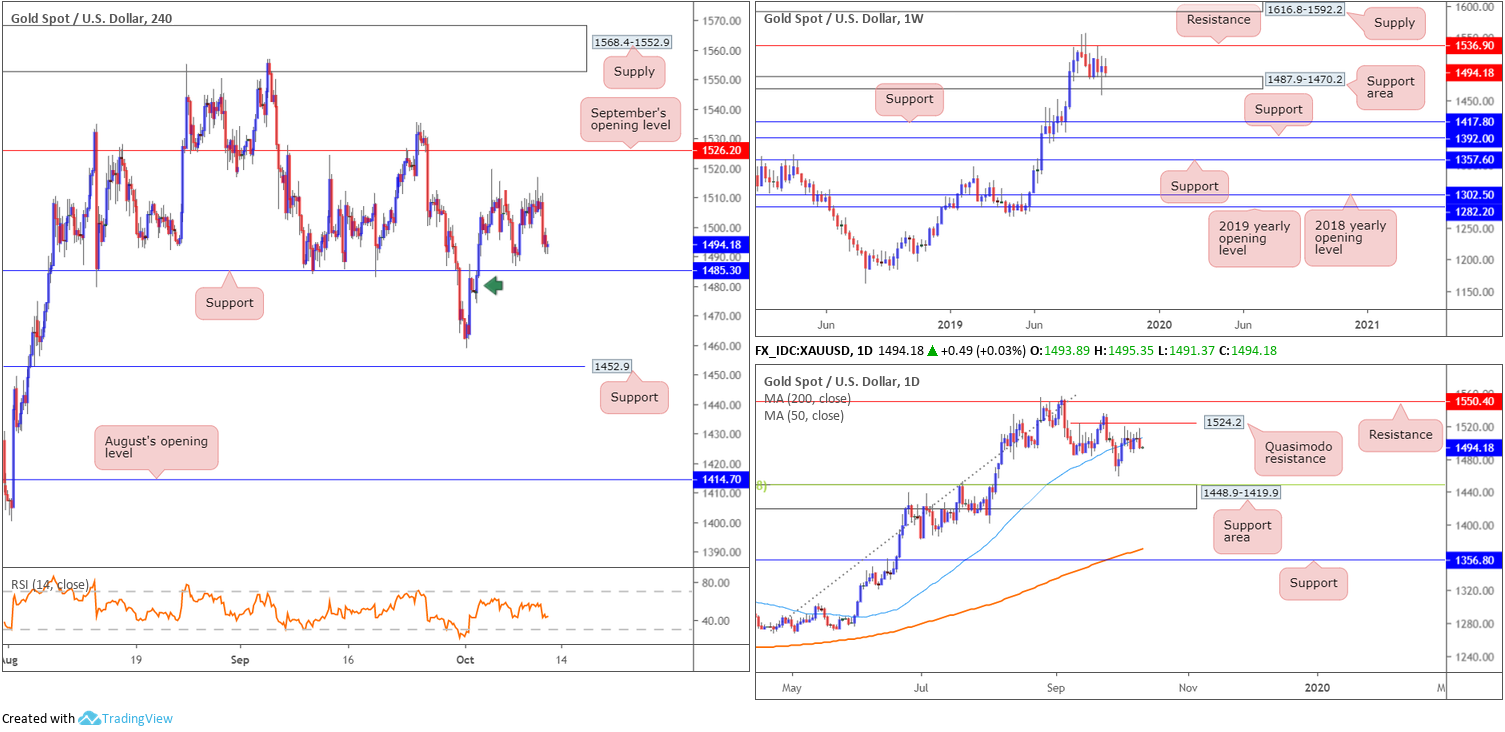
Gold’s safe-haven status faded Thursday amid improving risk sentiment as markets responded to US/China trade developments. Down 0.78%, yesterday’s daily candle wrapped up the session in the shape of a bearish outside day that closed beneath the 50-day SMA (blue – 1506.8), implying further selling may be in store to at least the 1459.2 October 1 low.
Higher up on the curve, however, we have the weekly candles consolidating between a support area at 1487.9-1470.2 and a resistance level at 1536.9 – currently trading at the bottom end of this range. The current position on the H4 timeframe shows price remains poised to approach support at 1485.3, which happens to be encapsulated within a demand area at 1474.3-1487.3 (green arrow).
Areas of consideration:
Outlook unchanged.
The primary trend, clearly visible on the weekly timeframe, appears in good shape. This – coupled with weekly price testing a support area – highlights H4 support at 1485.3 as a possible buy zone. For conservative buyers, waiting for additional candlestick confirmation to form might be an option worth exploring before executing a trade. This helps recognise commitment from the buy side of this market and will, if traders understand the candlestick’s entry and exit points, provide levels to trade from.
The accuracy, completeness and timeliness of the information contained on this site cannot be guaranteed. IC Markets does not warranty, guarantee or make any representations, or assume any liability regarding financial results based on the use of the information in the site.
News, views, opinions, recommendations and other information obtained from sources outside of www.icmarkets.com.au, used in this site are believed to be reliable, but we cannot guarantee their accuracy or completeness. All such information is subject to change at any time without notice. IC Markets assumes no responsibility for the content of any linked site.
The fact that such links may exist does not indicate approval or endorsement of any material contained on any linked site. IC Markets is not liable for any harm caused by the transmission, through accessing the services or information on this site, of a computer virus, or other computer code or programming device that might be used to access, delete, damage, disable, disrupt or otherwise impede in any manner, the operation of the site or of any user’s software, hardware, data or property.


