
Key risk events today:
BoE Gov Bailey Speaks; Euro Summit; US PPI m/m.
(Previous analysis as well as outside sources – italics).
EUR/USD:
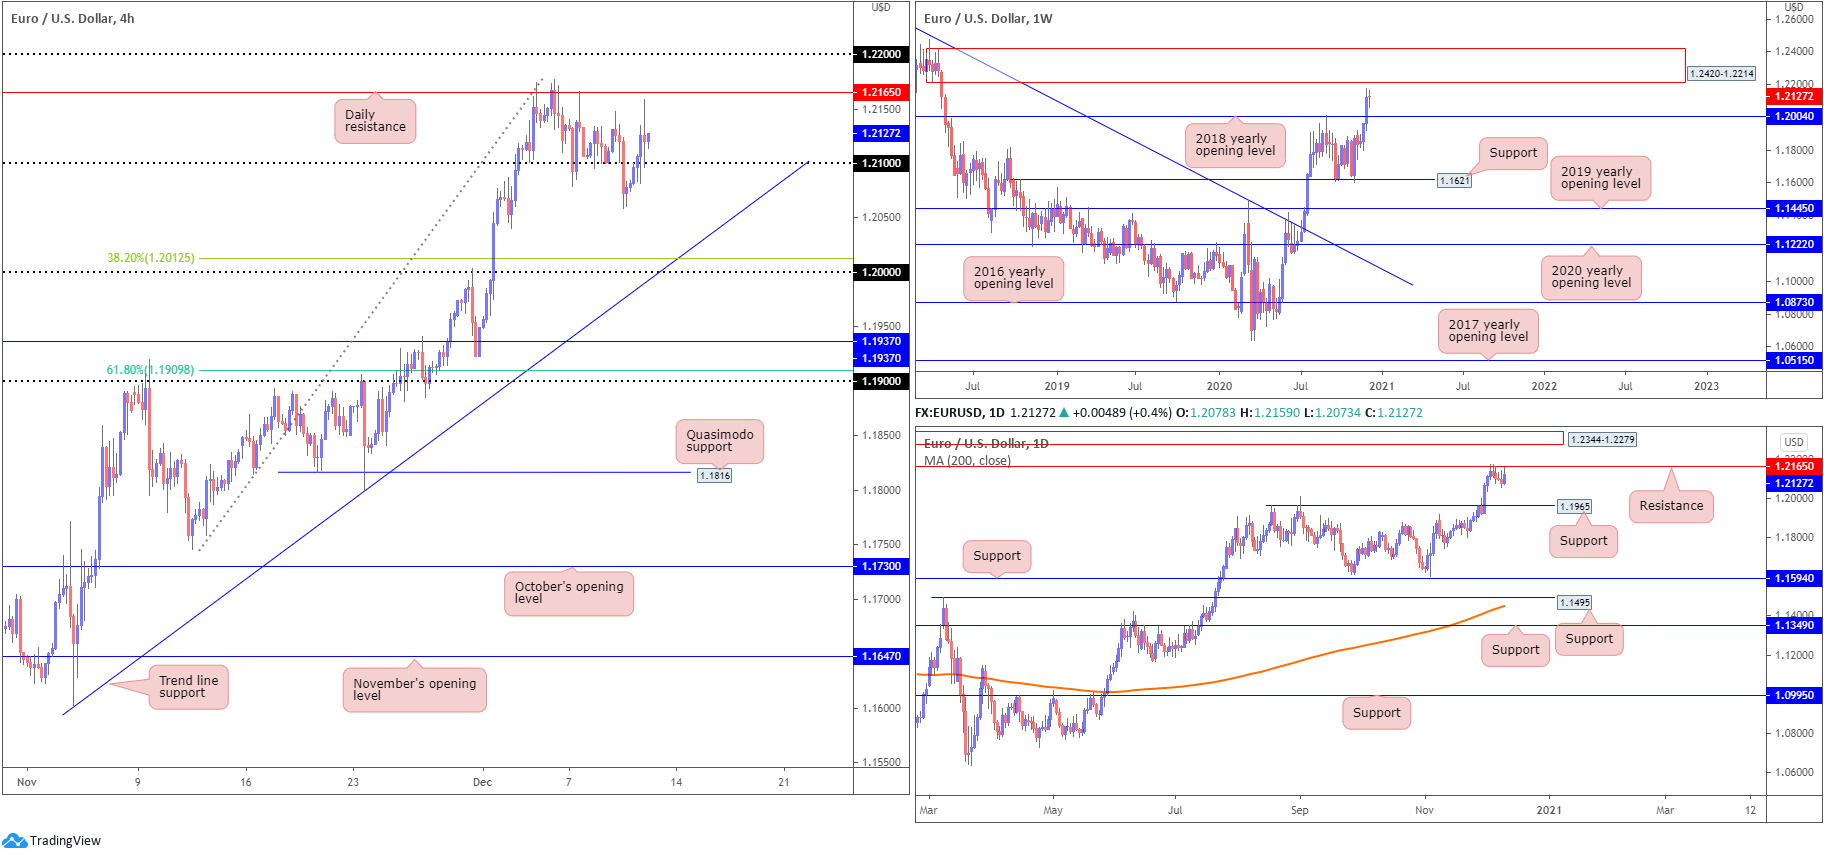
The US dollar index found soft grip north of 91.00 and consequently retreated into negative territory on Thursday, elevating EUR/USD above 1.21 to peaks at 1.2159. The ECB’s policy announcement largely fell in line with consensus, with interest rates unchanged. US inflation metrics, on the other hand, came in moderately stronger than expected.
H4 holding 1.21 as support shines the spotlight on daily resistance drawn from 1.2165, with a break exposing the 1.22 handle.
Further out on the bigger picture, weekly flow consolidates around the prior week’s highs, ahead of supply at 1.2420-1.2214. Traders may also wish to acknowledge the supply houses another supply seen on the daily scale at 1.2344-1.2279 (above current daily resistance).
Areas of consideration:
- The uptrend remains in a healthy state, seen clearly from both the weekly and daily timeframes.
- Bids off 1.21 are present on the H4, with buyers likely to retest daily resistance from 1.2165.
- 1 22 is a significant barrier, one which could entice sellers. A mild fakeout above the level, a whipsaw that not only taps into any buy-stops above 1.22 but also tests the underside of weekly supply at 1.2214 (potentially strong offers), unlocks the possibility of fresh sellers making an appearance.
GBP/USD:
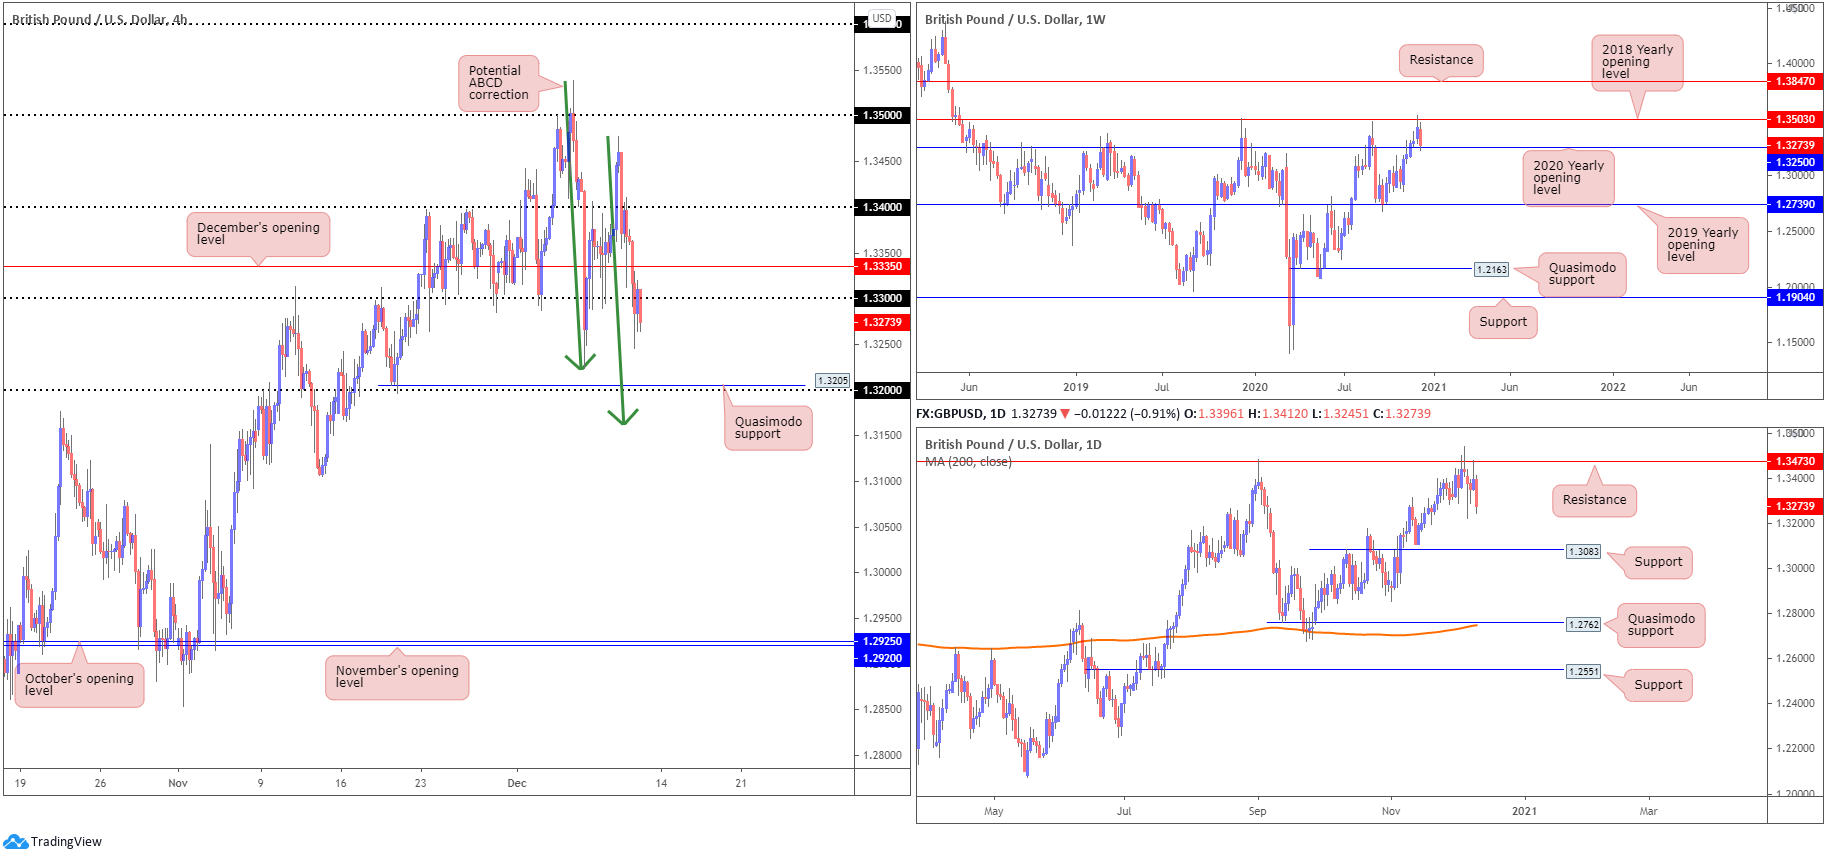
The British pound underperformed against its US counterpart Thursday, weighed on the back of Brexit flow. H4, as you can see, retested the underside of 1.34 into Wednesday’s close, clearly a welcomed view by sellers as the unit went forward yesterday and voyaged through December’s opening value at 1.3335 and the 1.33 handle. With bids cleared from the aforementioned levels, H4 Quasimodo support at 1.3205 and the 1.32 handle is in the firing line, closely followed by an ABCD bullish pattern (green arrows) at 1.3162.
From the daily timeframe, GBP/USD established a shooting star pattern Wednesday, with Thursday responding strongly to the downside. Interestingly, we can see a lack of daily support until reaching the 1.3083 region.
Higher up on the curve, however, the weekly timeframe is balancing off support derived from the 2020 yearly opening value at 1.3250, following last week’s test of resistance at 1.3503, the 2018 yearly opening value. Similar to EUR/USD, GBP/USD also managed to eke out fresh YTD highs last week, with the immediate trend pulling to the upside since March troughs at 1.1409.
Areas of consideration:
- Intraday bearish scenarios forming south of 1.33 (H4) are possible, targeting 1.32. Though many traders may be discouraged here due to weekly support formed at 1.3250 (the 2020 yearly opening value).
- 32, H4 Quasimodo support at 1.3205, and the H4 ABCD bullish pattern at 1.3162 represents a collective support zone to be mindful of.
AUD/USD:
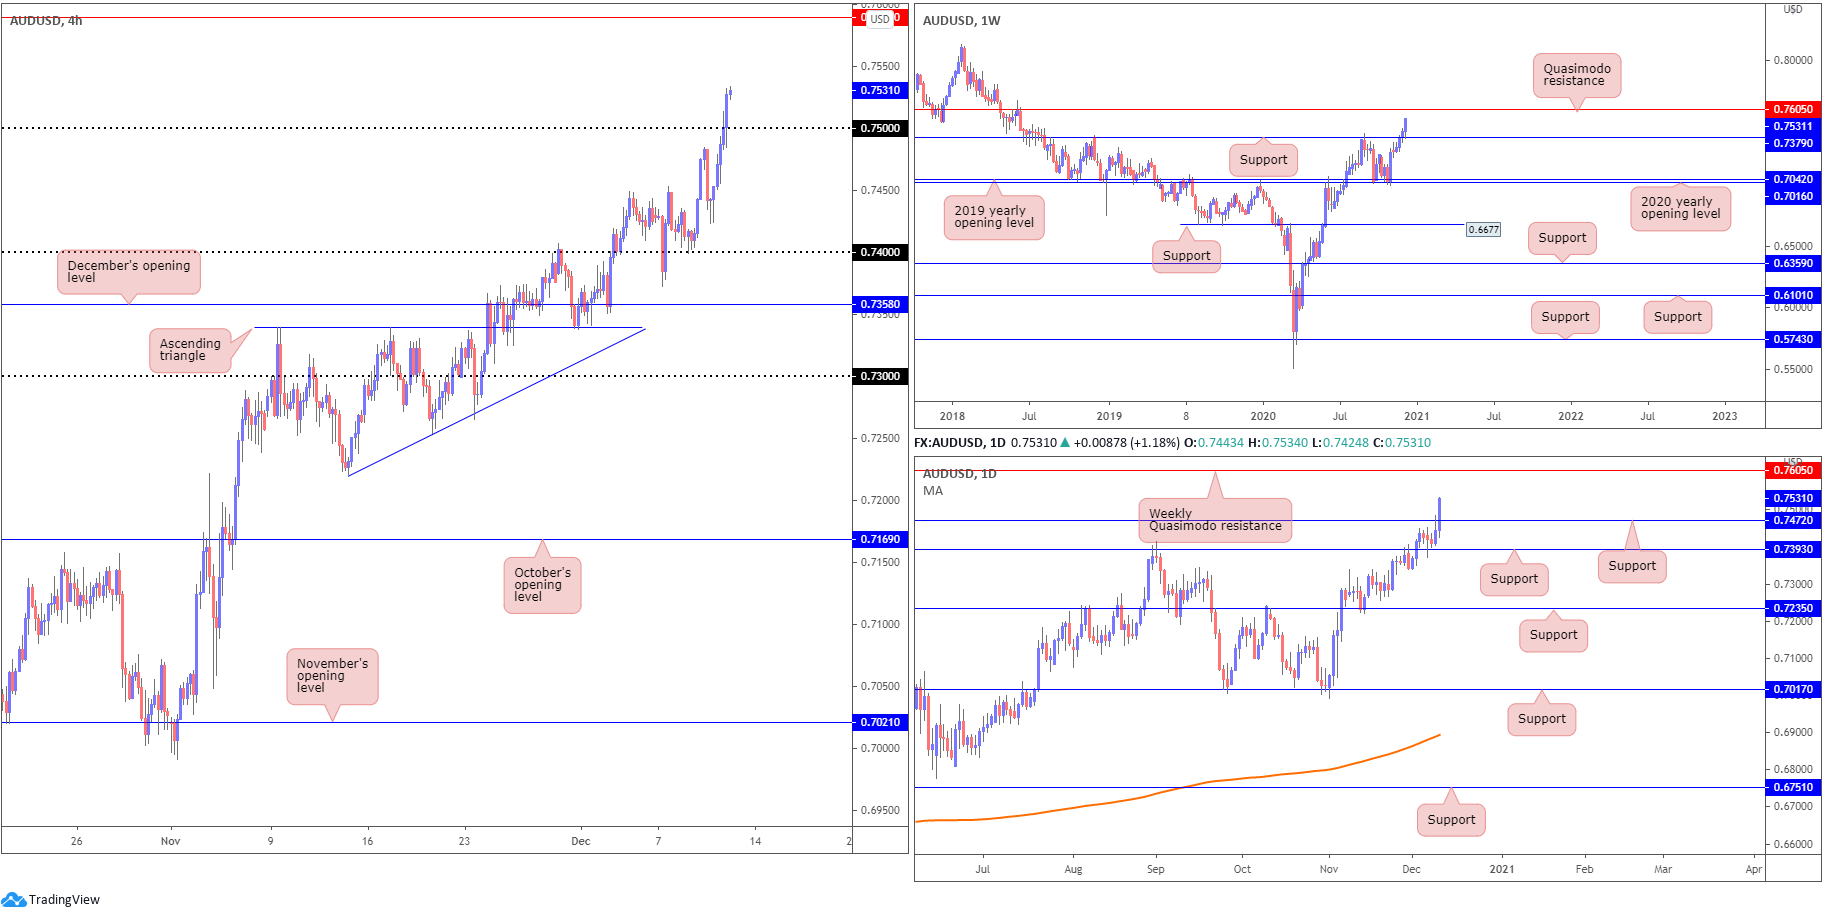
The US dollar struggling to entice fresh buyers aided the AUD/USD’s surge to fresh YTD peaks on Thursday. Reaching levels not visited since June 2018, H4 crushed offers around 0.75 and signalled the possibility of further buying to resistance at 0.7590 and the 0.76 handle.
Similar to the H4 scale, an absence of resistance is observed on the higher timeframes, with upside perhaps free until shaking hands with weekly Quasimodo resistance at 0.7605.
Areas of consideration:
- The combination of daily support at 0.7472 and the 0.75 handle on the H4 is interesting support, should a correction develop today. Upside targets rest at 0.7550, H4 resistance from 0.7590, the 0.76 handle and weekly Quasimodo resistance at 0.7605.
USD/JPY:
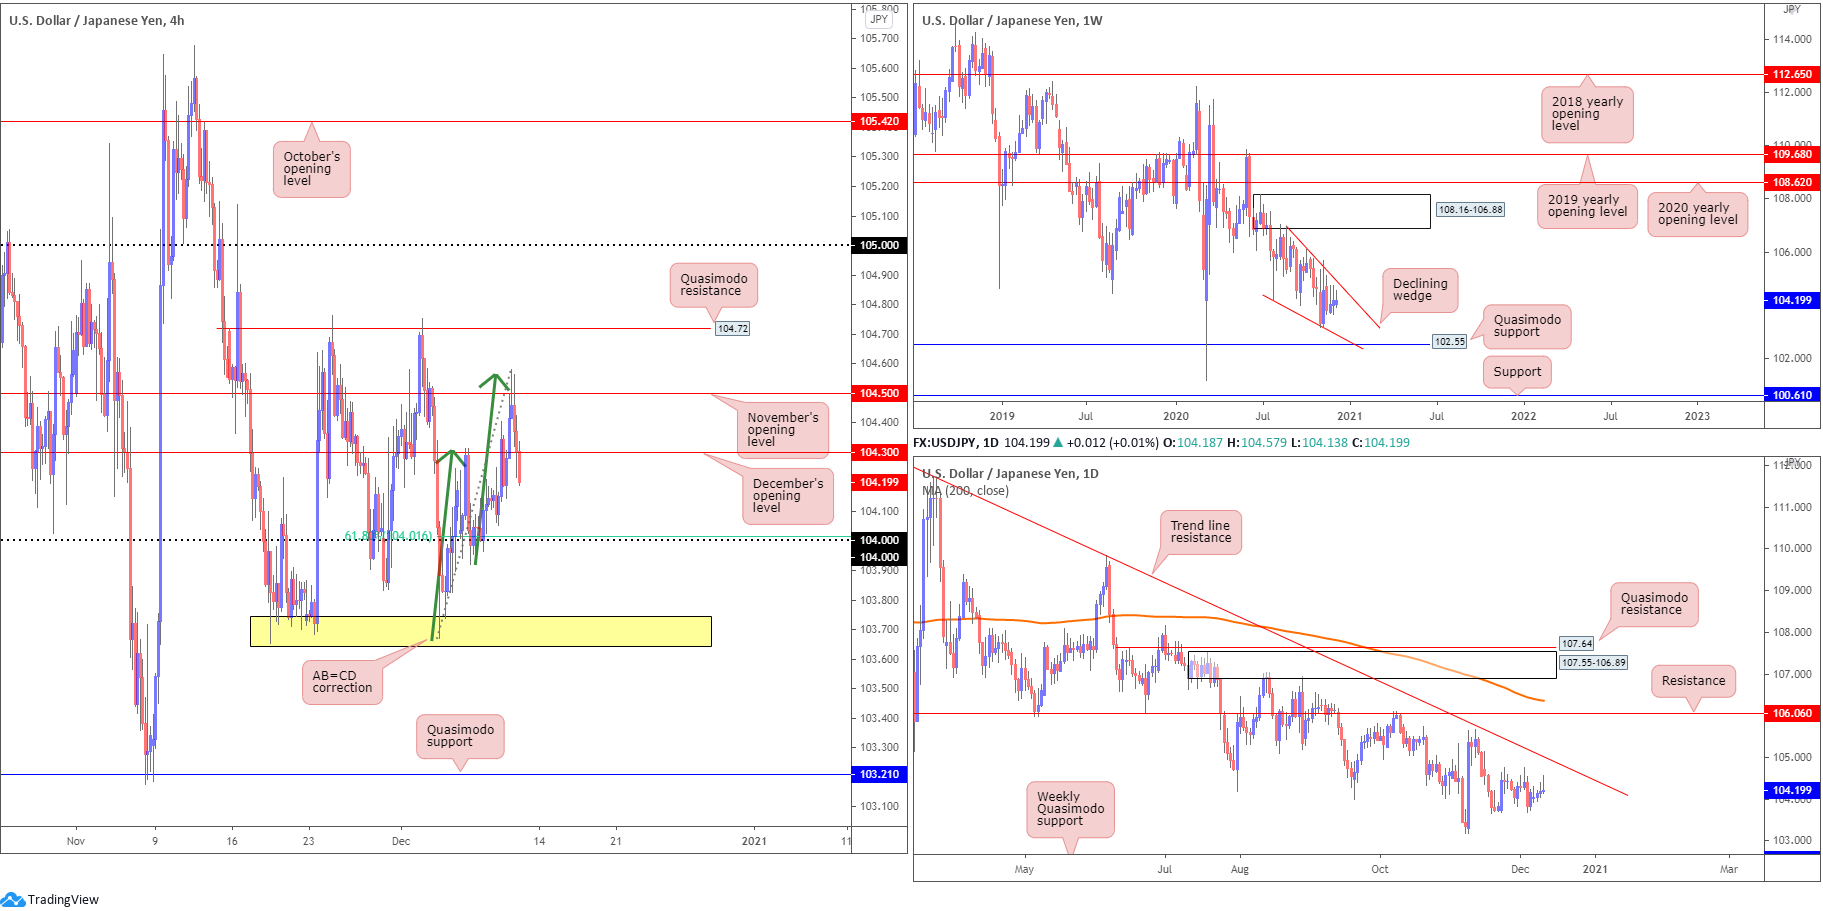
USD/JPY welcomed a soft tone on Thursday, pressured by the DXY fading 91.00. Technically, H4 candles connected with November’s opening value priced in at 104.50 and formed an AB=CD bearish pattern (green arrows) at 104.56. This led the unit back under December’s opening value at 104.30, and shifted focus to the 104 handle (and 61.8% Fibonacci retracement ratio at 104.01). The plot of support below 104, around 103.70 (yellow), also remains important.
The technical frame remains unchanged on the weekly timeframe (italics):
Since connecting with the underside of weekly supply at 108.16-106.88 in August, price has gradually shifted lower and developed a weekly declining wedge (106.94/104.18). Weekly Quasimodo support at 102.55 is also in the picture, with a break revealing support plotted at 100.61. A strong bounce from 102.55, however, may provide enough impetus for buyers to attempt a breakout above the current declining wedge.
Although daily action remains at a standstill, the pair printed a noticeable shooting star pattern on Thursday (italics):
The technical landscape from the daily timeframe reveals scope to close in on trend line resistance, extended from the high 111.71. Sellers taking over, nevertheless, could lead price to the 103.17 November 6 low, followed by the noted weekly Quasimodo support at 102.55.
Areas of consideration:
- 104 may deliver support if retested, merging with a H4 61.8% Fibonacci retracement ratio at 104.01 (commonly viewed as an ABCD take-profit level).
- 70 on the H4 scale is also still in view.
- Removing H4 support around 103.70 moves H4 Quasimodo support at 103.21 on to the radar as a possible downside objective for intraday bearish scenarios.
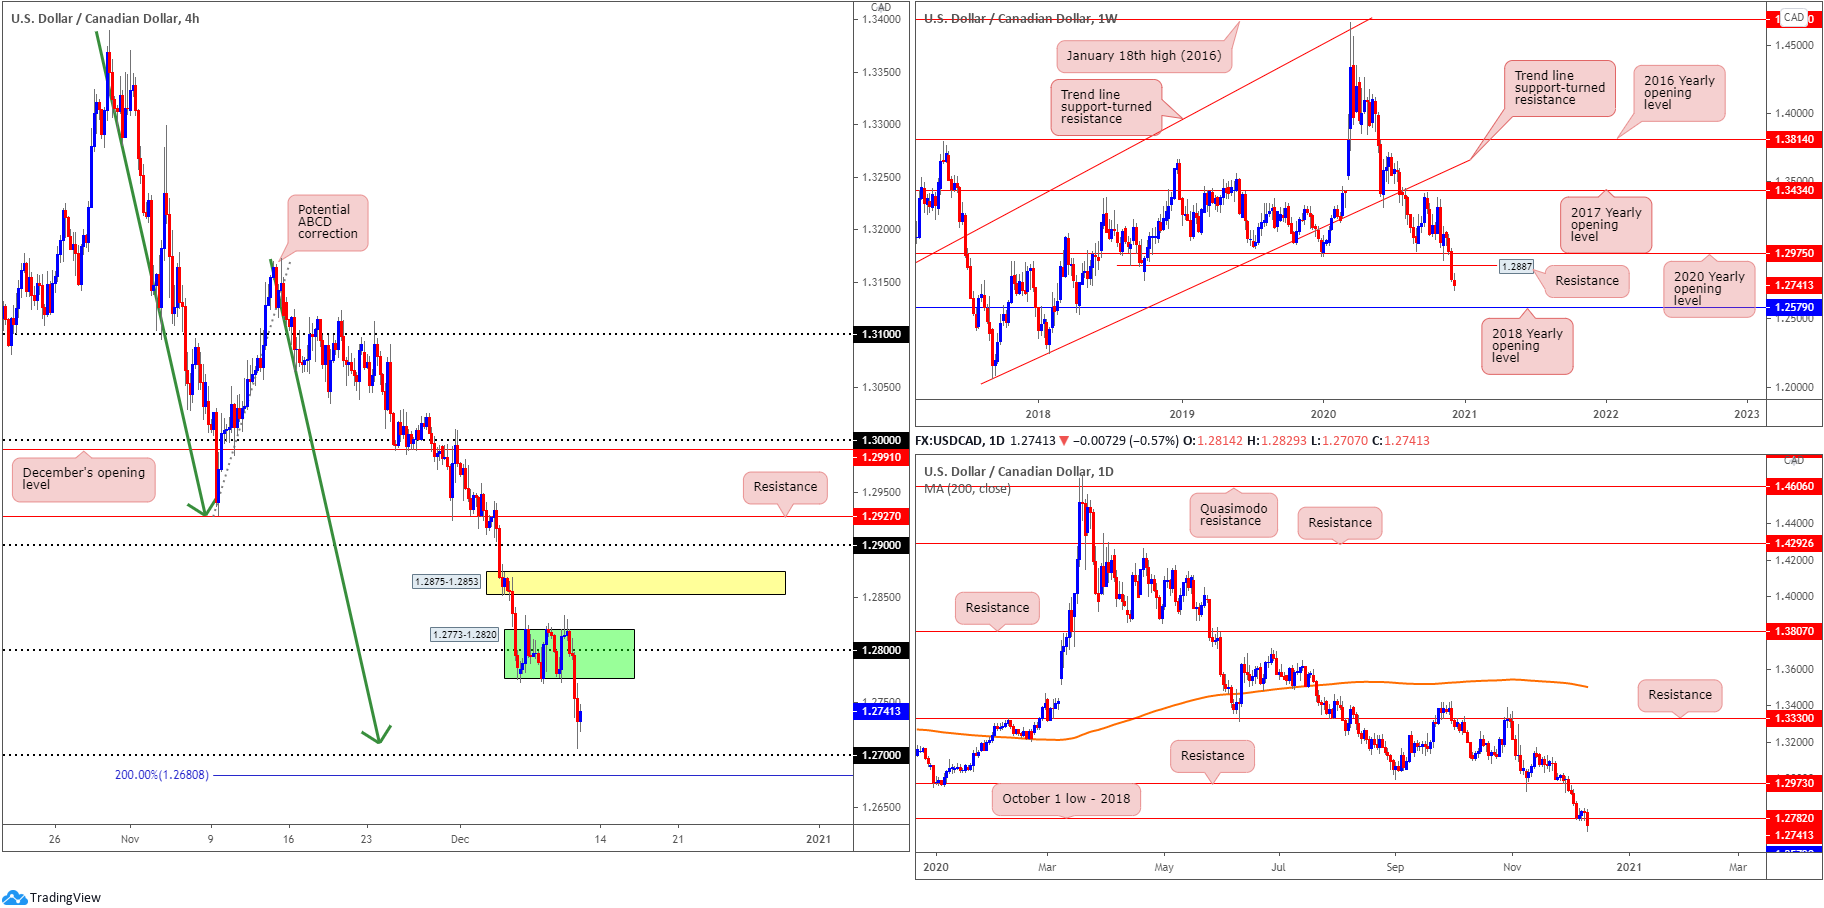
USD/CAD:
Crude oil prices rallying to highs at $47.72 a barrel and the DXY working with levels south of 91.00 supported a USD/CAD decline Thursday, clocking multi-year lows. Since the beginning of the week, H4 candles have been busy carving out a consolidation around the 1.28 area between 1.2773-1.2820 (green). As you can see, the lower edge of this range was taken out yesterday, scoring lows just north of the 1.27 handle, a psychological level accompanied by an ABCD correction (green arrows) at 1.2711 and a 2.0 BC projection.
The latest wave of selling brushed aside bids at daily support from 1.2782 (October’s low, 2018), as suggested by the weekly timeframe recently overrunning the 2020 yearly opening value at 1.2975 and Quasimodo support coming in at 1.2887. According to the weekly timeframe, further downside could be on the cards, targeting support at 1.2579, the 2018 yearly opening value.
Areas of consideration:
- H4 technicals display reasonably bright support, composed of the 1.27 handle and an ABCD correction (green arrows) at 1.2711 and a 2.0 BC projection at 1.2680.
- Weekly price showing a reasonably free rein to the 2018 yearly opening value at 1.2579 signals H4 buying could struggle, particularly as daily support from 1.2782 also recently gave way. Therefore, a H4 close under the 1.27 region could signal a bearish theme to at least 1.26 (H4).
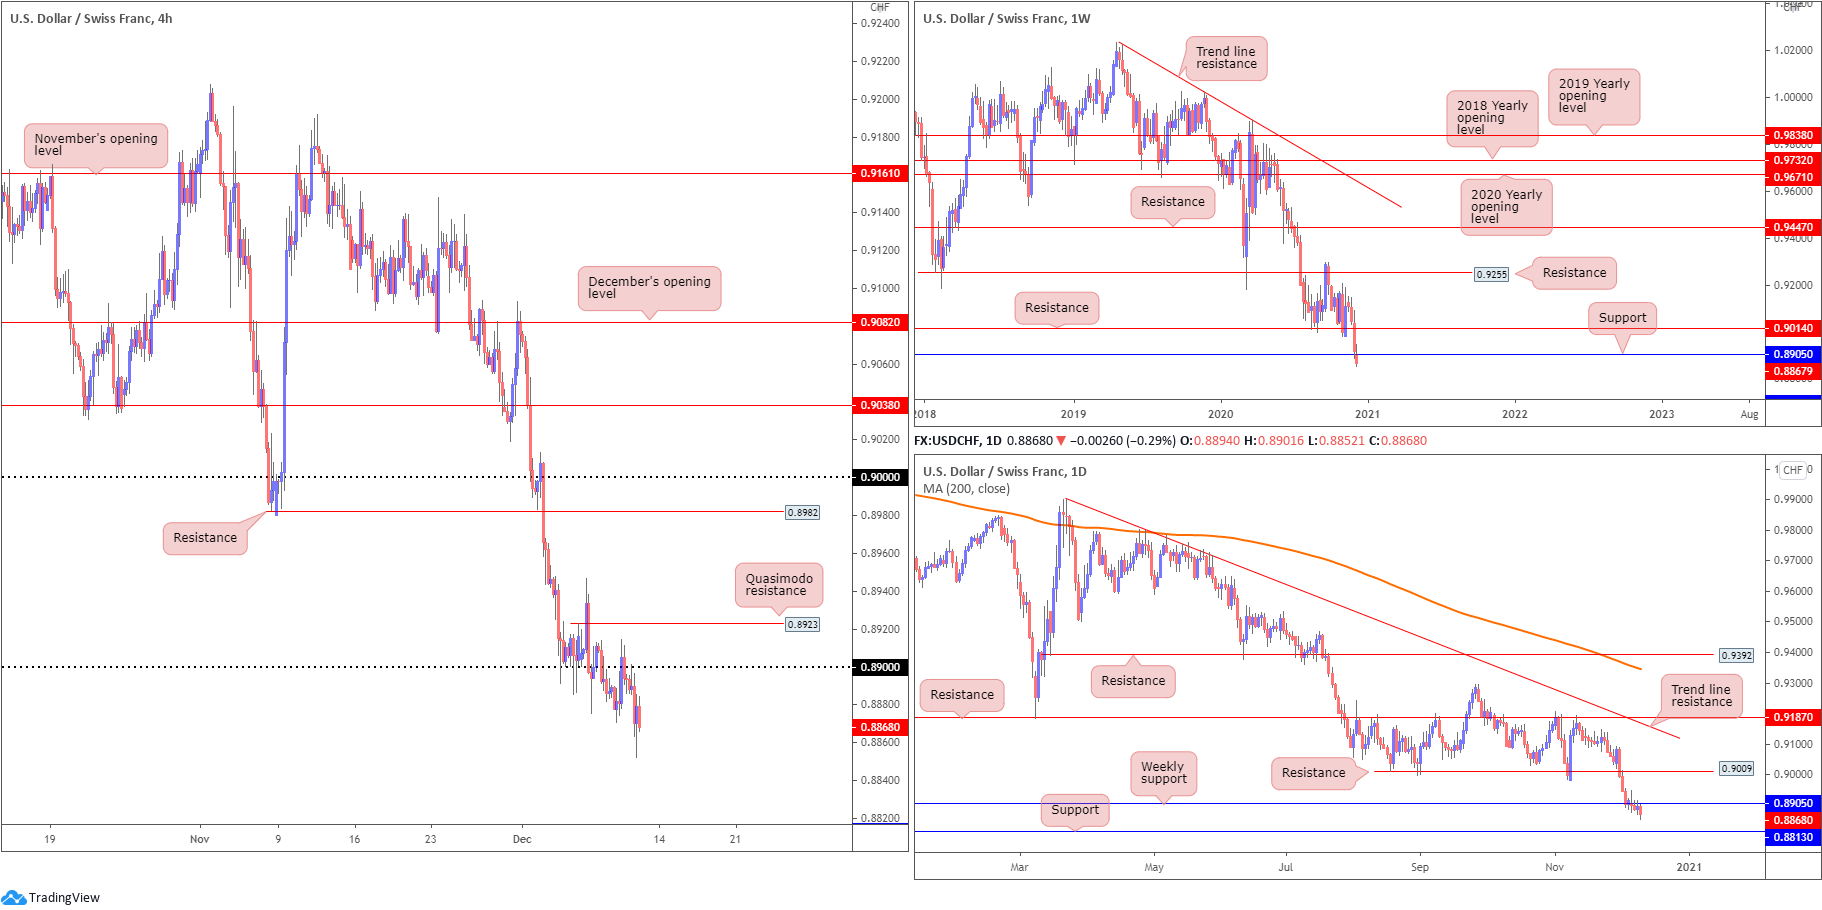
USD/CHF:
For those who read Thursday’s technical briefing you may recall the following points (italics):
The retest at 0.89 has clearly interested sellers, given the lack of supportive flow evident on the bigger picture at the moment.
A test of H4 Quasimodo resistance at 0.8923 is not out of the question today, and could, similar to the above, draw interest due to the position of price action on the higher timeframes.
As evident from the H4 chart, sellers warmed to the idea of a sell-off from the underside of 0.89 and refreshed YTD lows on Thursday.
The technical framework on the higher timeframes show both weekly and daily flow tackling weekly support at 0.8905, with the weekly chart suggesting room to drop as far south as support at 0.8696 (interestingly, the trend in this market has been lower since early 2019) and daily price showing support at 0.8813.
Areas of consideration:
- All three timeframes indicate thin buy-side liquidity until reaching 0.88, therefore further selling could devastate nearby bids.
- Lower timeframe traders are likely in search of bearish scenarios to take advantage of any additional downside.
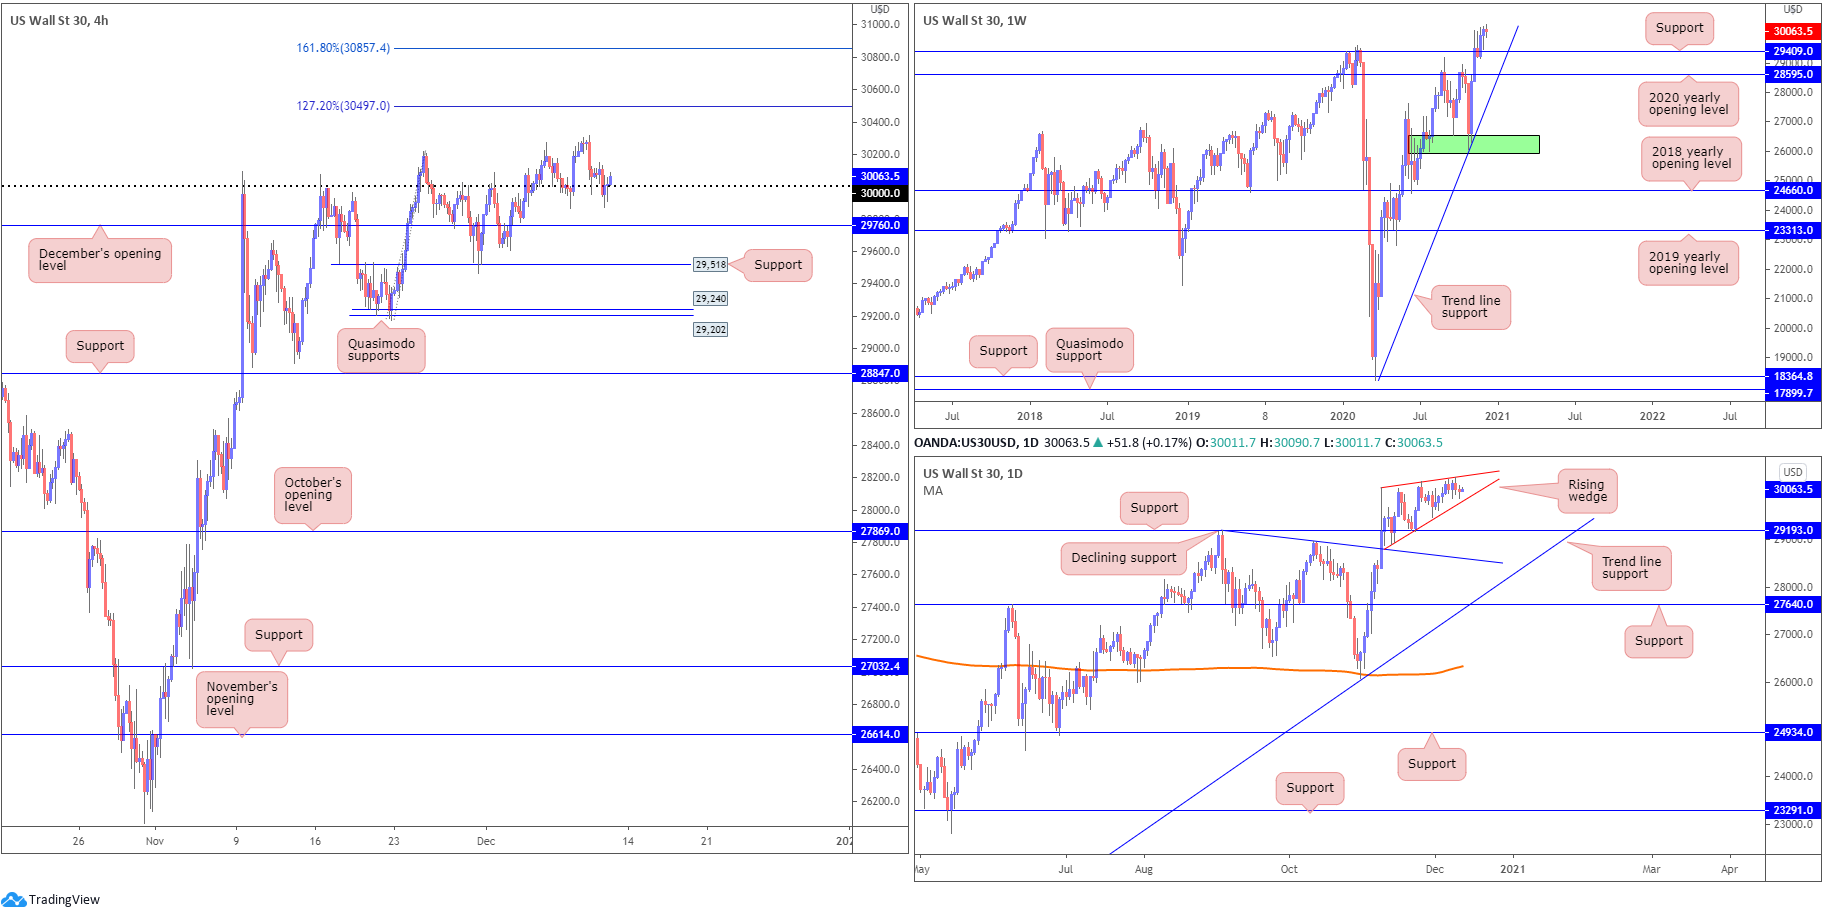
Dow Jones Industrial Average:
US equities finished Thursday mixed amidst stimulus negotiations. The Dow Jones Industrial Average shed 69.55 points, or 0.23%; the S&P 500 dropped 4.72 points, or 0.13% and the Nasdaq added 66.86 points, or 0.54%.
30,000 continues to share the spotlight on the H4 scale, holding a relatively strong bid. Subsequent upside could have buyers eventually cross swords with fresh all-time peaks and test the 127.2% Fibonacci projection point at 30,497, followed by the 161.8% Fibonacci projection point at 30,857. Failure to hold 30,000 could see December’s opening value at 29,760 make an appearance, aligning closely with the lower edge of the daily rising wedge, drawn from a low of 28,940 and a high from 30,097.
From the weekly timeframe, we can see that in the event a correction materialises, support at 29,409 (prior Quasimodo resistance) could be an area dip-buyers find interest in. According to the daily timeframe, support is seen at 29,193. Pattern traders may also acknowledge the rising wedge forming, highlighted above between 28,940/30,097.
Areas of consideration:
In light of the lacklustre movement seen Thursday, the technical position remains unchanged.
- 30,000 represents key support on the H4 scale, with upside targets resting at 30,497 and 30,857. December’s opening value at 29,760 is next on tap in terms of support, converging with daily structure (the lower limit of the rising wedge).
- The rising wedge seen on the daily timeframe, should its lower edge be engulfed, sellers could force a retest of daily support at 29,193.
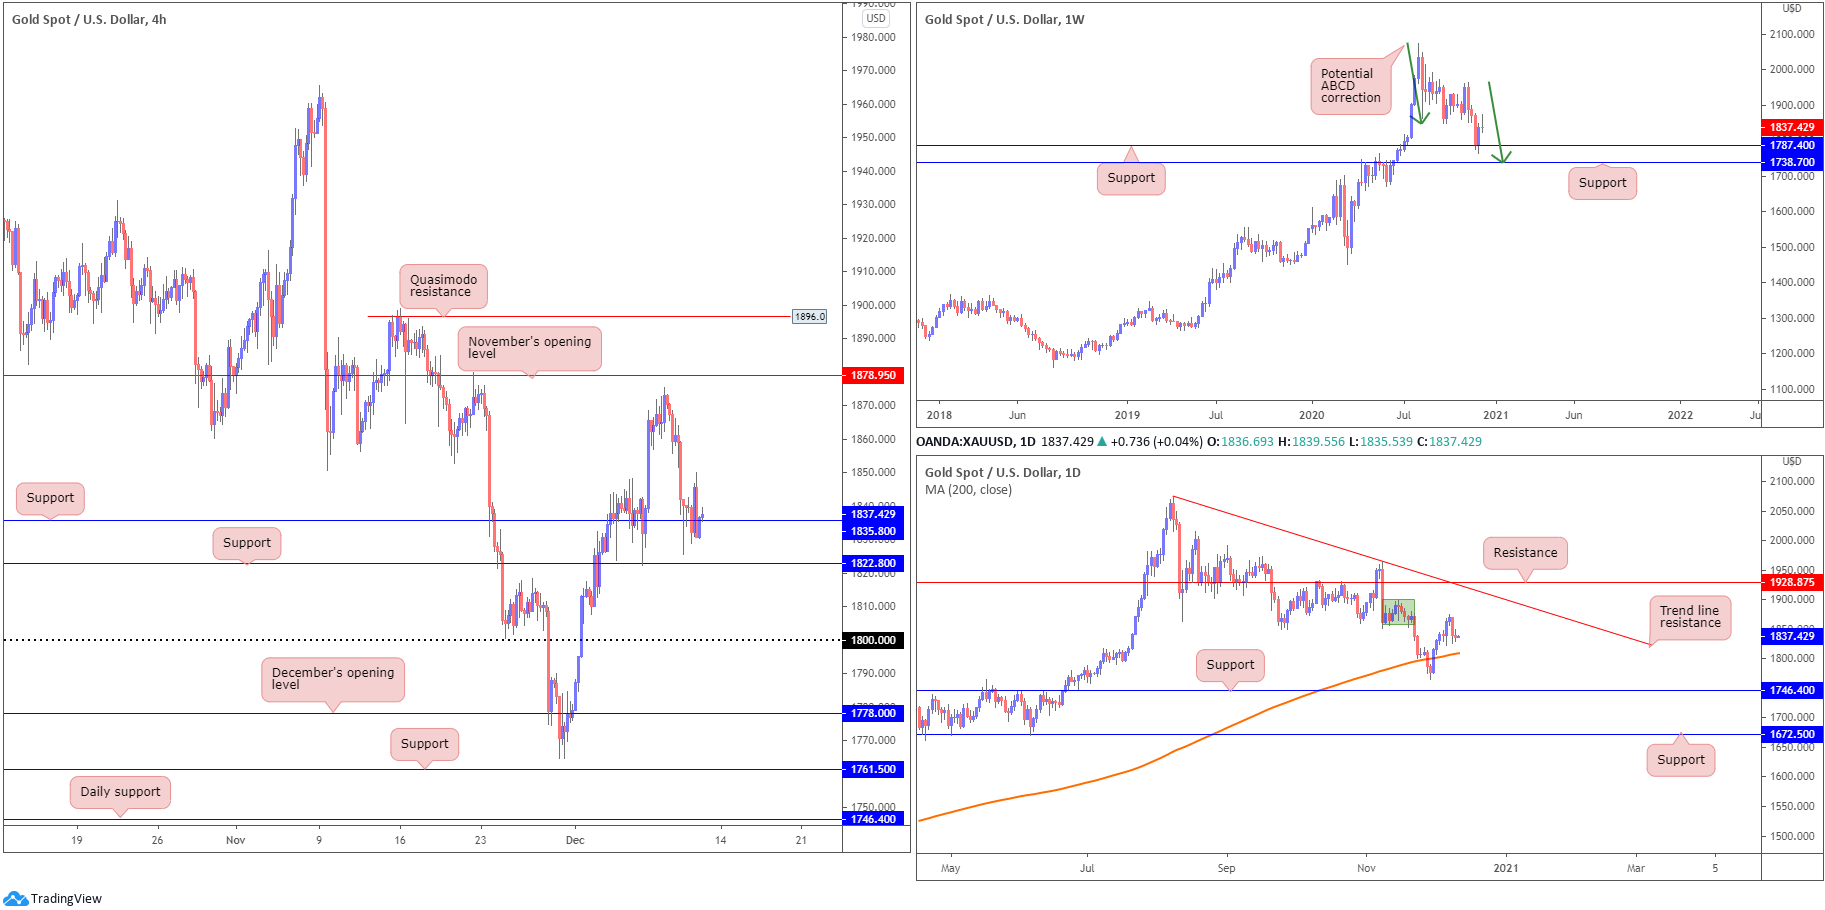
XAU/USD (GOLD):
The price of gold, in $ terms, spent Thursday’s session fluctuating around H4 support priced in at $1,835, fixed just north of H4 support at $1,822. Below, focus may shift to the $1,800 region, while journeying higher could challenge November’s opening value at $1,878.
From the weekly timeframe, despite Wednesday’s correction, price remains in a favourable position off support at $1,787 (sited ahead of another support at $1,738 and a potential ABCD correction [green arrows]). The fact the yellow metal has been decisively trending higher since the beginning of 2016 adds to the bullish narrative off $1,787.
Meanwhile, on the daily chart, supply around 1,878ish (green zone) held upside Wednesday. With this, the 200-day SMA (orange – $1,809) could be retested sometime today.
Areas of consideration:
In light of the lacklustre movement seen Thursday, the technical position remains unchanged.
- Buyers appear free to take things higher, according to the weekly trend and weekly support at $1,787.
- Retesting H4 support at $1,835 could still entice buyers towards November’s opening value at $1,878, though traders are urged to prepare for the possibility of a break to another nearby H4 support at $1,822.
- Below the aforementioned H4 supports, the 200-day SMA is seen as possible support, hovering ahead of $1,800.
The accuracy, completeness and timeliness of the information contained on this site cannot be guaranteed. IC Markets does not warranty, guarantee or make any representations, or assume any liability regarding financial results based on the use of the information in the site.
News, views, opinions, recommendations and other information obtained from sources outside of www.icmarkets.com.au, used in this site are believed to be reliable, but we cannot guarantee their accuracy or completeness. All such information is subject to change at any time without notice. IC Markets assumes no responsibility for the content of any linked site.
The fact that such links may exist does not indicate approval or endorsement of any material contained on any linked site. IC Markets is not liable for any harm caused by the transmission, through accessing the services or information on this site, of a computer virus, or other computer code or programming device that might be used to access, delete, damage, disable, disrupt or otherwise impede in any manner, the operation of the site or of any user’s software, hardware, data or property


