
Key risk events today:
Reserve Bank of Australia Cash Rate and Rate Statement.
EUR/USD:
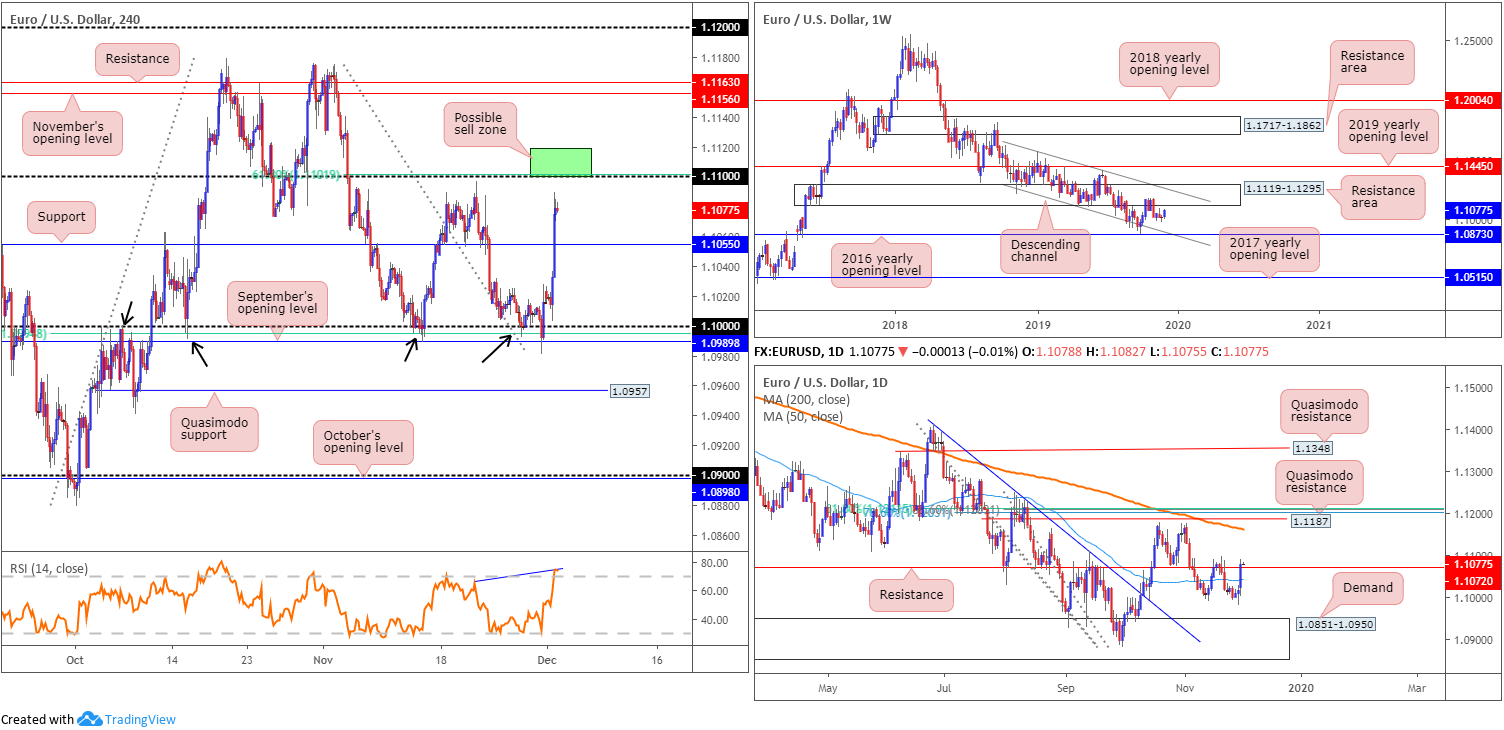
Europe’s single currency strongly advanced against its US counterpart Monday, adding more than 60 points, or 0.58%. The buck turned lower following US President Trump’s announcement of steel and aluminium tariffs on Brazil and Argentina. Dollar selling was exacerbated following poor ISM data, sending the US dollar index, or DXY, sub 98.00. According to the Institute for Supply Management, the November PMI registered 48.1 percent, a decrease of 0.2 percentage point from the October reading of 48.3 percent. The New Orders Index registered 47.2 percent, a decrease of 1.9 percentage points from the October reading of 49.1 percent. The Production Index registered 49.1 percent, up 2.9 percentage points compared to the October reading of 46.2 percent.
Leaving the top edge of 1.10 unchallenged by 3 points, EUR/USD bulls powered through H4 resistance at 1.1055 and scored highs of 1.1090 into the close. The 1.11 handle resides close by, set as the next possible ceiling in this market. Beyond here, scope to press as far north as 1.1163/1.1156 is visible (combination of resistance and November’s opening level). Indicator-based traders may also wish to note the relative strength index (RSI) on the H4 is seen producing hidden bearish divergence out of overbought territory (blue line).
The story on the wider picture has weekly trade poised to retest the underside of a long-standing resistance area at 1.1119-1.1295. Since the beginning of November 2018, the pair has also remained compressed within a descending channel, formed from a high set at 1.1569 and a low of 1.1109. Based on this scale, support is not expected to emerge until the lower boundary of the descending channel, which happens to merge closely with the 2016 yearly opening level at 1.0873. In addition to structure, the primary downtrend has been in motion since topping in early 2018 at 1.2555.
A closer reading of price action on the daily timeframe has price trading marginally north of a resistance level priced in at 1.1072, after overthrowing the 50-day SMA (blue – 1.1042). Continued bidding from this point could rally as far north as the 200-day SMA (orange – 1.1161).
Areas of consideration:
The area marked in green on the H4 timeframe between 1.1119 (the underside of the weekly resistance area) and the 1.11 handle represents a possible resistance zone, with H4 support at 1.1055 as the initial port of call. Fibonacci studies also show the 61.8% ratio converges closely with the round number 1.11 at 1.1102. The concern here is the recent break of daily resistance at 1.1072 potentially weakening sellers. For that reason, traders may want to consider waiting for additional H4 bearish candlestick confirmation to form before committing to 1.1119/1.11.
GBP/USD:
(Italics represent previous writing).
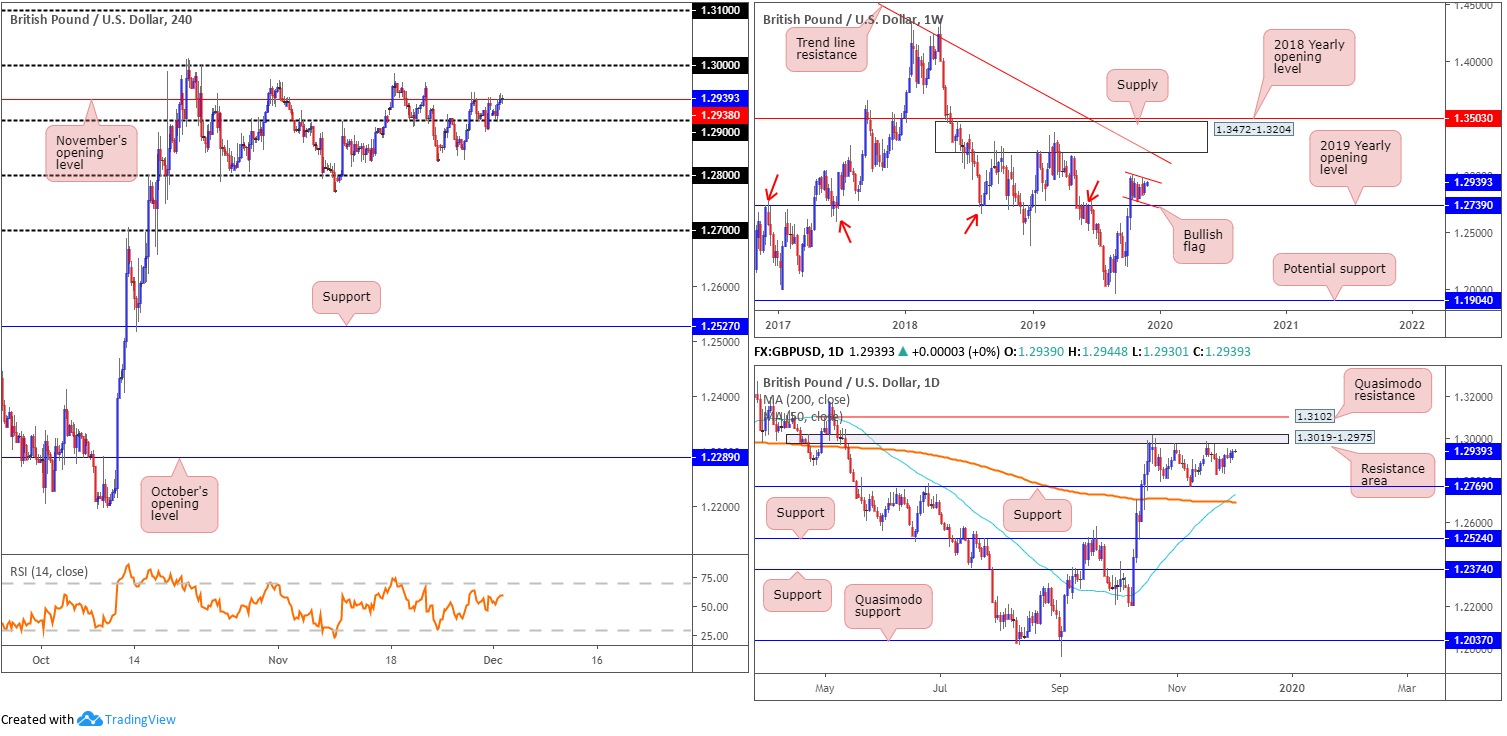
Sterling, a strong underperformer against the dollar, entered a somewhat subdued state Monday. Affected by weekend news suggesting the Conservative Party’s lead over the opposition Labour Party narrowed, GBP/USD technical action remained confined between the 1.29 handle on the H4 timeframe and November’s opening level at 1.2938.
The technical landscape on the weekly timeframe continues to support further upside in GBP/USD, exhibiting a bullish flag (typically considered a continuation pattern) forming just north of the 2019 yearly opening level 1.2739. A decisive push out of the said flagging formation may lead to the unit crossing swords with supply at 1.3472-1.3204, and long-term trend line resistance, etched from the high 1.5930. Regarding the immediate trend, the market faces a downward trajectory from 1.4376, with a break of the 1.1904 low (labelled potential support) confirming the larger downtrend from 1.7191.
Since mid-October, candle action on the daily timeframe has been carving out a consolidation between a resistance area plotted at 1.3019-1.2975 and a well-placed support level at 1.2769. Beyond this range, Quasimodo resistance lies at 1.3102, whereas south of 1.2769, the 200-day SMA (orange – 1.2697) and 50-day SMA (blue – 1.2715) offer support. In addition, the 50-day SMA is seen marginally crossing above the 200-day SMA, often referred to as a ‘Golden Cross’.
Areas of consideration:
Longer term, additional upside is likely in store. Bullish flags, particularly formed on higher timeframes, are known for accuracy. Clearance of the upper edge of the daily range at 1.3019 and Quasimodo resistance at 1.3102 adds confidence the current weekly bullish flag is likely to send price action higher.
Shorter term, nevertheless, entering long on the back of a H4 close formed above 1.2938 is certainly an idea worth exploring, with an initial upside objective set at 1.2975 (the lower edge of the current daily resistance area), followed by 1.30. Conservative traders may opt to wait for a retest at 1.2938 following the close higher; this helps avoid any whipsaws and, if the retest forms by way of a bullish candlestick pattern, provides entry/risk levels to work with.
AUD/USD:
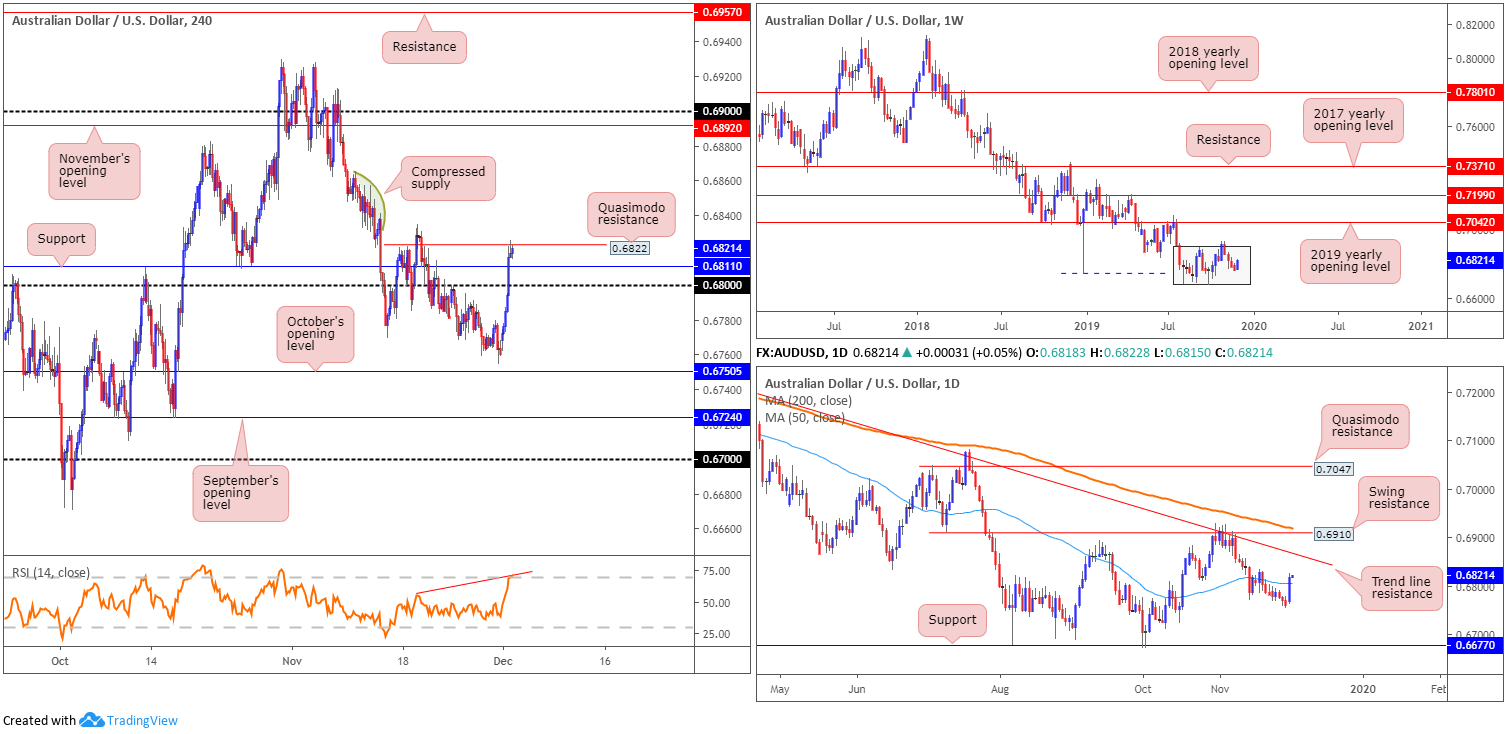
Largely benefiting from a declining buck, AUD/USD kicked off the week carving out a healthy run to the upside, adding more than 55 points, or 0.86%.
Recent upside witnessed H4 price kick above orders through the 0.68 handle and resistance coming in at 0.6811, with the unit concluding the day shaking hands with Quasimodo resistance at 0.6822. Above this barrier, compressed supply is evident between 0.6840/60 (green arc), with November’s opening level representing the next logical resistance on the H4 scale at 0.6892. Therefore, longs north of 0.6822 could be an option today. In terms of the relative strength index (RSI), the indicator is seen producing bearish hidden divergence out of overbought territory.
With respect to the weekly timeframe, the unit remains within the walls of its current range between 0.6894/0.6677 (light grey). The primary downtrend, visible from this timeframe, has been in play since early 2018. Daily activity, on the other hand, crossed above the 50-day SMA (blue – 0.6806), potentially setting the stage for a possible approach towards trend line resistance, extended from the high 0.7393.
Areas of consideration:
In the event we push for higher ground today, breaking through the H4 Quasimodo resistance at 0.6822, longs could be the order of the day, targeting the current daily trend line resistance, followed by November’s opening level at 0.6892. A retest at 0.6822 following a break higher, preferably in the shape of a H4 bullish candlestick signal, offers an ideal entry.
Selling from 0.6822, despite boasting RSI confirmation, is problematic, given nearby H4 supports and possible support emerging off the 50-day SMA.
USD/JPY:
(Italics represent previous writing).
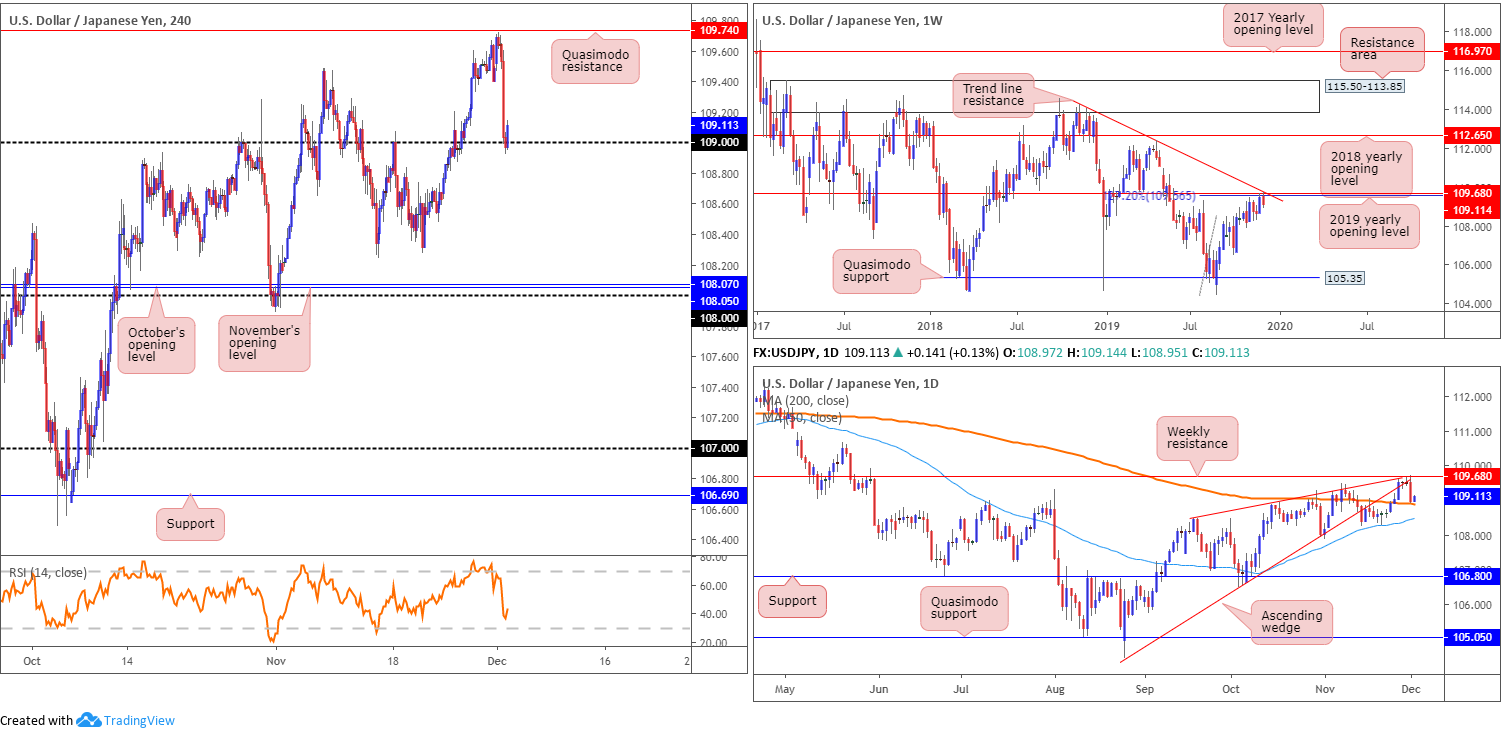
The Japanese yen was among the top outperformers Monday, bolstered by risk aversion. The buck turned lower following US President Trump’s announcement of steel and aluminium tariffs on Brazil and Argentina. Dollar selling was exacerbated following poor ISM data, sending the US dollar index, or DXY, sub 98.00.
Technically speaking, however, USD/JPY, as highlighted in previous analysis, was ripe for a selloff:
Structurally, weekly resistance is now in play, based on a 127.2% Fibonacci ext. point at 109.56 (taken from the low 104.44). Plotted close by is another layer of resistance formed at 109.68, the 2019 yearly opening level. Also sited nearby is trend line resistance, extended from the high 114.23. In regards to the market’s primary trend, the pair has been entrenched within a range since March 2017, spanning 115.50/105.35.
In conjunction with weekly standing, price action on the daily timeframe is touching gloves with a ‘cradle point’ of a recently broken ascending wedge, formed from the low 104.44. This is likely viewed as a critical threshold, which given its alignment with weekly resistance, could entice strong selling this week. The next downside target on this scale can be found at the 200-day SMA (orange – 108.91).
According to longer-term structure, this could be an ideal time to begin thinking about selling this market, with protective stop-loss orders positioned above weekly trend line resistance (114.23). As for take-profit targets, the 200-day SMA plotted on the daily timeframe offers a logical base for an initial target.
Areas of consideration:
As is evident from the charts this morning. The point between the weekly trend line and associated resistances, along with the underside of the daily wedge, held price action strongly lower yesterday. Well done to any readers who managed to jump aboard this move. With H4 action finding support off 109, traders may look to reduce risk to breakeven and liquidate a portion of their position. Further selling is certainly possible this week, though only after an engulf of the 200-day SMA mentioned above.
H4 action missed Quasimodo resistance by a hair at 109.74, before turning lower and reaching the 109 handle. This was a noted level for traders requiring more of a precise entry.
USD/CAD:
(Italics represent previous writing).
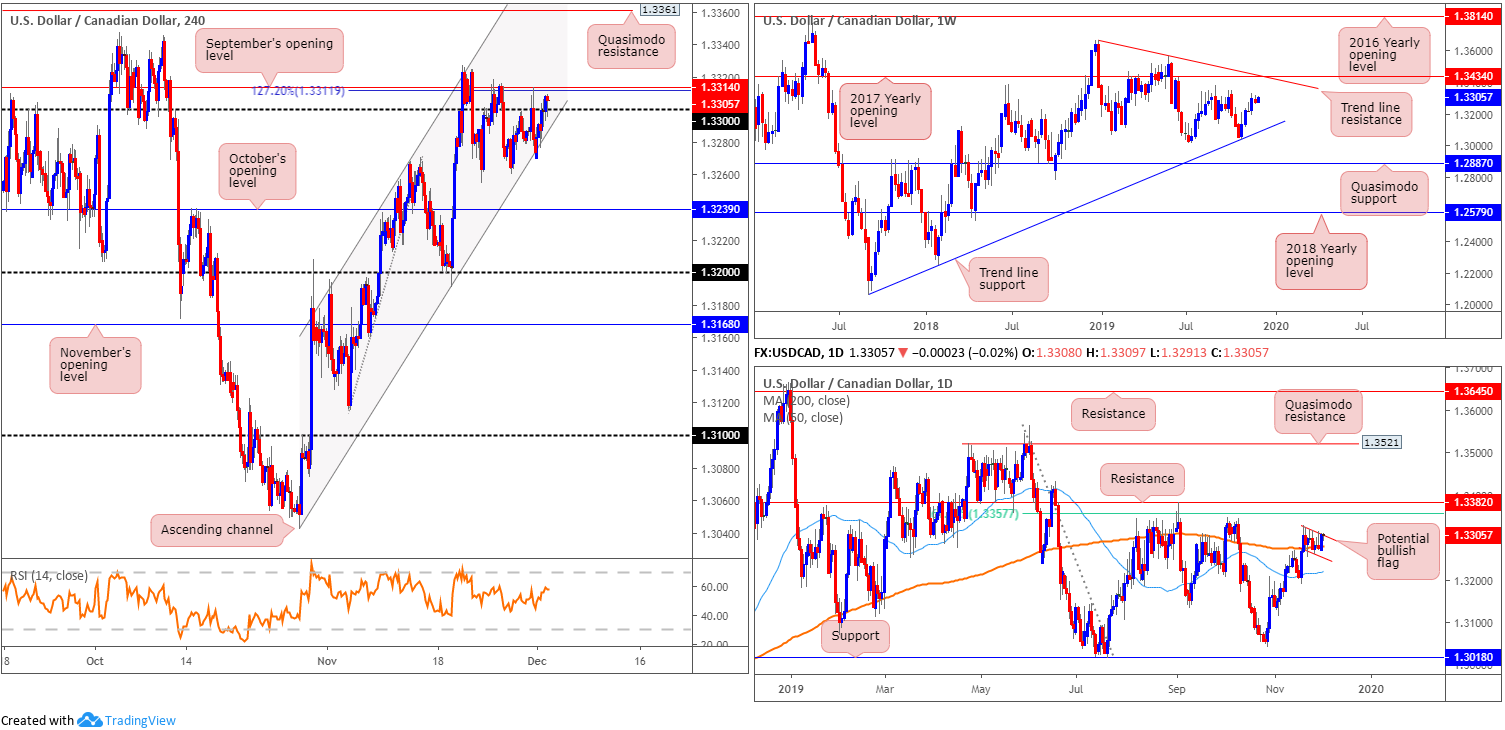
The technical picture on USD/CAD has H4 price trading marginally above the 1.33 handle, though immediate resistance remains present at September’s opening level drawn from 1.3314, and a 127.2% Fibonacci ext. point at 1.3311. Medium-term flow also remains compressing within the confines of an ascending channel, taken from the low/high of 1.3042/1.3268. Beyond 1.3314, Quasimodo resistance rests at 1.3361.
The key observation on the weekly timeframe consists of a trend line support, extended from the low 1.2061, tops around 1.3342, the 2017 yearly opening level at 1.3434 and a trend line resistance, taken from the peak at 1.3661. Overall, the immediate trend faces north since bottoming in September 2017, though this move could also be considered a deep pullback in a larger downtrend from the 1.4689 peak in early January 2016.
Action on the daily timeframe remains encased within a bullish flag pattern (red lines), following price breaking above the 200-day SMA (orange – 1.3277). A breakout above the said bull flag has the 61.8% Fibonacci retracement ratio at 1.3357 to target, as well as nearby resistance plotted at 1.3382. Flag failure, on the other hand, could draw in a retest at the 50-day SMA (blue – 1.3216).
Areas of consideration:
Entering long at the current H4 channel support was an option highlighted in Monday’s technical briefing. Traders likely entered long from here off the H4 bullish outside candle formation. Well done to any readers who managed to enter long on the back of this formation.
A decisive H4 close above 1.3314 may be of interest to some traders today, opening the possibility for intraday longs towards 1.3361.
The H4 Quasimodo resistance at 1.3361 is also likely of interest to many traders for potential shorts, knowing it fits between daily resistance at 1.3382 and the 61.8% Fibonacci retracement ratio at 1.3357.
USD/CHF:
The Swiss franc soared Monday amid risk aversion, with USD/CHF suffering its worst slide in three months, erasing more than 83 points, or 0.84%.
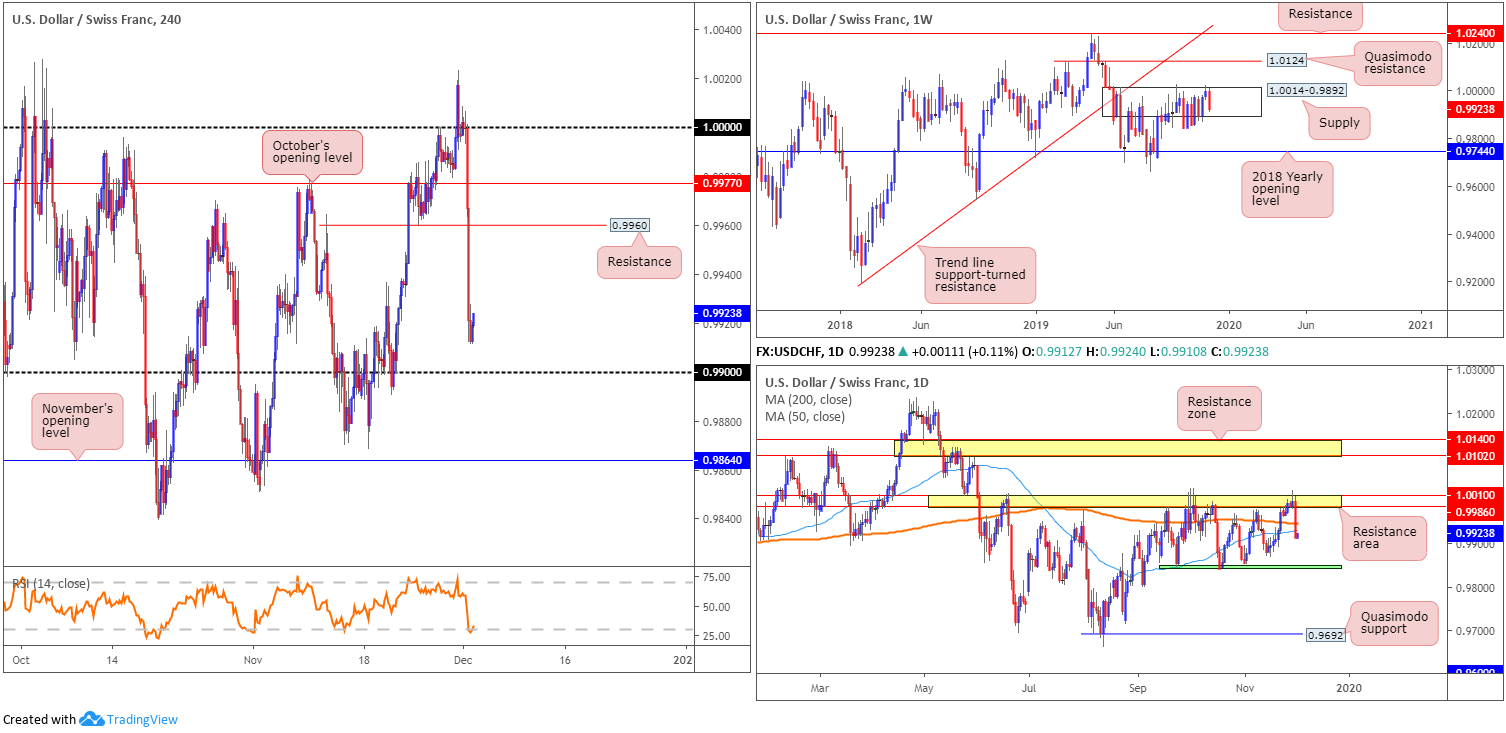
Technical research based on the weekly timeframe shows the pair remains consolidating within the walls of a supply zone at 1.0014-0.9892, despite whipsawing through the top edge of the said zone on two occasions. A move higher from here has Quasimodo resistance at 1.0124 in sight, followed by resistance at 1.0240 and trend line support-turned resistance, extended from the low 0.9187. To the downside, nevertheless, the 2018 yearly opening level awaits at 0.9744.
Meanwhile, on the daily timeframe, last week concluded by way of a shooting star pattern (considered a bearish signal) that pierced a resistance area coming in at 1.0010/0.9986. Since mid-September, the unit has been busy carving out a consolidation between support around the 0.9845ish region (green) and the said resistance area. Yesterday, in one fell swoop, witnessed price drive lower and engulf both the 200/50-day SMAs (0.9946/0.9930).
In the early hours of London Monday, price action retested the underside of 1.0000 (parity) on the H4 timeframe and strongly rotated lower. Tunnelling through October’s opening level at 0.9977 and support at 0.9960, the unit wrapped up the session bottoming just north of the 0.99 handle. Also of note is the relative strength index (RSI) seen testing oversold territory.
Areas of consideration:
A retest between 0.9946/0.9930 today (the two SMAs highlighted above) is certainly an area technicians have an eye on. A retest of this zone, formed in the shape of a H4 bearish candlestick formation (entry and risk can be set according to this pattern) could prompt selling towards 0.99, followed by the lower edge of the daily range at 0.9845.
Dow Jones Industrial Average:
US equities declined Monday, hit by a downbeat report on the manufacturing sector and a fresh flare-up in trade tensions. The Dow Jones Industrial Average erased 268.37 points, or 0.96%; the S&P 500 lost 27.11 points, or 0.86% and the tech-heavy Nasdaq 100 declined 94.42 points, or 1.12%.
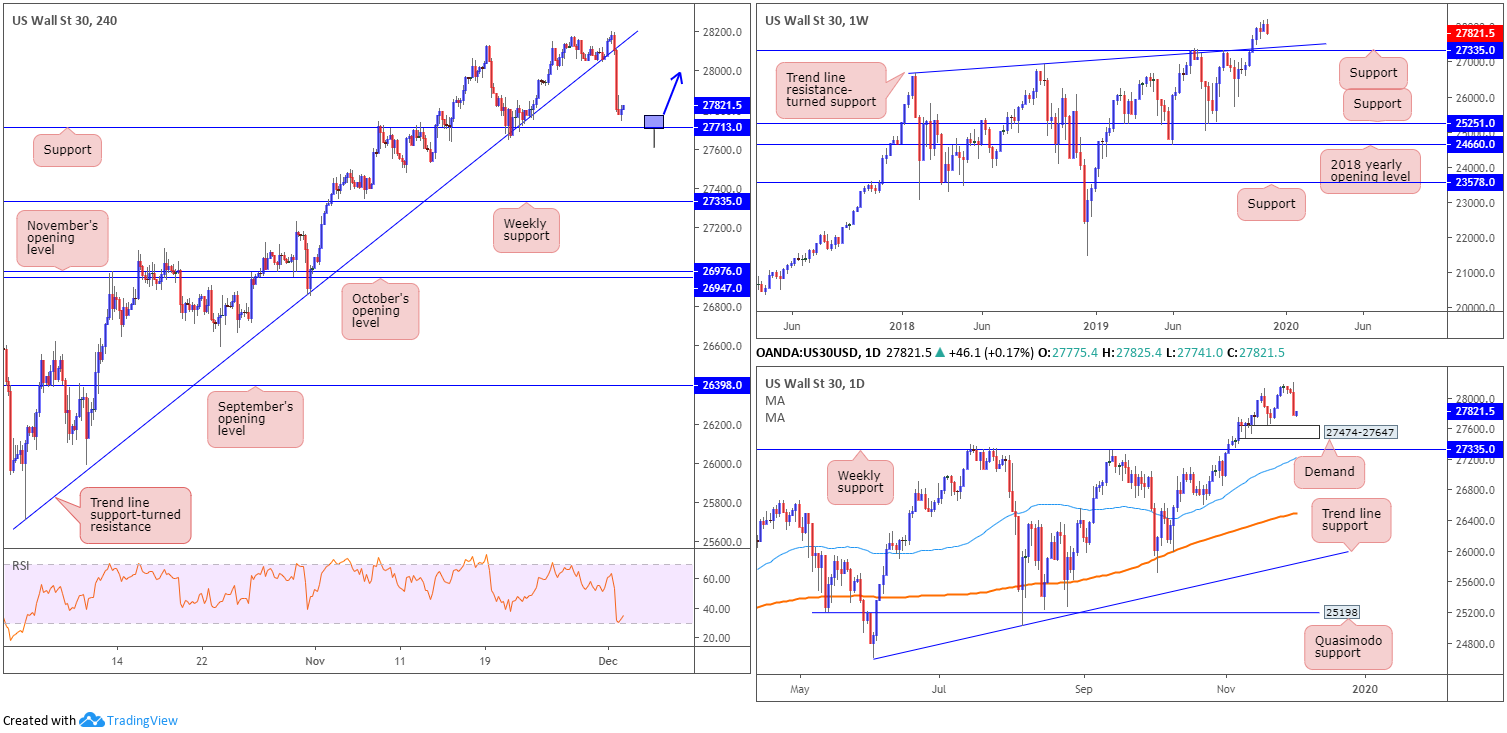
From a technical standpoint, H4 flow engulfed trend line support, extended from the low 25710, and is, as of current price, poised to approach support pencilled in at 27713. In addition, the relative strength index (RSI) is seen bottoming just ahead of oversold terrain.
Higher-timeframe action positions daily price just ahead of demand plotted at 27474-27647, thanks to yesterday’s descent, sited just north of weekly support at 27335. Note we also have a weekly trend line resistance-turned support (26670) converging closely with this level.
Areas of consideration:
Testing the H4 support at 27713 is a possibility today. Traders considering longs based off this platform are urged to consider waiting for additional H4 candlestick confirmation before pulling the trigger. This is due to daily price displaying scope to test demand, sited lower on the curve, and weekly price also showing room to explore lower ground.
An ideal scenario would be for H4 price to chalk up a H4 bullish hammer candlestick formation through H4 support into daily demand (see chart for a visual representation).
XAU/USD (GOLD):
(Italics represent previous writing).
Gold prices ended Monday unchanged, despite scoring a session low of 1454.0. As such, much of the following piece will echo points put forward in Monday’s technical briefing.
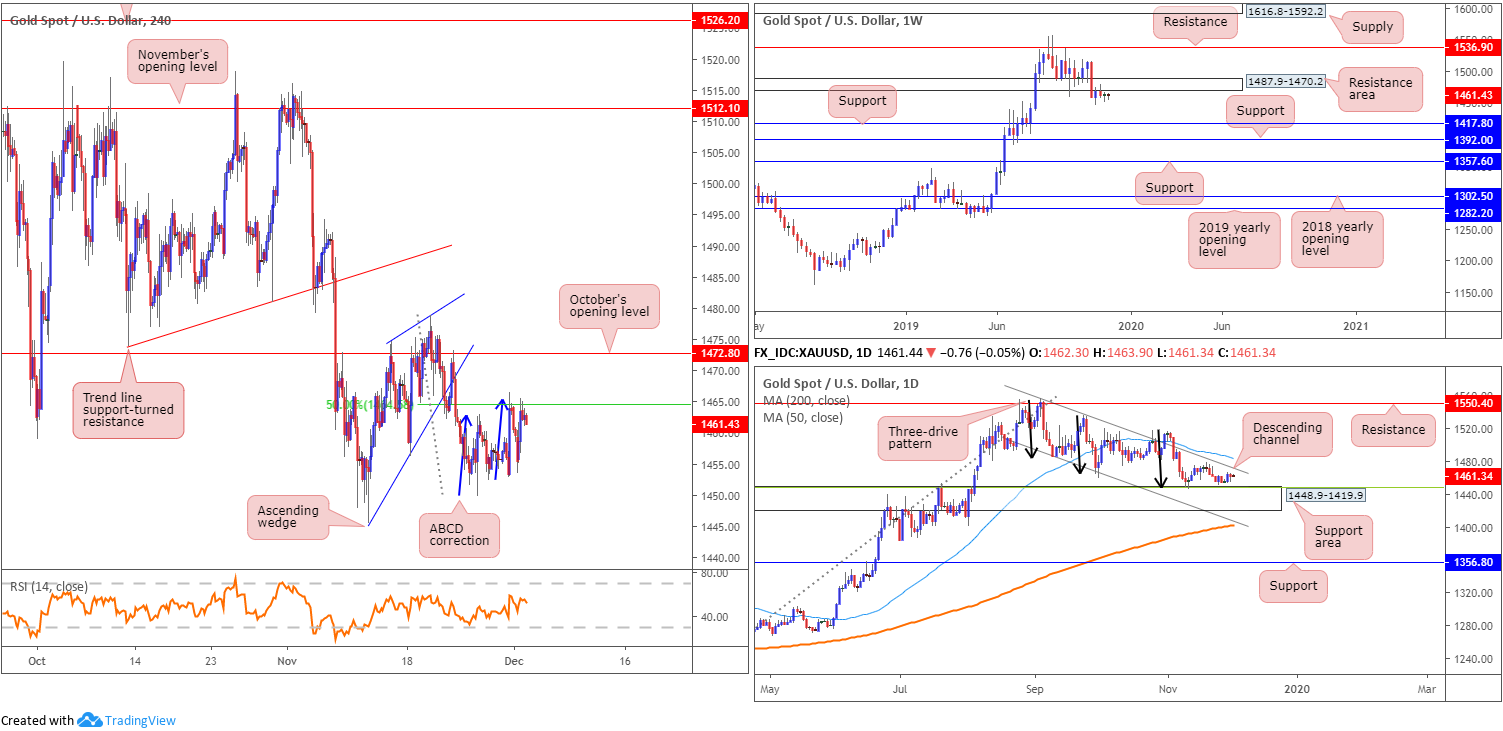
From the weekly timeframe, we can see candle action maintains a position south of a notable resistance area at 1487.9-1470.2. Further rejection potentially sets the long-term stage for a move towards two layers of support at 1392.0 and 1417.8.
With respect to daily activity, action remains hovering north of a support area coming in at 1448.9-1419.9. Note this area aligns closely with a 38.2% Fibonacci retracement ratio at 1448.5 and is further bolstered by the completion of a three-drive pattern – black arrows. Upside from this area, nonetheless, is limited by a channel resistance, pencilled in from the high 1557.1, closely shadowed by the 50-day SMA (blue – 1485.6).
The recent formation of a H4 ABCD bearish correction (blue arrows) at 1465.5, which converges with a 50.0% retracement at 1464.5, held ground Monday. The initial reaction sent the unit to lows of 1454.0, though the day ended back at the ABCD sell level. As of current price, the H4 candles continue to hold this level. Failure of this pattern, however, will likely lead to a retest at October’s opening level at 1472.8.
Areas of consideration:
Attempting to sell the current H4 ABCD formation a second time is considered a chancy move. October’s opening level at 1472.0 is the more appealing it seems. This level also boasts a strong connection to the noted daily resistances, while also positioned within the lower limits of the weekly resistance area at 1487.9-1470.2.
Should the analysis prove accurate and we indeed test 1472.0 today, waiting for additional candlestick confirmation to form is certainly worthy of consideration. Not only will it help identify seller intent, it will provide traders entry and risk levels to work with.
The accuracy, completeness and timeliness of the information contained on this site cannot be guaranteed. IC Markets does not warranty, guarantee or make any representations, or assume any liability regarding financial results based on the use of the information in the site.
News, views, opinions, recommendations and other information obtained from sources outside of www.icmarkets.com.au, used in this site are believed to be reliable, but we cannot guarantee their accuracy or completeness. All such information is subject to change at any time without notice. IC Markets assumes no responsibility for the content of any linked site.
The fact that such links may exist does not indicate approval or endorsement of any material contained on any linked site. IC Markets is not liable for any harm caused by the transmission, through accessing the services or information on this site, of a computer virus, or other computer code or programming device that might be used to access, delete, damage, disable, disrupt or otherwise impede in any manner, the operation of the site or of any user’s software, hardware, data or property.


