
EUR/USD:
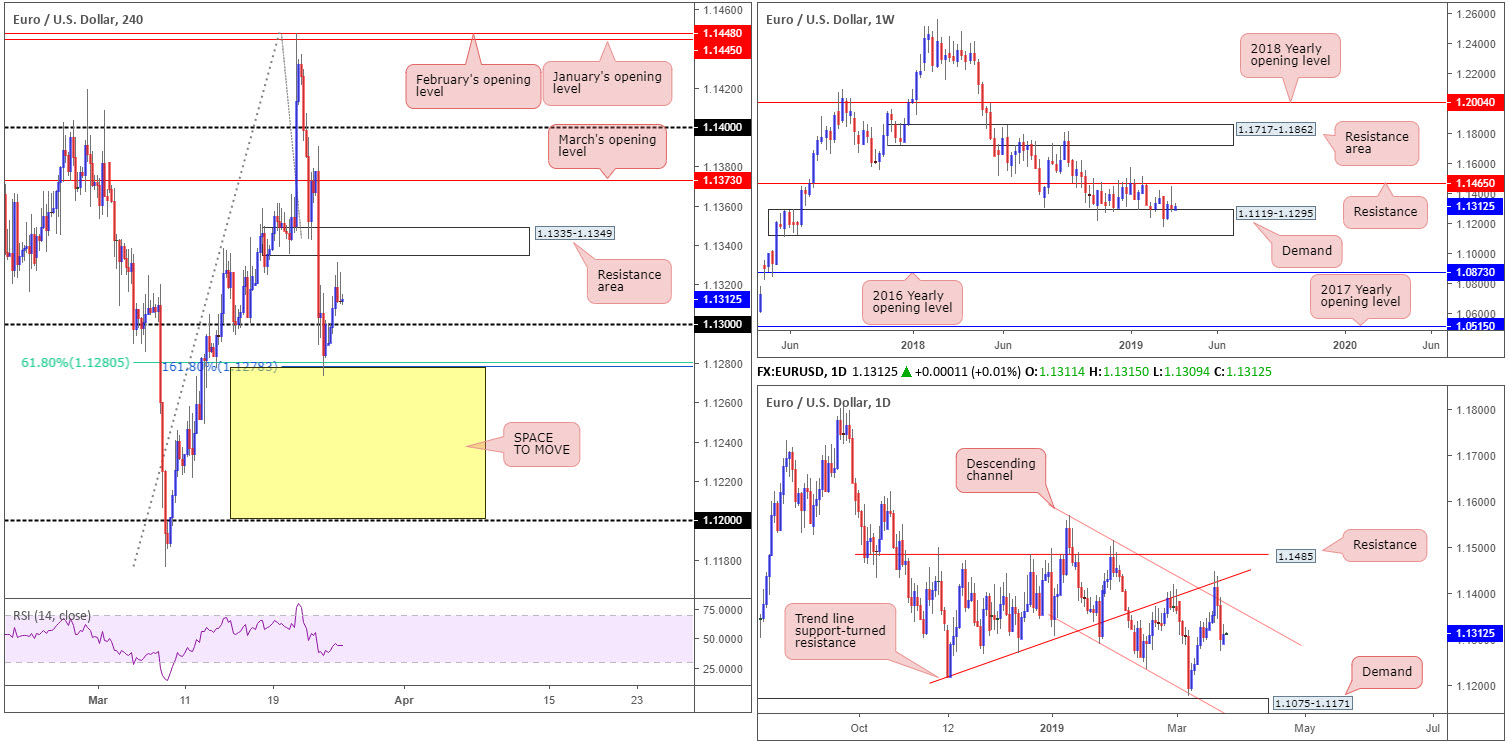
Sentiment among German business leaders improved as the IFO Business Climate Index rose in March from 98.7 (seasonally adjusted) to 99.6 points. This is the first increase following six declines in succession, providing fresh impetus to the EUR/USD market early trading Monday. This – coupled with a USD decline – led to the H4 candles swallowing 1.13 to the upside and testing highs seen a few points south of a resistance area coming in at 1.1335-1.1349. This came about following Friday’s response off support by way of a 61.8% Fibonacci level at 1.1280 and a 161.8% Fibonacci extension point at 1.1278.
Structure on the bigger picture remains unchanged. Although braced by weekly demand at 1.1119-1.1295, the unit failed to shake hands with nearby weekly resistance at 1.1465 last week and concluded in the shape of a bearish pin-bar formation. Overall, the long-term trend on the weekly timeframe continues to face a southerly direction. The next area of interest beyond the current demand falls in around the 2016 yearly opening level priced in at 1.0873.
The story on the daily timeframe shows the pair trading back within the limits of its descending channel (high: 1.1569 low: 1.1289) after recently attempting a run through the upper limit of this formation last week, reaching highs at 1.1448.
Areas of consideration:
A break above 1.13, as highlighted above, has a H4 resistance area at 1.1335-1.1349 in sight, which may hold should it be tested today. The more attractive area for sellers, however, is likely above here around March’s opening level at 1.1373, as it fuses closely with the current daily channel resistance.
The space beneath 1.1280/1.1278 (yellow) also remains appealing this week for shorts. To the left, limited demand is visible, with the next port of interest falling in around 1.12, parked less than 30 points above the top edge of daily demand at 1.1171 (situated within the current daily descending channel). Should we push through 1.1280/1.1278 this week and retest the area as resistance, a sell (using the rejecting candlestick’s structure to base entry and risk levels) could be an option. The only grumble is weekly demand mentioned above at 1.1119-1.1295, despite the timeframe recently printing a bearish pin-bar foundation.
Today’s data points: FOMC Member Evans Speaks; US Building Permits; US CB Consumer Confidence.
GBP/USD:
UK Prime Minister Theresa May addressed Parliament today and told MPs there is still not sufficient support to bring back her Brexit deal negotiated with the EU, though the Prime Minister said she would continue her efforts to build support for the deal.
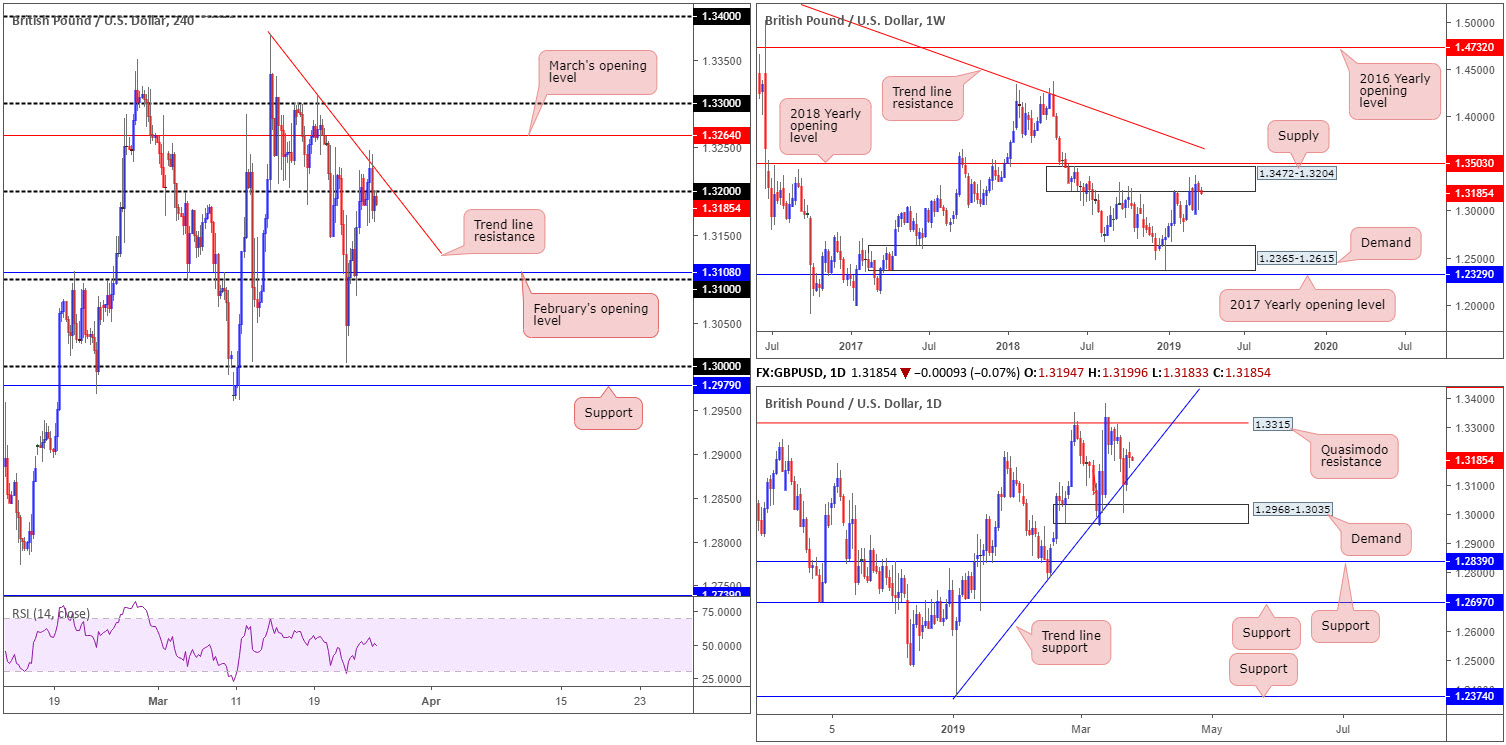
Sterling ended Monday registering modest losses vs. the US dollar, posting up sub 1.32 on the H4 timeframe after tagging in nearby trend line resistance (taken from the high 1.3379). Continued selling from this point has February’s opening level at 1.3108 in range, followed closely by 1.31.
Decorating the weekly chart is supply drawn from 1.3472-1.3204. Since the end of February this has been home to many traders as price flipped between gains/losses. In view of the number of times this area has been tested since July 2018, the supply’s foundation is likely weakened, giving rise to a possible advance towards the 2018 yearly opening level at 1.3503.
The stop run through trend line support (extended from the low 1.2373) on the daily timeframe into nearby demand plotted at 1.2968-1.3035 last week provoked a round of buying Friday. Price has thus far managed to print anything meaningful to the upside, though should a favourable bullish wind materialise, Quasimodo resistance at 1.3315 is next in line. Beyond 1.3315, resistance at 1.3465 will likely be drawn back into the spotlight (not seen on the screen).
Areas of consideration:
According to our studies, sellers have the upper hand on both the weekly and H4 timeframes this morning. Daily buyers, nevertheless, could still potentially be active around its current trend line support. As you can see, technical elements remain mixed.
Unless you’re comfortable shorting below 1.32, knowing daily buyers could enter the mix, the research team’s outlook for this market, is flat. With uncertainty stemming from Brexit as well as the technicals printing a mixed tone, this is possibly a market best left on the back burner today.
Today’s data points: MPC Member Broadbent Speaks; FOMC Member Evans Speaks; US Building Permits; US CB Consumer Confidence.
AUD/USD:
The Australian dollar hinted at a possible risk-on scenario Monday, as the US dollar explored lower ground. Despite this, US equities, although marginally higher on the day (DJIA), entered a choppy state.
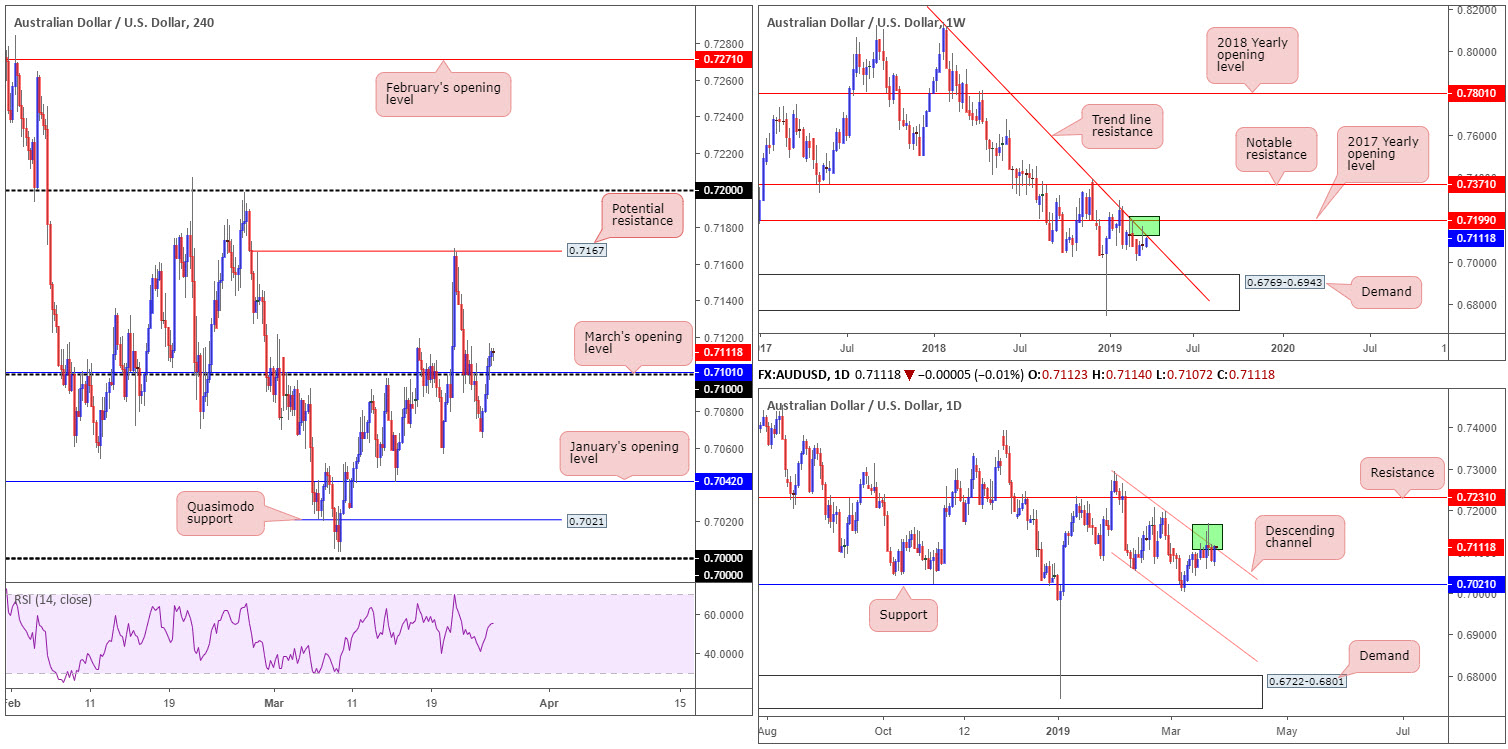
Over on the technical side of things, the H4 chart reveals the unit climbed above 0.71 in recent movement, clocking highs at 0.7116. Reclaiming all of Friday’s losses, the move back above 0.71 has potentially set the stage for a run towards resistance at 0.7167.
Things are not quite so rosy on the bigger picture, however. Weekly flow is situated around a long-standing trend line resistance (etched from the high 0.8135). The market could observe additional selling take shape from here as downside appears reasonably free until connecting with demand pencilled in at 0.6769-0.6943.
Daily activity continues to compress within a descending channel (high: 0.7295 low: 0.7060), with the market drawing in the upper limit of this formation last week and again on Monday. This places the spotlight on a possible move to nearby support at 0.7021 this week.
Areas of consideration:
Despite higher-timeframe technicals suggesting the sellers remain in the driving seat, selling into the 0.71 handle on the H4 timeframe is chancy. The more conservative route, according to our reading, is to wait and see if the H4 candles post a close back beneath 0.71. This, followed up with a retest in the shape of a H4 bearish candlestick formation (entry/risk levels can be determined according to this structure) would likely be sufficient enough to draw in sellers in the direction of yesterday’s low 0.7065, followed by January’s opening level at 0.7042.
Today’s data points: FOMC Member Evans Speaks; US Building Permits; US CB Consumer Confidence.
USD/JPY:
In line with US equities, the Dow Jones Industrial Average, the USD/JPY witnessed lacklustre movement in recent sessions, wrapping up Monday +0.06% and ranging only 54 points.
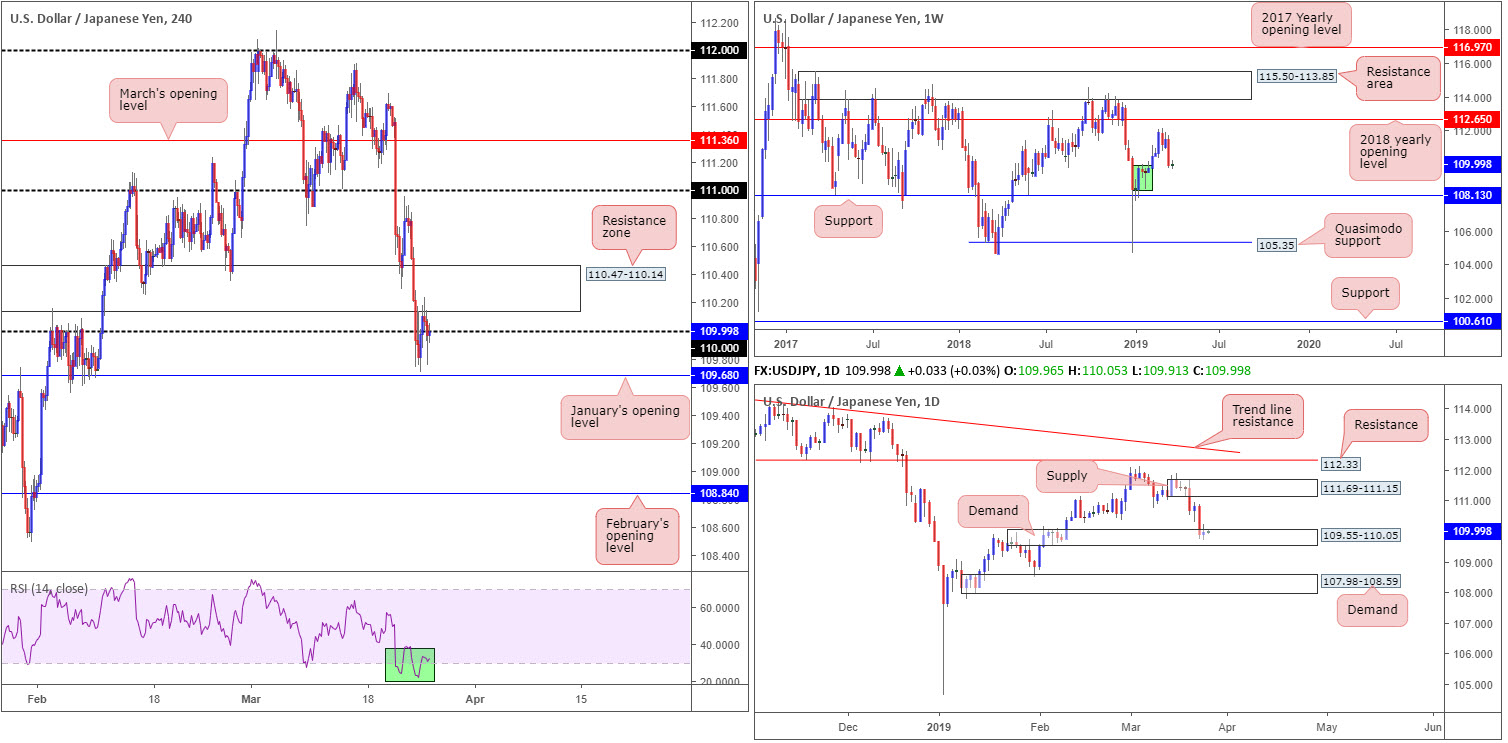
Technically, H4 price is capped around the underside of a resistance zone coming in at 110.47-110.14, which, as you can see, has round number support nearby at 110 as well as January’s opening level at 109.68 (another potential support). It is also worth pointing out the RSI indicator is visibly attempting to recover from oversold territory (green).
Technical action on the weekly timeframe concluded last week’s session in the shape of a near-full-bodied bearish candle. Although a response from nearby demand marked in green at 108.49/109.74 could be seen this week, support at 108.13 is the more appealing level for buyers on this timeframe. By and of itself, the aforesaid demand area achieved very little in terms of breaking anything significant to the left.
A closer reading on the daily timeframe exposes demand at 109.55-110.05. Formed on the break of the 109.95 Jan 25 high, the area is fresh and currently holding price action higher, albeit by way of a fragile indecision candle. A push higher from here could bring in supply at 111.69-111.15, whereas a move lower has demand at 107.98-108.59 on the hit list.
Areas of consideration:
Although potentially contained by minor weekly demand at 108.49/109.74, a decisive H4 close beyond 109.68 is certainly a move worth keeping an eye out for. Not only would it clear downside towards February’s opening level at 108.84 and suggest weakness within the current daily demand area, it opens up the possibility for a retest (sell) play at the underside of 109.68 (black arrows).
Buying, according to our technical reading, is possible once/if we reclaim position back above the H4 resistance area at 110.47-110.14, unlocking space to connect with the 111 handle on the H4 timeframe, followed by the underside of daily supply at 111.15.
Today’s data points: FOMC Member Evans Speaks; US Building Permits; US CB Consumer Confidence.
USD/CAD:
Despite clocking a fresh high at 1.3444, the US dollar ceded ground to its Canadian counterpart Monday. The US dollar index reported marginal losses, WTI turned positive on the day and the US Treasury 10-year yield note crossed below 2.4%.
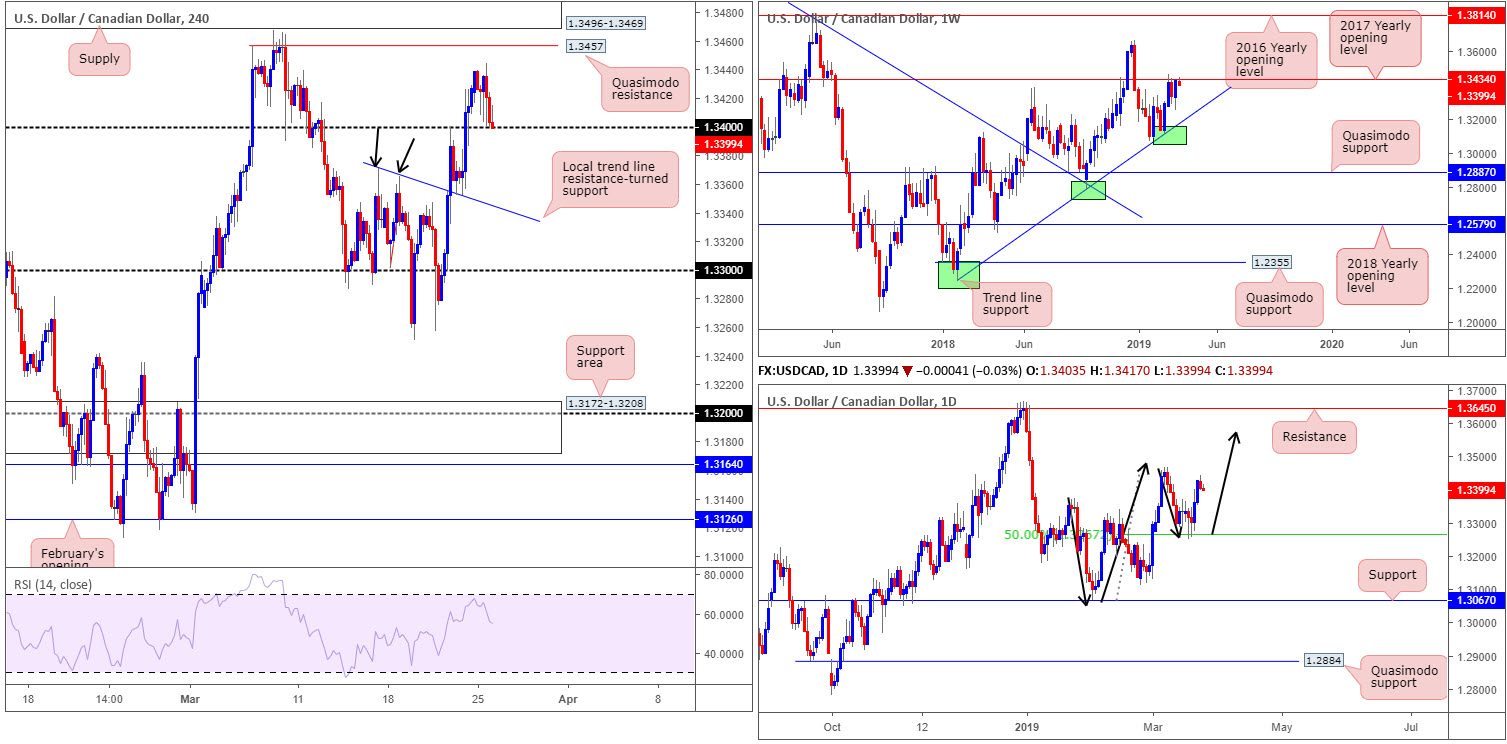
As of writing, the H4 candles are seen nursing losses around the psychological mark 1.34. A rejection off this level today has yesterday’s said high to target (1.3444), shadowed by Quasimodo resistance at 1.3457 and then supply at 1.3496-1.3469. A break beneath 1.34, however, could lead to a move towards local trend line resistance-turned support (etched from the high 1.3371).
In recent weeks, the USD/CAD has been engaging with notable resistance at 1.3434 (the 2017 yearly opening level) following an impressive rally from trend line support (taken from the low 1.2247). Should price action run through 1.3434 this week, keep tabs on the 1.3664 Dec 31 high, followed reasonably closely by the 2016 yearly opening level at 1.3814.
On the other side of the spectrum, daily action indicates it may be poised to approach higher ground this week. The higher high sported on March 7th at 1.3467 followed by a 50.0% retracement to 1.3265 which held firm, places the buyers in good stead to overthrow the said high and discover higher levels.
Areas of consideration:
Although 1.34 likely contains buyer interest, the threat of a push lower from weekly resistance (1.3434) may be too much for buyers here.
Should our weekly analysis be correct and the market does indeed push lower, a H4 close back beneath 1.34 may be of interest to some of our traders. A retest to the underside of this barrier (preferably in the shape of a H4 bearish candlestick signal as this provides entry/risk levels to work with) opens up a possible intraday sell (black arrows) back to the local trend line resistance-turned support highlighted above.
Today’s data points: FOMC Member Evans Speaks; US Building Permits; US CB Consumer Confidence.
USD/CHF:
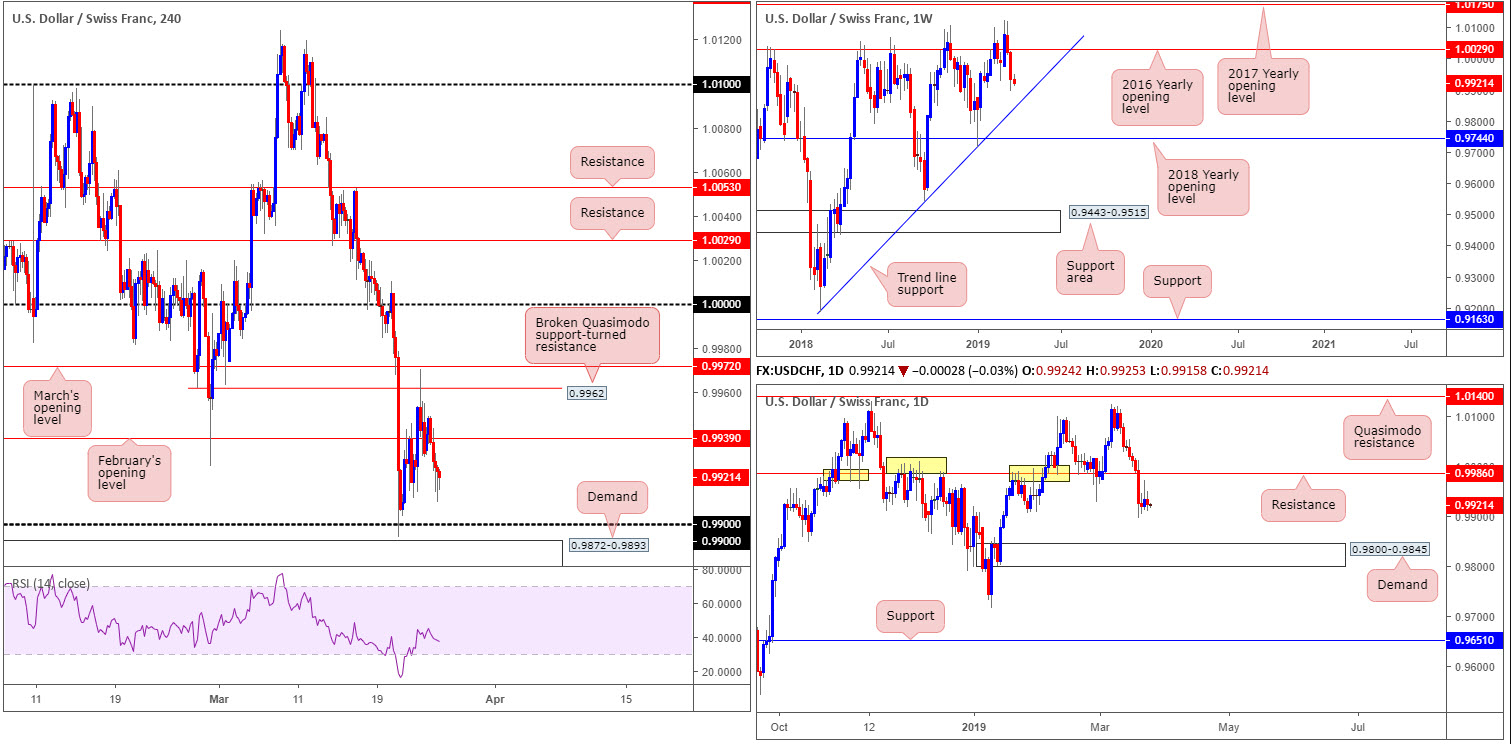
Down 0.08% on the day, Monday’s sessions offered a subdued tone to kick off the week. Having seen the US dollar index and US Treasury yields draw lower, the USD/CHF limited itself beneath February’s opening level at 0.9939 on the H4 timeframe. 0.99 psychological support is seen nearby, as is demand coming in at 0.9872-0.9893.
In terms of where the market stands on the weekly timeframe this morning, price action is poised to approach trend line support (taken from the low 0.9187) after having seen the unit push lower from the 2016 yearly opening level at 1.0029. Daily flow, aside from the 0.9905 Jan 28 low that’s holding as temporary support, also demonstrates potential to charge as far south as demand plotted at 0.9800-0.9845.
Areas of consideration:
Both weekly and daily timeframes suggest a possible move lower this week, therefore should the H4 candles remain defensive below February’s opening level at 0.9939 on the H4 timeframe, an intraday short position could be in the offing to 0.99ish. Rather than selling current price, though, traders are urged to wait and see if the unit retests February’s opening level as resistance. This way, the option to wait for additional candlestick confirmation is there (entry/risk levels can be determined according to the candlestick pattern), and risk/reward will improve exponentially towards 0.99: the first port of call for take-profit targets.
Today’s data points: FOMC Member Evans Speaks; US Building Permits; US CB Consumer Confidence.
Dow Jones Industrial Average:
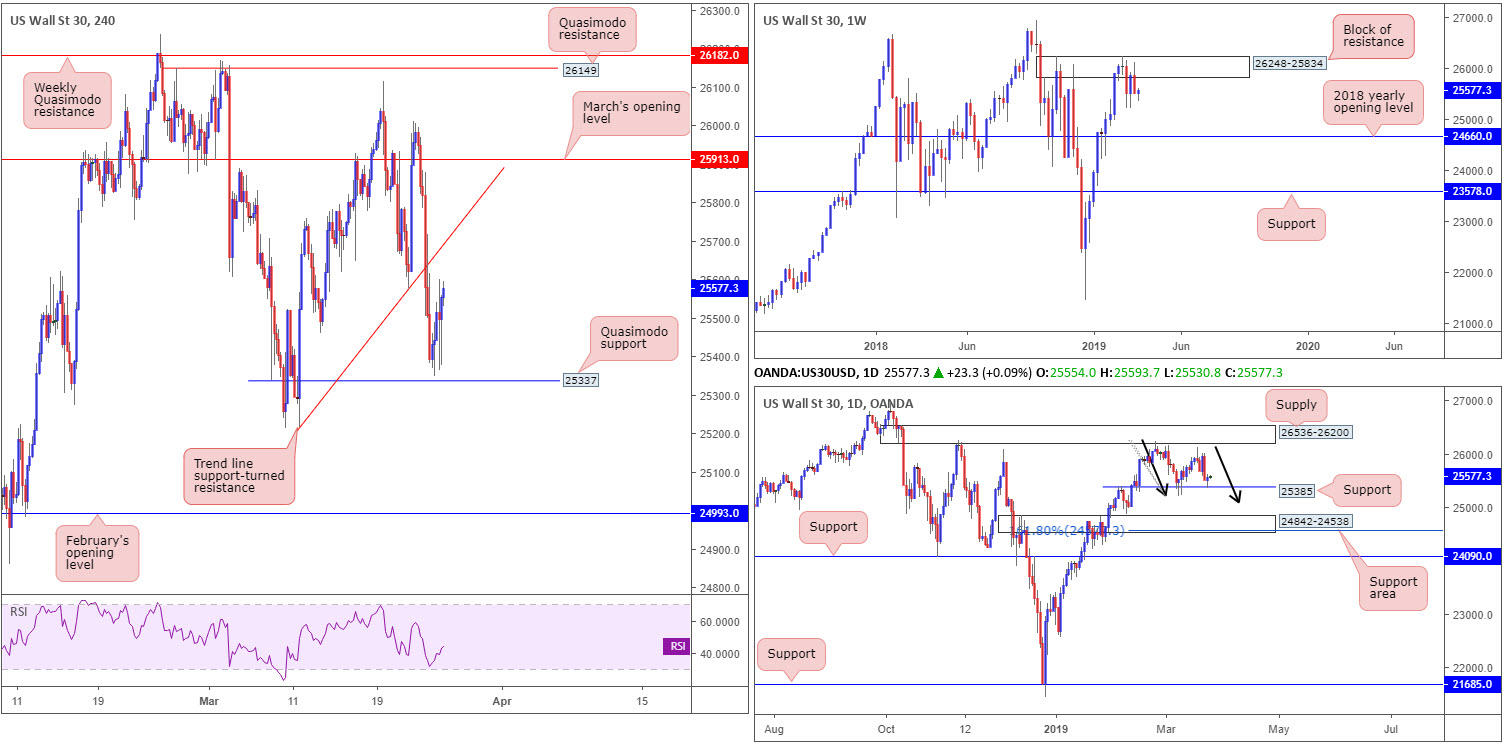
Since early February, traders have called a block of resistance at 26248-25834 home on the weekly timeframe. Last week’s response from this barrier was of notable strength, closing not too far off its lows. Further downside from this point could eventually see the index knocking on the door of its 2018 yearly opening level at 24660.
Support at 25385 on the daily timeframe elbowed its way into the fight Monday, which could potentially pause weekly selling. A push beneath this number, nonetheless, will likely bring in a possible daily ABCD bullish motion (black arrows) terminating around 25112. Traders may also want to acknowledge a daily support area seen at 24842-24538 which holds within it a 161.8% Fibonacci extension at 24588 (an addition to the aforesaid ABCD formation).
Leaving Quasimodo support at 25337 on the H4 timeframe unchallenged, the candles, helped by daily support highlighted above, advanced north yesterday. This places trend line support-turned resistance (taken from the low 25215) in view as the next upside target.
Areas of consideration:
Entering short from the aforementioned H4 trend line support-turned resistance is a risky call, according to our technical reading. Not only does weekly price show room to potentially reconnect with the underside of its resistance area at 25834, recall daily flow has also just left a support mentioned above at 25385.
Should we test the H4 Quasimodo support underlined above at 25337, the research team believes a bounce higher could be in the offing, due to the level fusing closely with daily support priced in at 25385. The only caveat here, of course, is the threat of selling on the weekly timeframe towards 24660. As such, trading 25337 with additional confirmation, be it on the H4 or lower timeframes, is recommended. Not only will this help identify buyer interest, it’d also provide entry and risk levels to work with.
Today’s data points: FOMC Member Evans Speaks; US Building Permits; US CB Consumer Confidence.
XAU/USD (GOLD):
In $ terms, the price of gold increased in value Monday, up 0.65%. The US dollar index, calculated by factoring in the exchange rates of six major world currencies, failed to maintain Friday’s upside momentum and marginally closed in the red. In addition to this, the US Treasury 10-year yield note crossed below 2.4%. Both tend to be inversely correlated with bullion.
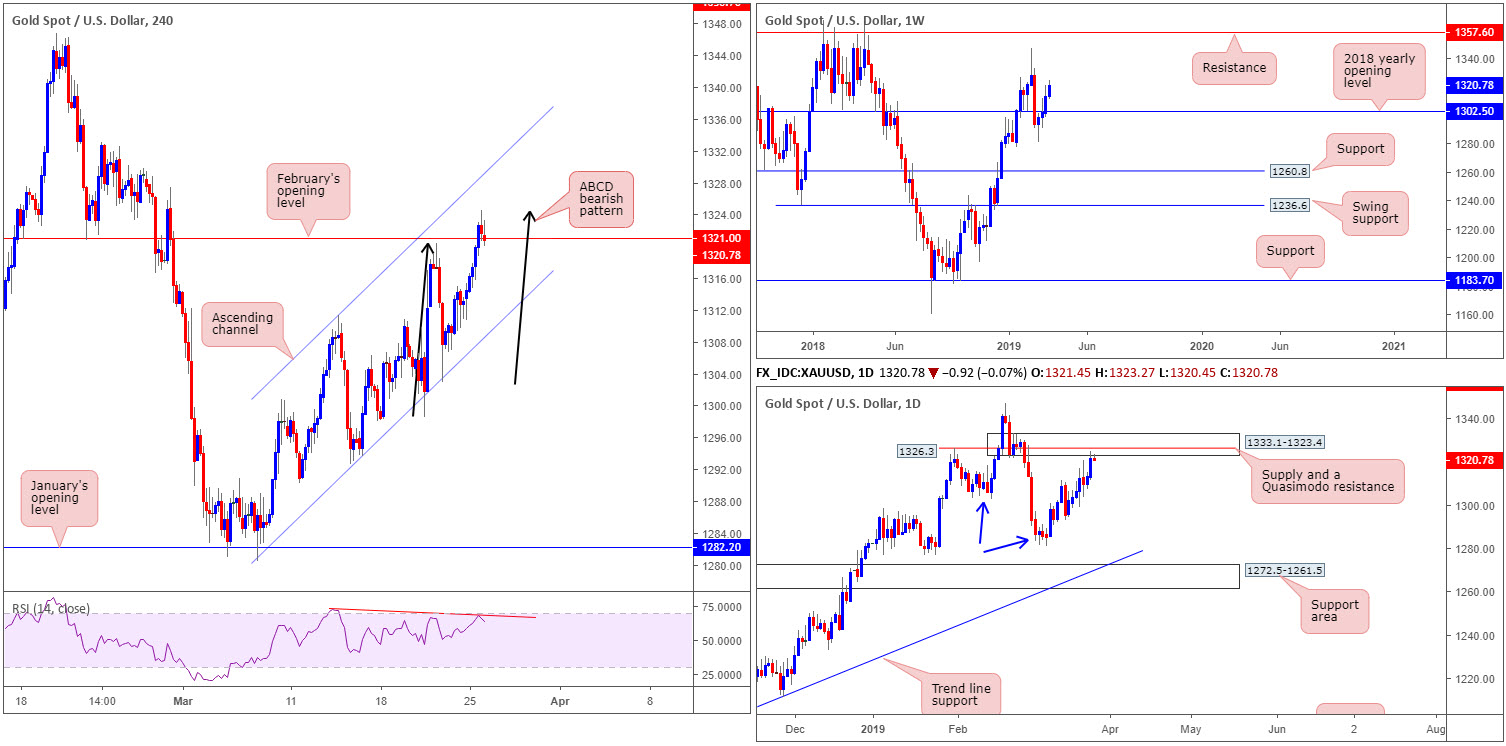
The technical landscape on the weekly timeframe for XAU/USD, after clearing its 2018 yearly opening level at 1302.5, displays a reasonably clear run towards the 1346.7 Feb 18 high, as well as nearby resistance parked at 1357.6. Over on the daily timeframe, supply at 1333.1-1323.4 entered the mix Friday, which houses within it a Quasimodo resistance level at 1326.3. This area boasts additional weight given we printed a lower low at 1281.0 (March 7), breaking the 1302.4 Feb 14 low (blue arrows).
A closer reading of price action on the H4 timeframe has the candles crossing swords with a ABCD bearish completion point at 1324.6 (black arrows). Note the unit also flirts with February’s opening level at 1321.0 and is compressing within an ascending channel formation (low: 1280.4 high: 1311.3). What’s also notable from a technical perspective is the RSI indicator is seen displaying a divergence/overbought reading (red line).
Areas of consideration:
While the threat of further buying on the weekly timeframe is there, traders may be interested in a sell from below February’s opening level on the H4 timeframe at 1321.0. A decisive H4 close below here (entry/risk levels can be decided according to this breakout candle if the trader wishes), aligning with daily sellers pushing lower from noted supply, has H4 channel support to target (extended from the low 1280.4).
The accuracy, completeness and timeliness of the information contained on this site cannot be guaranteed. IC Markets does not warranty, guarantee or make any representations, or assume any liability with regard to financial results based on the use of the information in the site.
News, views, opinions, recommendations and other information obtained from sources outside of www.icmarkets.com.au, used in this site are believed to be reliable, but we cannot guarantee their accuracy or completeness. All such information is subject to change at any time without notice. IC Markets assumes no responsibility for the content of any linked site. The fact that such links may exist does not indicate approval or endorsement of any material contained on any linked site.
IC Markets is not liable for any harm caused by the transmission, through accessing the services or information on this site, of a computer virus, or other computer code or programming device that might be used to access, delete, damage, disable, disrupt or otherwise impede in any manner, the operation of the site or of any user’s software, hardware, data or property.


