
EUR/USD:
Weekly Gain/Loss: +1.08%
Weekly Close: 1.1746
Weekly perspective:
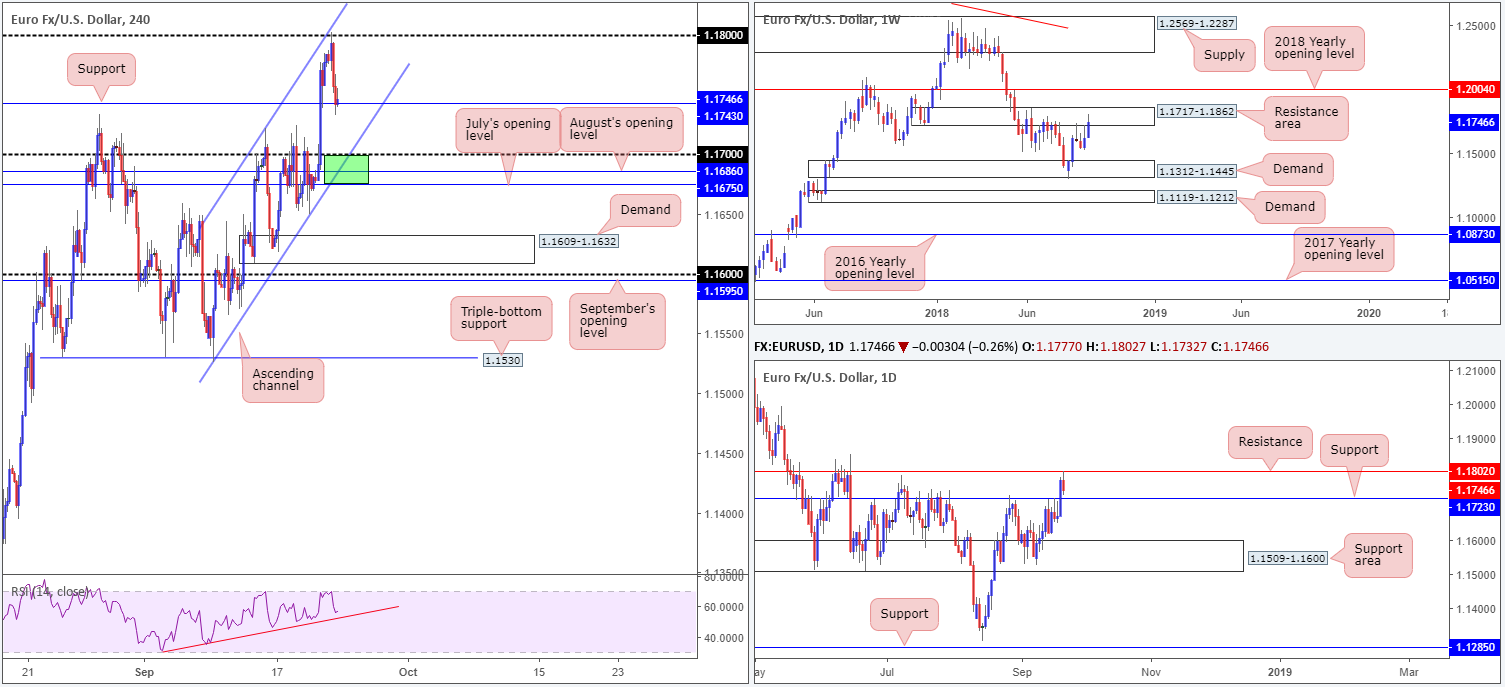
The single currency produced strong gains over the course of last week, aided by an overall weaker US dollar. Going forward, however, demand for the euro may diminish on this scale as the unit recently shook hands with the underside of a notable resistance area coming in at 1.1717-1.1862. Capping upside in the months of May, June and July of this year, this area certainly has potential! The next downside target on this scale falls in around demand drawn from 1.1312-1.1445.
Daily perspective:
From this side of the market, our technical studies show the euro surrendered some of its gains on Friday. The pair, as you can see, responded from resistance at 1.1802 and mildly pared a portion of Thursday’s upside move. What’s also worth noting from a technical perspective here is the oncoming support priced in at 1.1723. Price is likely to find some sort of floor around this neighborhood, with it having been a strong barrier of resistance on a number of occasions in the past.
H4 perspective:
A quick recap of Friday’s movement on the H4 timeframe saw risk appetite sour upon reaching its 1.18 handle and converging channel resistance (etched from the high 1.1721). Eurozone Markit PMIs for September came in weaker than expected, helping the market find a top around 1.18. Shortly after, UK PM May’s comments on Brexit added additional fuel, consequently ending Friday’s session crossing swords with support at 1.1743 in the shape of an inverse pin-bar formation.
Areas of consideration:
- An area particularly stand out this morning on the H4 timeframe is 1.1675/1.17. Comprised of July’s opening level at 1.1675, August’s opening level at 1.1686, the 1.17 handle and an intersecting channel support (green area), this zone offers traders a potential area for a bounce higher. Granted, to bring in 1.1675/1.17, a mild fakeout through daily support at 1.1723 would need to be observed. Furthermore, traders are urged to remain cognizant of where we’re coming from on the weekly timeframe, hence why a bounce higher is mentioned and not a correction. Traders attempting to fade the green zone without additional confirmation will likely position stops a few pips beneath 1.1675 and target 1.1743 as the initial base. Conservative traders, on the other hand, may opt to enter based on a candlestick formation and base risk and entry on the said structure.
- The current H4 support level at 1.1743 may also be of interest to some traders, given it formed an inverse pin-bar formation. This is generally considered a bullish signal.
Today’s data points: German IFO business climate (survey).
GBP/USD:
Weekly Gain/Loss: +0.08%
Weekly Close: 1.3076
Weekly perspective:
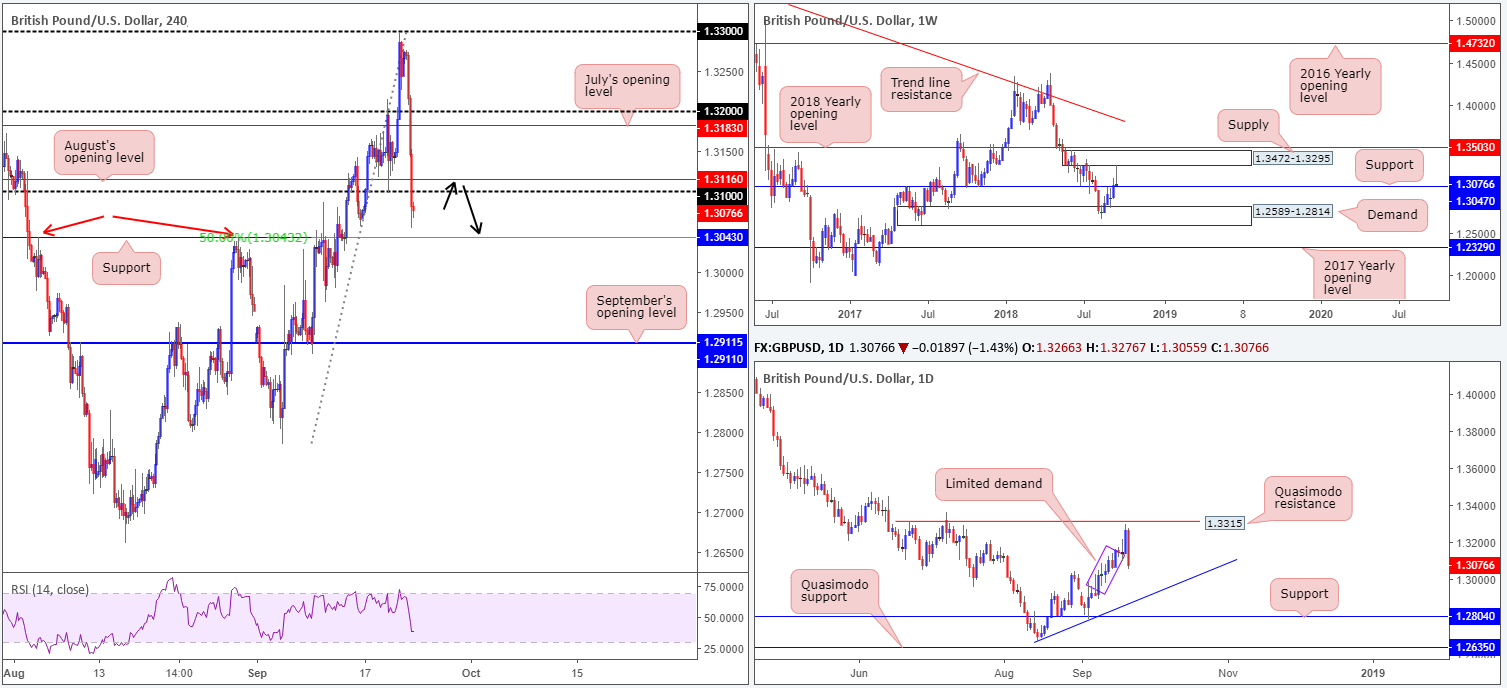
The market witnessed a strong bout of GBP buying throughout the majority of last week, consequently forcing price to cross swords with a supply zone drawn from 1.3472-1.3295. As you can see, though, heavyweight selling pressure emerged from the underside of this zone and wrapped up the week forming a nice-looking bearish pin-bar formation. While this is considered a sell signal, traders still need to account for the fact we have yet to cross below nearby support at 1.3047.
Daily perspective:
Leaving Quasimodo resistance at 1.3315 unchallenged, the pound sank lower on Friday and engulfed a number of daily candles. Further selling, according to our reading, is likely on the cards as limited demand to the left of current price is seen (purple zone) until we reach trend line support (etched from the low 1.2661).
H4 perspective:
Although the week was bursting with optimism on the Brexit front, along with significant UK CPI and retail sales data beats, GBP buyers lost their flavour on Friday. The day began with EU negotiators informing UK PM May her Chequers Brexit plan would not work, sparking a round of aggressive GBP selling. This was followed by comments from the PM admitting the UK and EU are at an impasse, which added fuel to the fire. The day ended with the H4 candles closing beneath its 1.31 handle.
Areas of consideration:
A retest play to the underside of 1.31/August’s opening level at 1.3116 (H4 timeframe) is certainly something to keep an eye on this morning, though a strict (initial) target objective should be set at H4 support drawn from 1.3043. Note 1.3043 represents a 50.0% support value and is also positioned just beneath weekly support mentioned above at 1.3047.
For folks looking for an additional safety net here, consider waiting for a H4 bearish candlestick formation to take shape at the retest of 1.31. This not only provides a level to enter from as well as stop-loss placement, it also displays seller intent.
Today’s data points: Limited.
AUD/USD:
Weekly Gain/Loss: +1.87%
Weekly Close: 0.7285
Weekly perspective:
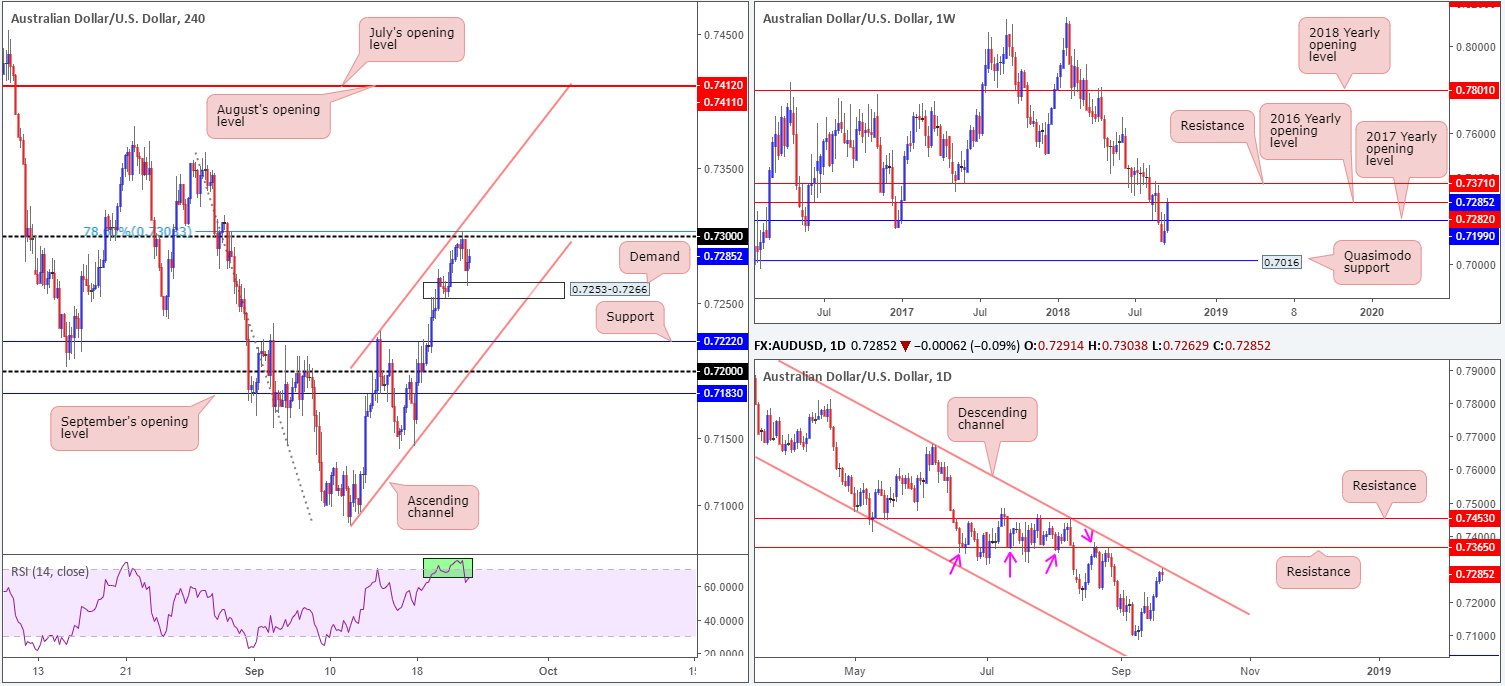
In contrast to sterling, the Australian dollar managed to hold the bulk of its gains vs. the greenback last week. Price firmly reclaimed its 2017 yearly opening level at 0.7199 and marginally closed above its 2016 yearly opening level plotted at 0.7282. Further upside from this point has a key resistance at 0.7371 to target.
Daily perspective:
Since the beginning of the year, the daily candles have been compressed within a descending channel formation (0.8135/0.7758). Of late, however, Friday’s action witnessed price put in an indecision candle around the top range of this channel, which, given we’re also engaging with the 2016 yearly opening level at 0.7282 on the weekly timeframe, could lead to a downside move materializing this week.
H4 perspective:
In the absence of significant macroeconomic data releases out of Australia on Friday, the AUD/USD’s primary driver fell on the back of USD movement. Following a sharp drop in the GBP/USD pricing, the US Dollar Index broke above the 94 mark and pressured the commodity currency to lower ground from its 0.73 handle. Note 0.73 was bolstered by a 78.6% Fib resistance value at 0.7303, a channel resistance (taken from the high 0.7229) and also a converging overbought RSI reading. Well done to any of our readers who managed to jump aboard the move off this number as it was a noted level to watch in Friday’s briefing.
Areas of consideration:
From an intraday perspective, the H4 candles are currently sandwiched between demand coming in at 0.7253-0.7266 and the 0.73 level. Sellers, however, likely have the upper hand here, not only because of the H4 confluence drawn in from 0.73, but also due to where we’re coming from on the bigger picture! Therefore, the expectation is for a break of the current H4 demand area today/early this week, and eventually a test of H4 support priced in at 0.7222, followed by the 0.72 handle. This, as you can see on the weekly timeframe, also represents the 2017 yearly opening level.
On account of the above, the following scenarios could play out:
- Another retest of 0.73 could take place. This – coupled with a H4 bearish candlestick formation – would, according to our reading, likely be enough to drawn in sellers once again and push lower.
- A H4 close beneath the current H4 demand area that’s followed up with a retest as resistance in the shape of a bearish candlestick formation would also likely be enough to drawn in sellers.
Waiting for additional candlestick confirmation not only provides traders a level to enter from and a stop-loss location, it also shows there is seller intent present. As for take-profit targets, see above in bold.
Today’s data points: Chinese banks are closed in observance of the Mid-Autumn Festival.
USD/JPY:
Weekly Gain/Loss: +0.45%
Weekly Close: 112.55
Weekly perspective:
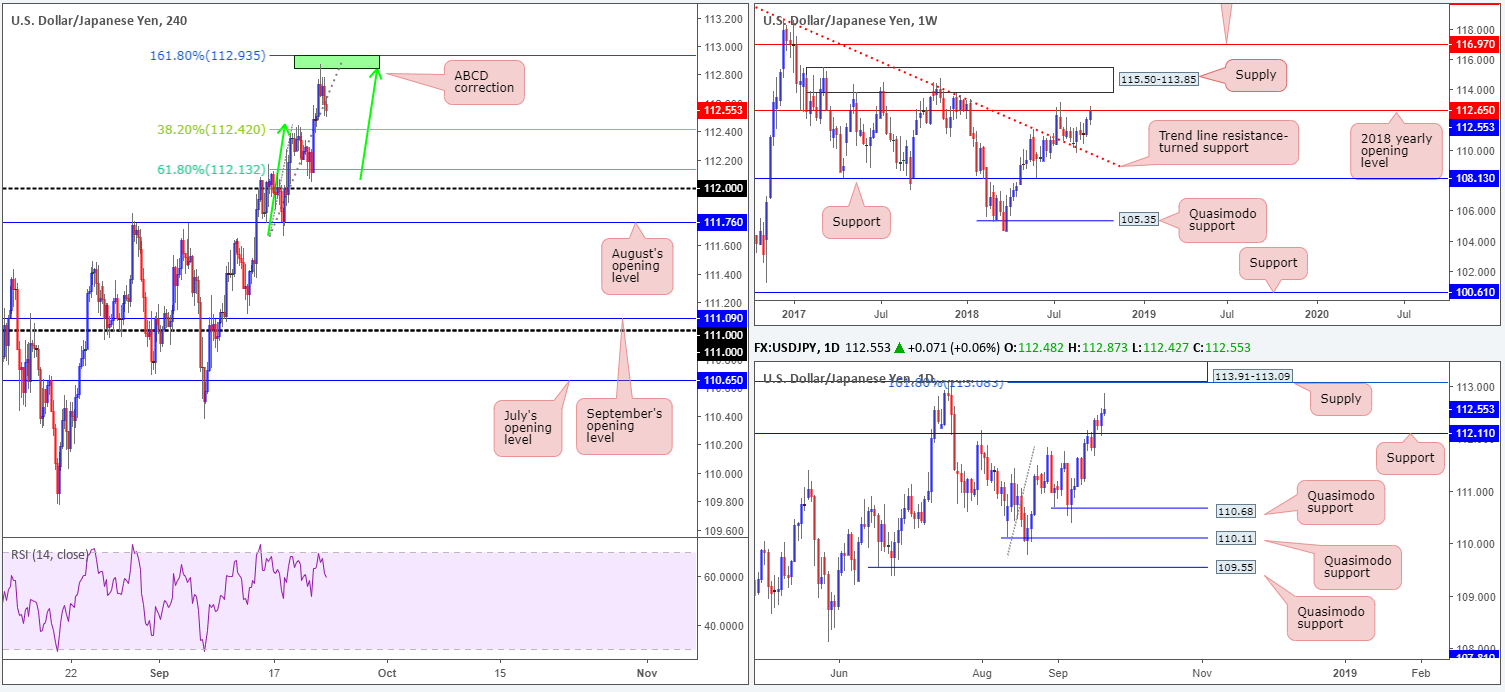
The USD/JPY built on recent gains last week, though was unable to close beyond its 2018 yearly opening level at 112.65, despite reaching highs of 112.87. This level already held price lower in July, so it’ll be interesting to see if history will repeat itself!
Daily perspective:
Thursday’s sessions witnessed price action retest a resistance-turned support level at 112.11 in strong fashion. This sparked a round of buying going into Friday’s sessions, though failed to sustain gains beyond highs of 112.87, concluding the day in the shape of a bearish pin-bar formation. Continued buying from here has the supply zone set at 113.91-113.09 (merges with a 161.8% Fib ext. point at 113.08) in view.
H4 perspective:
As US equities consolidated recent gains, the USD/JPY pulled back from highs of 112.87 on Friday. Technically speaking, the pair found sellers at an ABCD correction point marked in green at 112.93/112.85. Downside targets from this pattern fall in around the 61.8% and 38.2% Fib support values at 112.13 and 112.42, respectively. Note 112.13 sits directly on top of the current daily support level at 112.11.
Areas of consideration:
In light of where this market is positioned on the weekly timeframe, along with the bearish formation printed on the daily timeframe going into the close, the current H4 ABCD correction will likely reach its two aforementioned downside targets early this week.
Unless traders observe a second retest of the H4 ABCD correction point between 112.93/112.85 BEFORE price hits its 38.2% Fib support value at 112.42, we do not see much to hang our hat on for the time being. Should a retest play out, however, entering on the back of a bearish candlestick formation is considered high probability (stops should be positioned according to the candlestick’s structure). The reason for requiring additional candlestick confirmation here is simply due to the area already being tested, and therefore potentially weakened.
Today’s data points: Limited. Japanese banks are closed in observance of Autumnal Equinox Day.
USD/CAD:
Weekly Gain/Loss: -0.98%
Weekly Close: 1.2911
Weekly perspective:
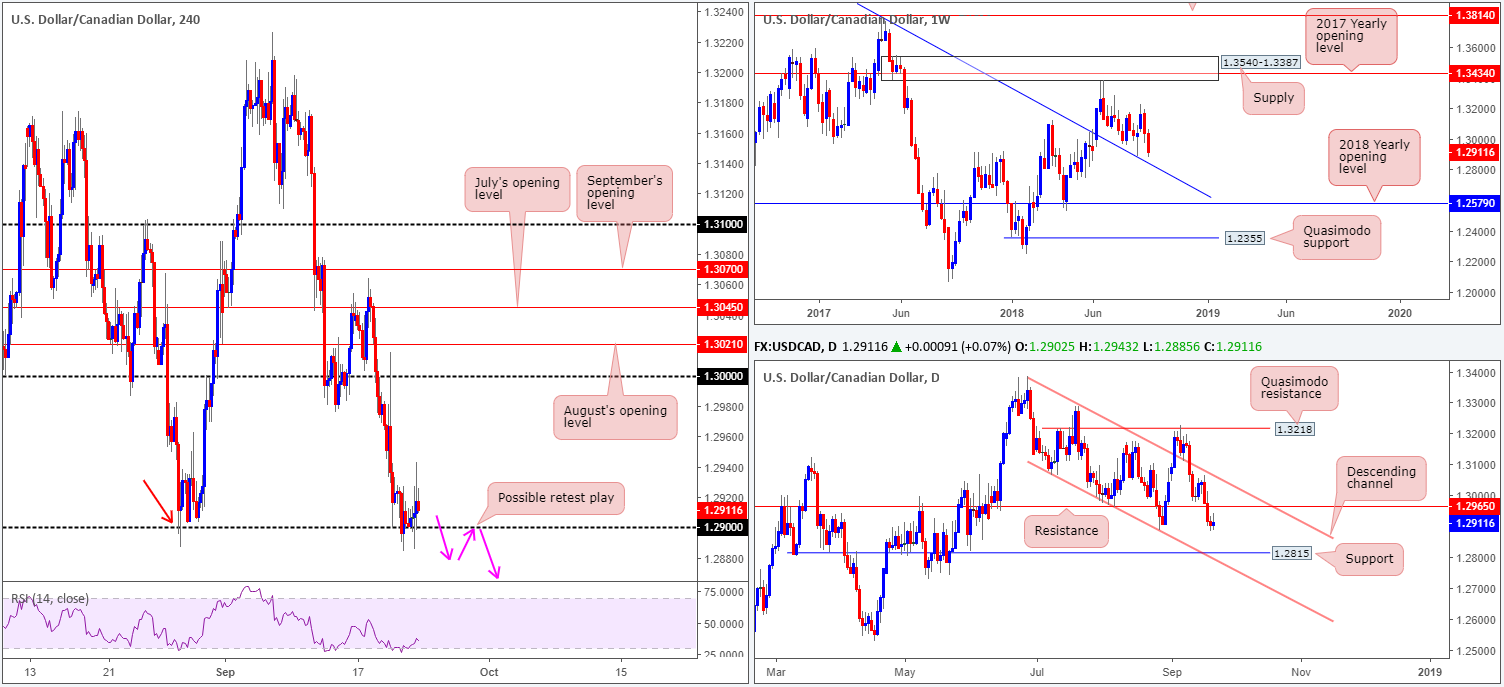
The USD/CAD endured additional loss over the course of last week, chalking up a near-full-bodied bearish candle. Two weeks of dominant selling in this market has brought the pair within reasonably close proximity to a trend line resistance-turned support (extended from the high 1.4689). This barrier supported price once already back in late August, so there’s a chance we may see history repeat itself.
Daily perspective:
Since late June (apart from the time price wandered out of range in early September for a week or so) the pair has been compressed within a descending channel formation (1.3386/1.3066). Of late, we’ve seen the pair take out support at 1.2965 (now acting resistance) and test the August 28 lows at 1.2887. A break beyond this neighborhood has support at 1.2815 to target.
H4 perspective:
A brief look at recent dealings on the H4 picture shows the 1.29 handle remains in play, despite a number of attempts to explore lower levels. Looking at the candles’ reaction to 1.29 in the later stages of last week, however, compared with that of the 28th August (red arrow), the buyers lack interest it would seem.
On account of this, 1.29 may give way today and see the candles connect with 1.2836: a Quasimodo support level (not seen on the screen). This level also happens to merge closely with the weekly trend line resistance-turned support mentioned above.
Areas of consideration:
As stop-loss orders beneath 1.29 were likely tripped during recent movement, a break/retest play could still be on the menu today. A H4 close beneath 1.29 that’s followed up with a retest in the shape of a H4 bearish candlestick formation (pink arrows) would, according to our studies, be enough to draw in sellers, targeting 1.2836. This, from a technical standpoint, should be considered a final take-profit target for shorts, due to its relationship with weekly structure.
Today’s data points: Limited.
USD/CHF:
Weekly Gain/Loss: -0.95%
Weekly Close: 0.9580
Weekly perspective:
The USD/CHF come under reasonably heavy selling pressure last week, with further downside potentially on the horizon. Weekly price, after firmly retesting the underside of its 2018 yearly opening level at 0.9744, shows room to stretch as far south as the 0.9443-0.9515 area. This zone has incredible history dating as far back as October 2015.
Daily perspective:
A closer look at price action on the daily timeframe shows demand at 0.9577-0.9637 suffered a breach to the downside on Friday to lows of 0.9542. This potentially set the stage for a continuation move lower this week towards 0.9441: the only fresh line of support/demand we can see on this scale.
H4 perspective:
Leaving support at 0.9533 unchallenged on Friday, the USD/CHF recovered some ground and topped within two pips of its 0.96 handle, shadowed closely by a 38.2% Fib resistance value at 0.9603. Having seen weekly price in favour of lower prices and daily price recently cracking beneath a base of demand, the underside of 0.96 remains a hot point for shorts, according to our technical studies.
Areas of consideration:
Selling from 0.96/the 38.2% Fib resistance value at 0.9603 is certainly an option today. Aggressive traders will likely enter at market in the hope price turns at 0.96 with stops positioned 10-15 pips above the number, whereas conservative traders may opt to wait and enter on candlestick confirmation. This way of entering not only provides traders an entry and stop-loss level, it also displays seller intent!
Today’s data points: Limited.

Dow Jones Industrial Average:
Weekly Gain/Loss: +2.16%
Weekly Close: 26721
Weekly perspective:
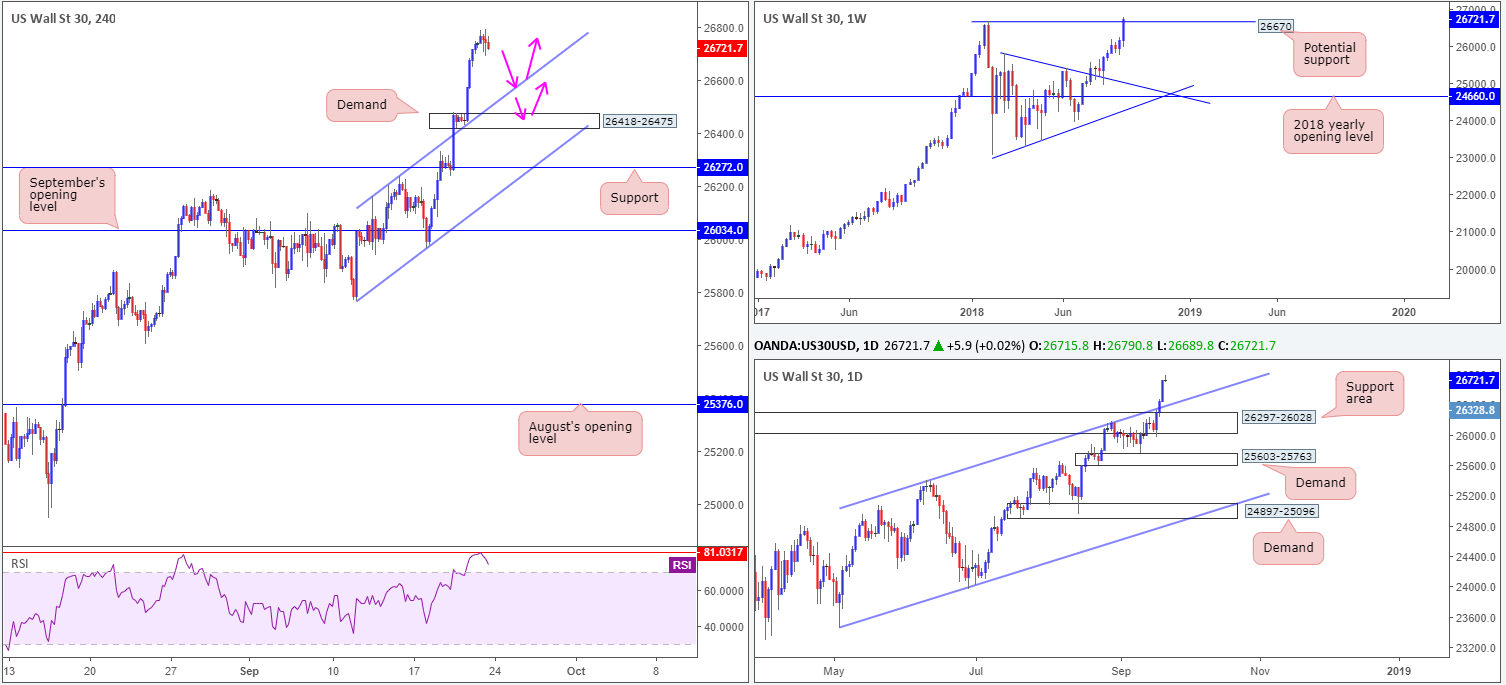
US equities printed strong gains in recent trade, lifting the Dow Jones Industrial Average to fresh record highs of 26790. On the weekly timeframe, price could potentially find support above the January 29 high of 26670.
Daily perspective:
Turning the focus to the daily timeframe, the technicals still show the market could observe a pullback to the channel resistance-turned support (etched from the high 25385). Failure to hold at this barrier would likely lead to an approach towards the nearby support zone marked at 26297-26028.
H4 perspective:
On the H4 timeframe, however, the recently broken channel resistance (now acting support – etched from the high 23163) is the next obvious downside base, seen positioned just north of a demand at 26418-26475. Also worth noting from a technical standpoint is the H4 RSI indicator currently displaying a strong overbought reading along with the value seen turning off RSI resistance at 81.03.
Areas of consideration:
Given the market is seen trading at record highs, buying at current price remains chancy. A pullback is likely to take shape prior to higher highs forming. For that reason, traders are urged to watch the current H4 channel resistance-turned support mentioned above for possible longs this week, alongside the H4 demand zone at 26418-26475 (see pink arrows). As usual, conservative traders may want to consider waiting for additional candlestick confirmation prior to pulling the trigger.
Remember, if price fails to hold at these H4 areas, a test of the daily channel resistance-turned support mentioned above is likely going to be the next base on the hit list.
Today’s data points: Limited.
XAU/USD (Gold)
Weekly Gain/Loss: +0.50%
Weekly Close: 1199.6
Weekly perspective:
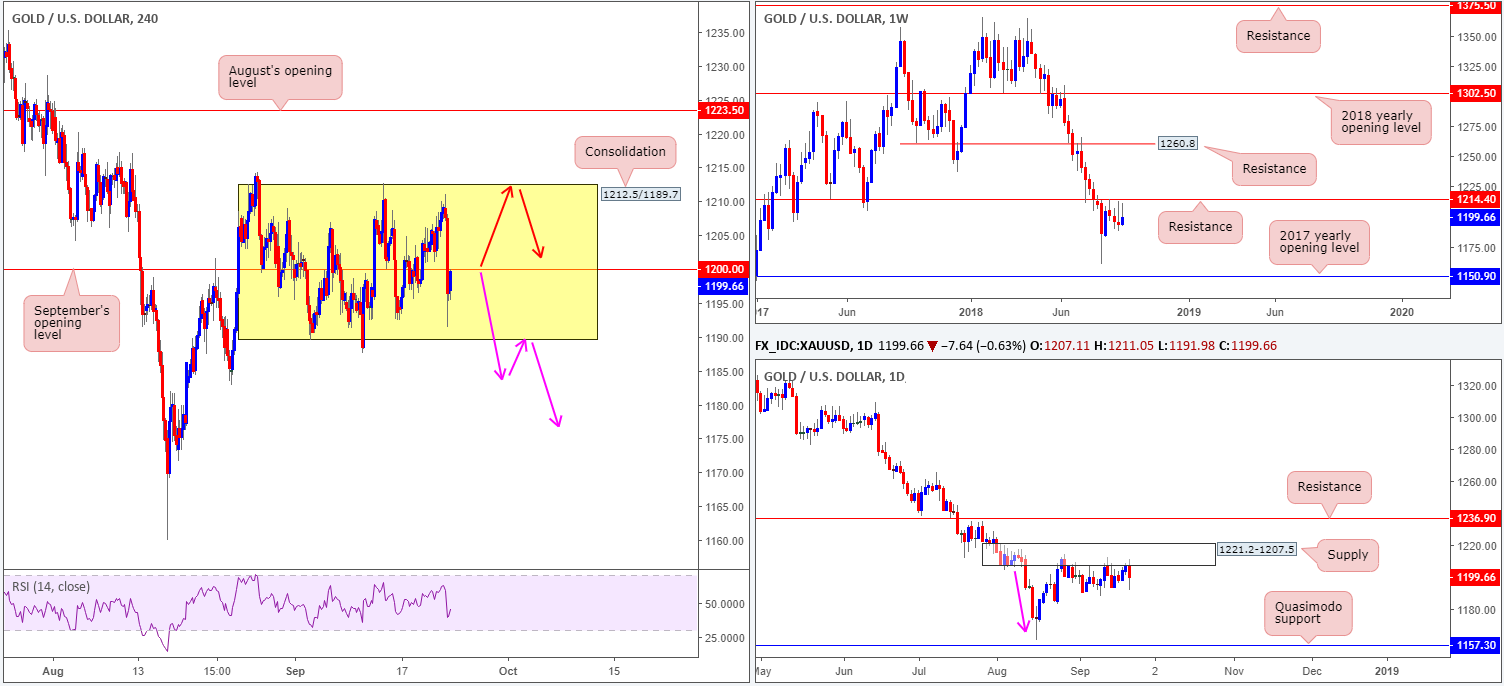
Gold’s price action, as you can see on the weekly timeframe, remains languishing beneath a key resistance level coming in at 1214.4 in the shape of back-to-back bearish pin-bar formations. Further downside from this point could eventually stretch as far south as the 2017 yearly opening level at 1150.9.
Daily perspective:
In conjunction with weekly flow, daily movement continues to respect the underside of a nice-looking supply zone at 1221.2-1207.5. Aside from the base displaying attractive downside momentum (see pink arrow), this area could also be considered the ‘decision point’ to print 2018 yearly lows of 1160.3. Couple this with the fact we are trading beneath weekly resistance, we still potentially have ourselves some strong sellers in the mix. It also might be worth noting Friday’s closing candle concluded in the shape of a bearish engulfing formation.
H4 perspective:
Fixed around the underside of the current daily supply zone, we can clearly see the H4 candles carving out a range between 1212.5/1189.7 that houses September’s opening level at 1200.0. As we know from the higher timeframes, the general technical bias (according to structure that is) is pointing in a southerly direction. Therefore, a breakout of this range will likely be to the downside.
Areas of consideration:
On account of the above conditions, there are two possible scenarios worth noting, as far as we can see:
- The most obvious: a breakout of the current H4 range to the downside. Following a H4 close beneath this area, a retest to the underside is certainly something to keep an eye open for as sellers may look to make an appearance here (see pink arrows). Traders are advised to wait and see if H4 price prints a bearish candlestick formation at the retest before considering a position short, since this will help avoid falling victim to fakeouts.
- Fade the upper edge of the current H4 range (see red arrows). Like above, waiting for H4 price action to chalk up a bearish candlestick pattern off the top limit before pulling the trigger is recommended.
The use of the site is agreement that the site is for informational and educational purposes only and does not constitute advice in any form in the furtherance of any trade or trading decisions.
The accuracy, completeness and timeliness of the information contained on this site cannot be guaranteed. IC Markets does not warranty, guarantee or make any representations, or assume any liability with regard to financial results based on the use of the information in the site.
News, views, opinions, recommendations and other information obtained from sources outside of www.icmarkets.com.au, used in this site are believed to be reliable, but we cannot guarantee their accuracy or completeness. All such information is subject to change at any time without notice. IC Markets assumes no responsibility for the content of any linked site. The fact that such links may exist does not indicate approval or endorsement of any material contained on any linked site.
IC Markets is not liable for any harm caused by the transmission, through accessing the services or information on this site, of a computer virus, or other computer code or programming device that might be used to access, delete, damage, disable, disrupt or otherwise impede in any manner, the operation of the site or of any user’s software, hardware, data or property.
