A note on lower timeframe confirming price action…
Waiting for lower timeframe confirmation is our main tool to confirm strength within higher timeframe zones, and has really been the key to our trading success. It takes a little time to understand the subtle nuances, however, as each trade is never the same, but once you master the rhythm so to speak, you will be saved from countless unnecessary losing trades. The following is a list of what we look for:
- A break/retest of supply or demand dependent on which way you’re trading.
- A trendline break/retest.
- Buying/selling tails/wicks – essentially we look for a cluster of very obvious spikes off of lower timeframe support and resistance levels within the higher timeframe zone.
- Candlestick patterns. We tend to only stick with pin bars and engulfing bars as these have proven to be the most effective.
For us, lower timeframe confirmation starts on the M15 and finishes up on the H1, since most of our higher timeframe areas begin with the H4. Stops usually placed 5-10 pips beyond your confirming structures.
EUR/USD:
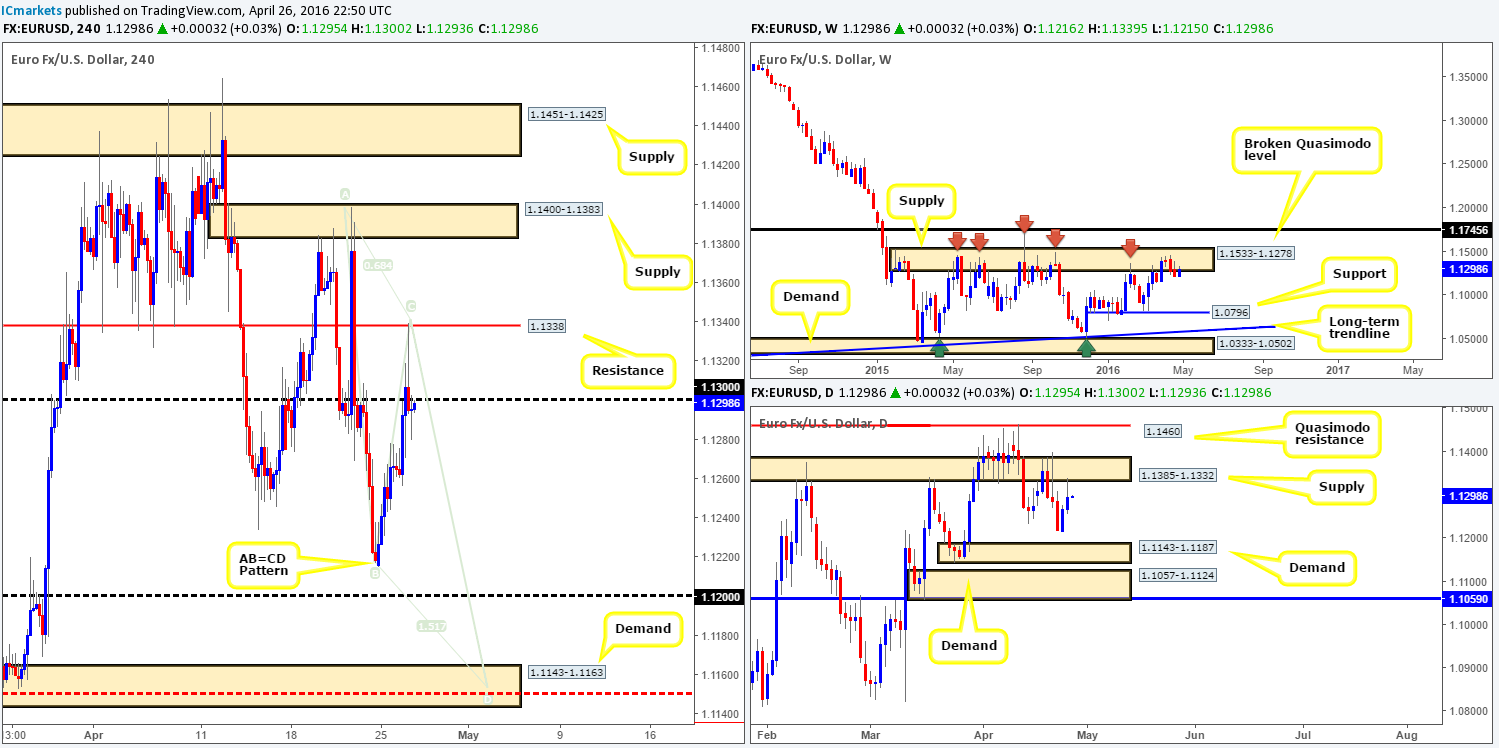
Starting from the top this morning, weekly action shows that price remains loitering around the underside of a major supply zone coming in at 1.1533-1.1278. This area has held the single currency lower since May 2015, so the bulls will likely have their work cut out for them if they intend on pushing this market higher! Turning our attention to the daily timeframe, supply at 1.1385-1.1332 was recently brought into play and is for the time being holding the EUR lower. In the event that the bears remain dominant here, its possible price may challenge demand drawn from 1.1143-1.1187.
Stepping down one more level to the H4 chart, we can see that price stretched to highs of 1.1339 yesterday following disappointing U.S. durable goods data. It was not long, however, before buying pressure halted almost to-the-pip around resistance chalked up at 1.1338 and sent price below the 1.1300 handle going into the close.
Given our notes in bold, we firmly believe that the EUR is heading south to complete the D-leg of the AB=CD bullish pattern marked on the H4 chart (D-leg completion is seen at 1.1150). As such, we’re going to be looking for lower timeframe short entries at the 1.1300 line today (for confirmation techniques, please see the top of this report), with a final target objective seen around the H4 demand at 1.1143-1.1163. This area, as you can see, not only sits within the extremes of daily demand we wrote about above, but it also houses H4 mid-level support 1.1150 and the completion point for the H4 AB=CD bullish pattern (see above).
When or indeed if price reaches the aforementioned H4 demand zone, we will, as long as the AB=CD approach remains symmetrical, look to take a long position from this area. Buying from this H4 demand base without lower timeframe confirmation (for confirmation techniques, please see the top of this report), nevertheless, is not really something we’d stamp high probability due to potential downside pressure coming in from the above said weekly supply.
Levels to watch/live orders:
- Buys: 1.1143-1.1163 [Tentative – confirmation required] (Stop loss: dependent on where one confirms this area).
- Sells: 1.1300 region [Tentative – confirmation required] (Stop loss: dependent on where one confirms this area).
GBP/USD:
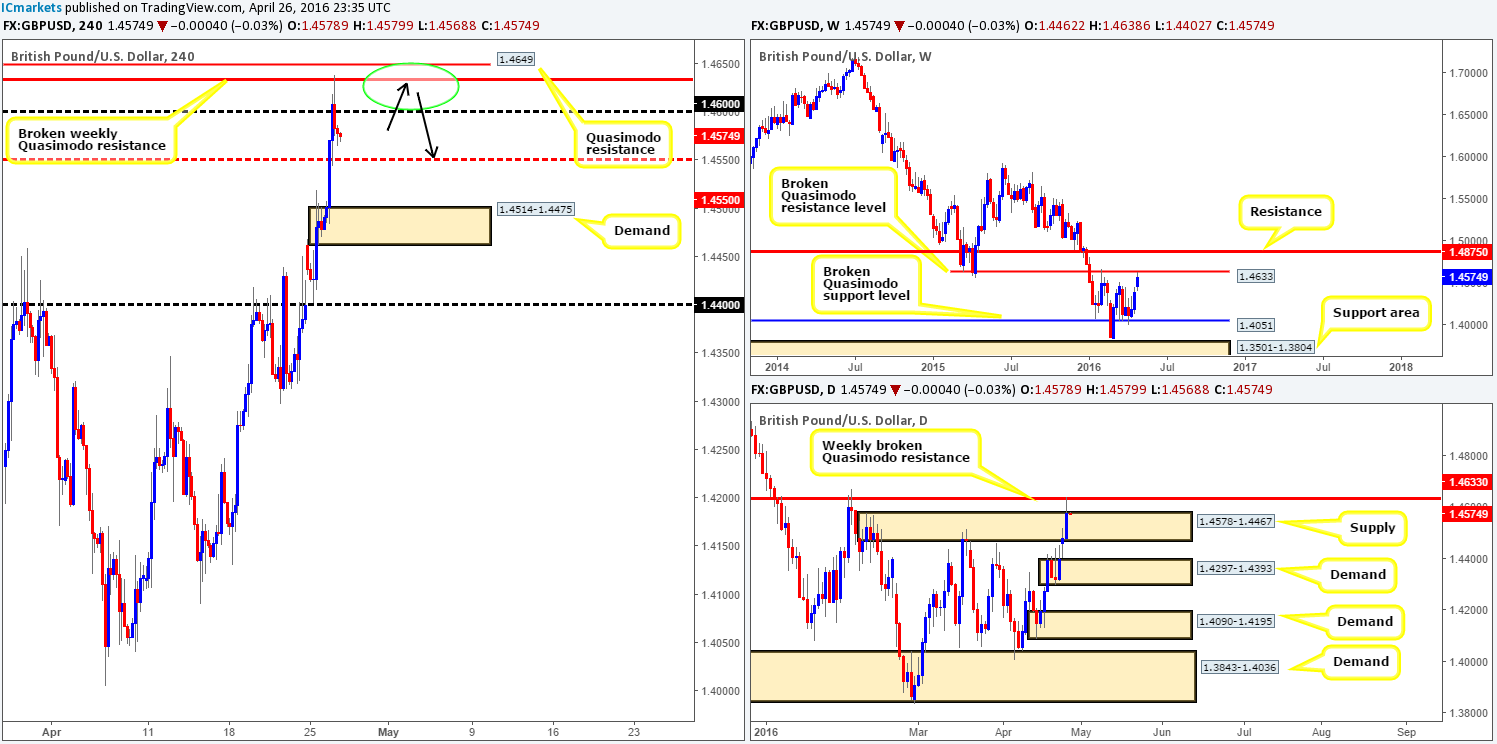
Using a top-down approach this morning, the weekly chart shows that price recently shook hands with the broken Quasimodo resistance level at 1.4633. With the predominant trend still pointing south and the fact this resistance line capped price beautifully back in February, there’s a good chance that this pair will sell-off from here. Down on the daily chart, price actually faked above a respected supply zone at 1.4578-1.4467 in order to reach offers at the aforementioned weekly level. From here the next downside target can be seen around demand given at 1.4297-1.4393.
The reaction from this weekly level, as can be seen on the H4 chart, managed to push price back below the 1.4600 line and close the day at 1.4578. We would agree that both the weekly and daily charts indicate that it may be time to consider shorting this market. However, selling at current prices might not be the best path to take considering that the H4 mid-level support 1.4550 lurks just below, which also boasts historical significance (see mid-Feb data). The best, and in our opinion, most logical way to approach this market today would be to look for trading opportunities within the green circle (as per the black arrows) which comprises of the following structures:
- A H4 Quasimodo resistance level at 1.4649.
- The aforementioned broken weekly Quasimodo resistance level.
- Psychological resistance 1.4600.
The first take-profit target would be 1.4550, followed by H4 demand coming in at 1.4514-1.4475 and then the 1.4400 line which sits on top of the daily demand mentioned above at 1.4297-1.4393.
Levels to watch/live orders:
- Buys: Flat (Stop loss: N/A).
- Sells: 1.4649/1.4600 [Tentative – confirmation required] (Stop loss: dependent on where one confirms this area).
AUD/USD:
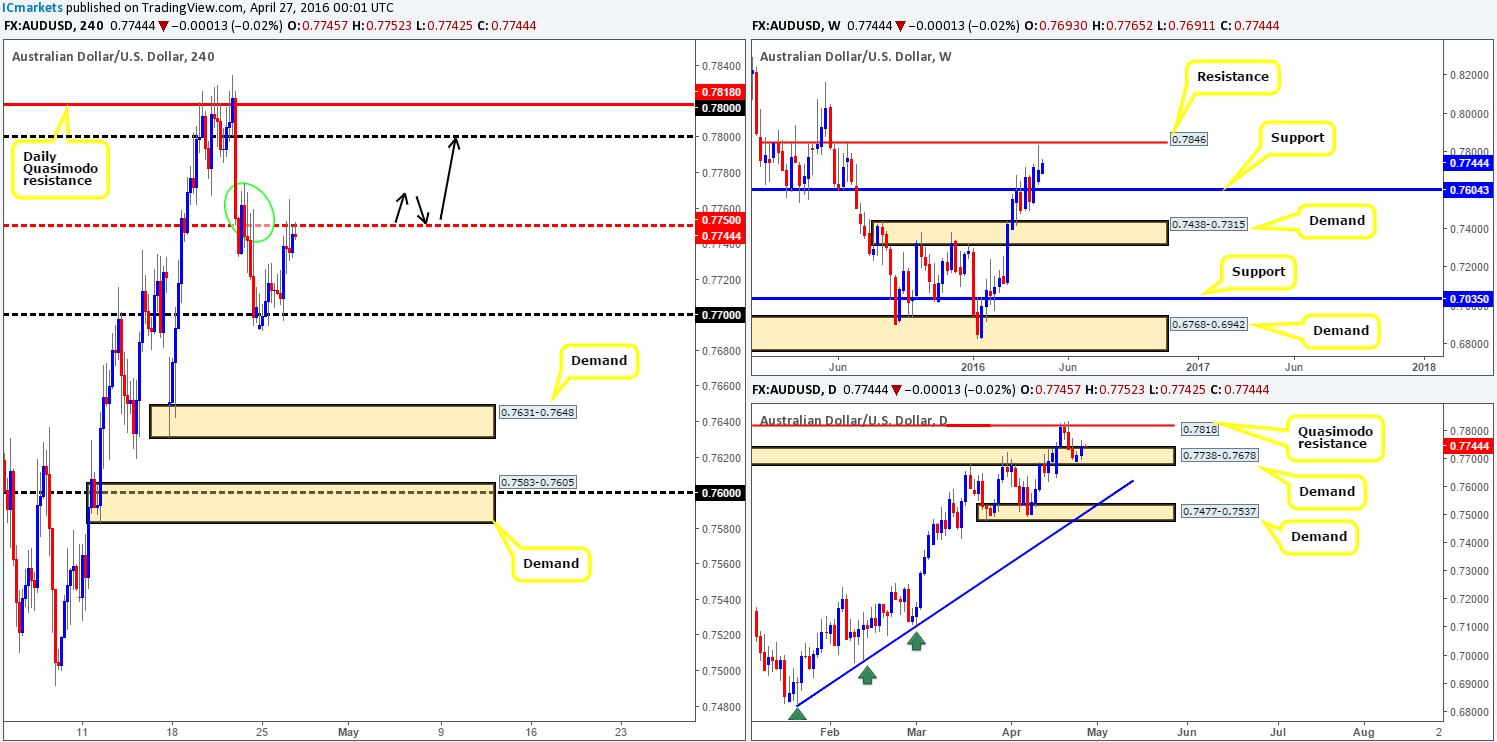
Going into the early hours of European trading yesterday, the commodity currency found a pocket of bids around the psychological support line 0.7700. This, as shown on the H4 chart, eventually saw price connect with the H4 mid-way resistance 0.7750. Unfortunately we were unable to pin down a lower timeframe buy entry at 0.7700 (this was a noted in our previous report) as the move happened very quickly. Well done to any of our readers who managed to board this train before it departed!
Now, in light of the daily chart showing price trading from demand at 0.7738-0.7678 with room to continue north up to a Quasimodo resistance at 0.7818, and the weekly chart offering little direction at present, what’s likely in store for this market today? Well, as we mentioned in yesterday’s analysis, should price collide with 0.7750 as it just recently has, we feel the offers residing around this mid-way point will likely be weak judging by the amount of times it was retested before pushing lower (see green circle). Therefore, If the Aussie sports a close above 0.7750 today and retests this line as support together with a lower timeframe buying signal (for confirmation techniques, please see the top of this report), we would enter long, targeting 0.7800, followed closely by the aforementioned daily Quasimodo resistance.
Levels to watch/live orders:
- Buys: Watch for price to consume 0.7750 and look to trade any retest seen thereafter (lower timeframe confirmation required).
- Sells: Flat (Stop loss: N/A).
USD/JPY:
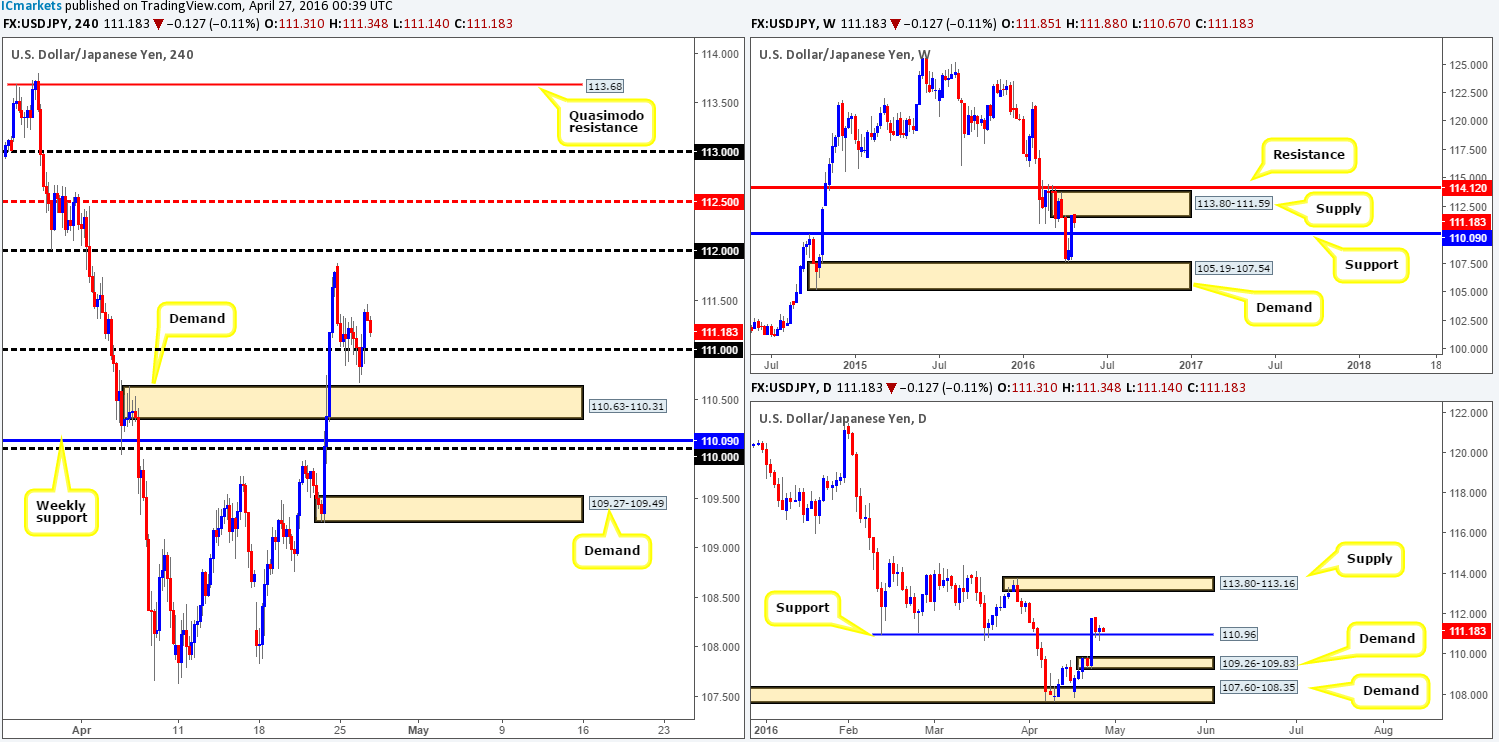
In recent trading, the USD/JPY whipsawed through the 111.00 handle and just missed the top-side of H4 demand at 110.63-110.31, before rallying to highs of 111.47 on the day. Looking only at the H4 chart for the minute, we can see that selling this market is difficult due to structure seen below (Psychological support 111.00/H4 demand at 110.63-110.31/Weekly support 110.09 as well as psychological support 110.00). The more logical route appears to be north where one could target the weekly open level at 111.85, followed by psychological resistance 112.00.
However, over on the higher-timeframe picture the weekly chart shows price trading from supply at 113.80-111.59, with the next downside target coming in at 110.09 – a support level. Despite what the weekly picture is showing, daily price is currently retesting a recently broken resistance line at 110.96 as support. If this boundary holds firm we see little overhead resistance stopping this market from advancing north up to supply seen at 113.80-113.16 (sits within the extremes of the aforementioned weekly supply).
As you can see, the weekly chart indicates selling may be the more appropriate action to take today, but as we already know from the H4 chart, this would be challenging. This leaves us with the daily chart bouncing from support at 110.96, and potential upside being seen on the H4 chart. With this in mind, our plan of action today is to simply watch for long trades around both 111.00 and H4 demand at 110.63-110.31. We will of course not be placing pending orders at these areas due to where price is positioned on the weekly chart, and will only consider entry upon satisfactory lower timeframe confirmation (for confirmation techniques, please see the top of this report).
Levels to watch/live orders:
- Buys: 111.00 [Tentative – confirmation required] (Stop loss: dependent on where one confirms this area). 110.63-110.31 [Tentative – confirmation required] (Stop loss: dependent on where one confirms this area).
- Sells: Flat (Stop loss: N/A).
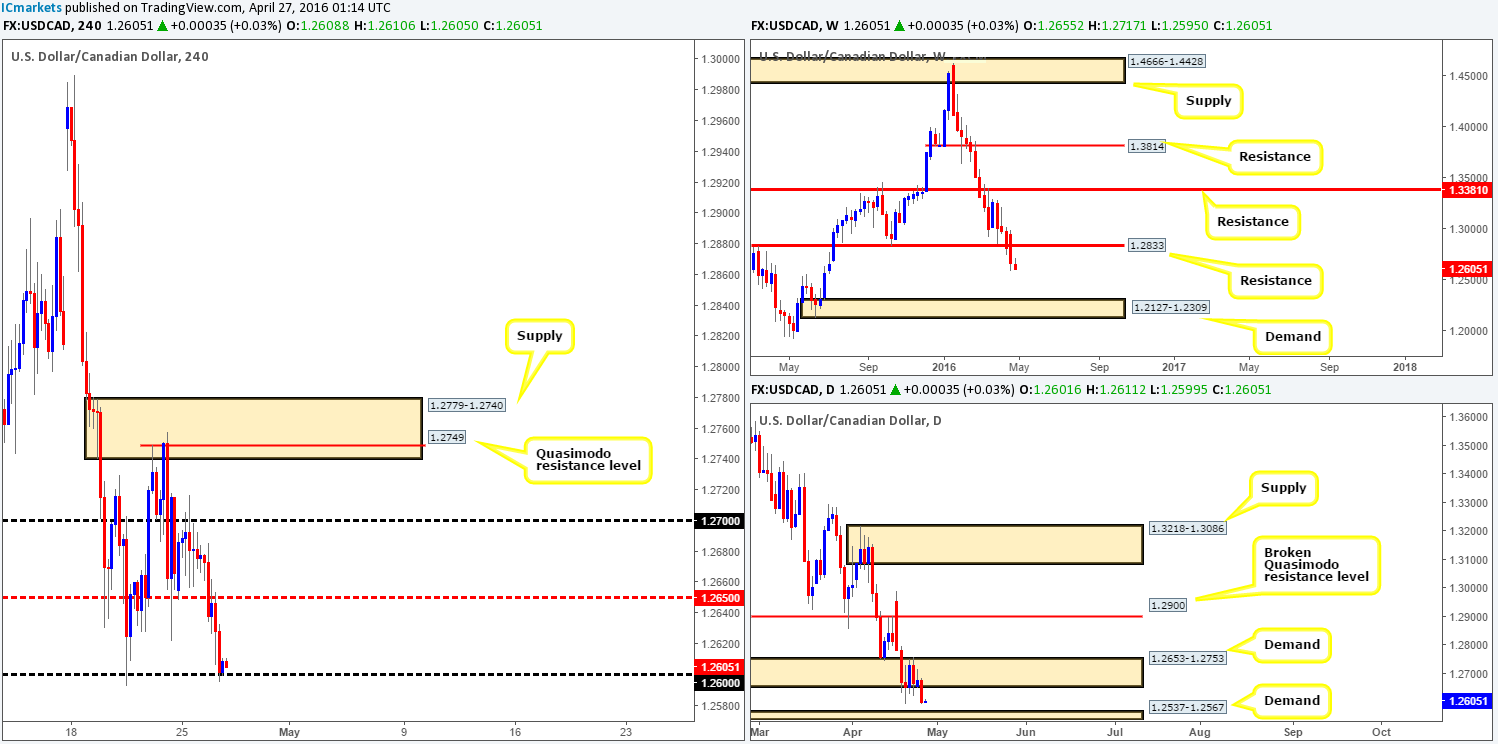
USD/CAD:
Despite the bounce seen from the H4 mid-way support at 1.2650 on Friday, downside risk continues to plague this pair. 1.2650 was taken out and retested as resistance going into the London session yesterday, which shortly after saw the pair resume its decline down into the hands of psychological support 1.2600. To our way of seeing things, the Loonie may bounce from this number but it will likely be short-lived! Our reasoning lies within the higher-timeframe picture…
Check out the weekly chart. Price completely annihilated support at 1.2833 last week, which has potentially opened up the path south towards demand chalked up at 1.2127-1.2309. Looking down to the daily chart, demand at 1.2653-1.2753 (now acting supply) was taken out during yesterday’s sell-off, consequently setting the stage for a possible continuation move down to demand at 1.2537-1.2567.
Given the negative climate the bigger picture is drawing up right now, buying from 1.2600 is out of the question for us today. In the event that this line is taken out, however, this could lay a foundation for a short trade down to H4 support coming in at 1.2538. In order for us to be permitted to trade this move, we’d need to see price not only retest 1.2600 as resistance, but also sport a lower timeframe sell entry (for confirmation techniques, please see the top of this report). Should this come to fruition, the first take-profit target would be set at the mid-way point 1.2550 which is where we’ll also look to reduce risk, since at that point we’d be trading within daily demand at 1.2537-1.2567. Final take-profit would be the H4 support we mentioned above at 1.2538, essentially marking the extreme point of the target daily demand.
Levels to watch/live orders:
- Buys: Flat (Stop loss: N/A).
- Sells: Watch for price to consume 1.2600 and look to trade any retest seen thereafter (lower timeframe confirmation required).
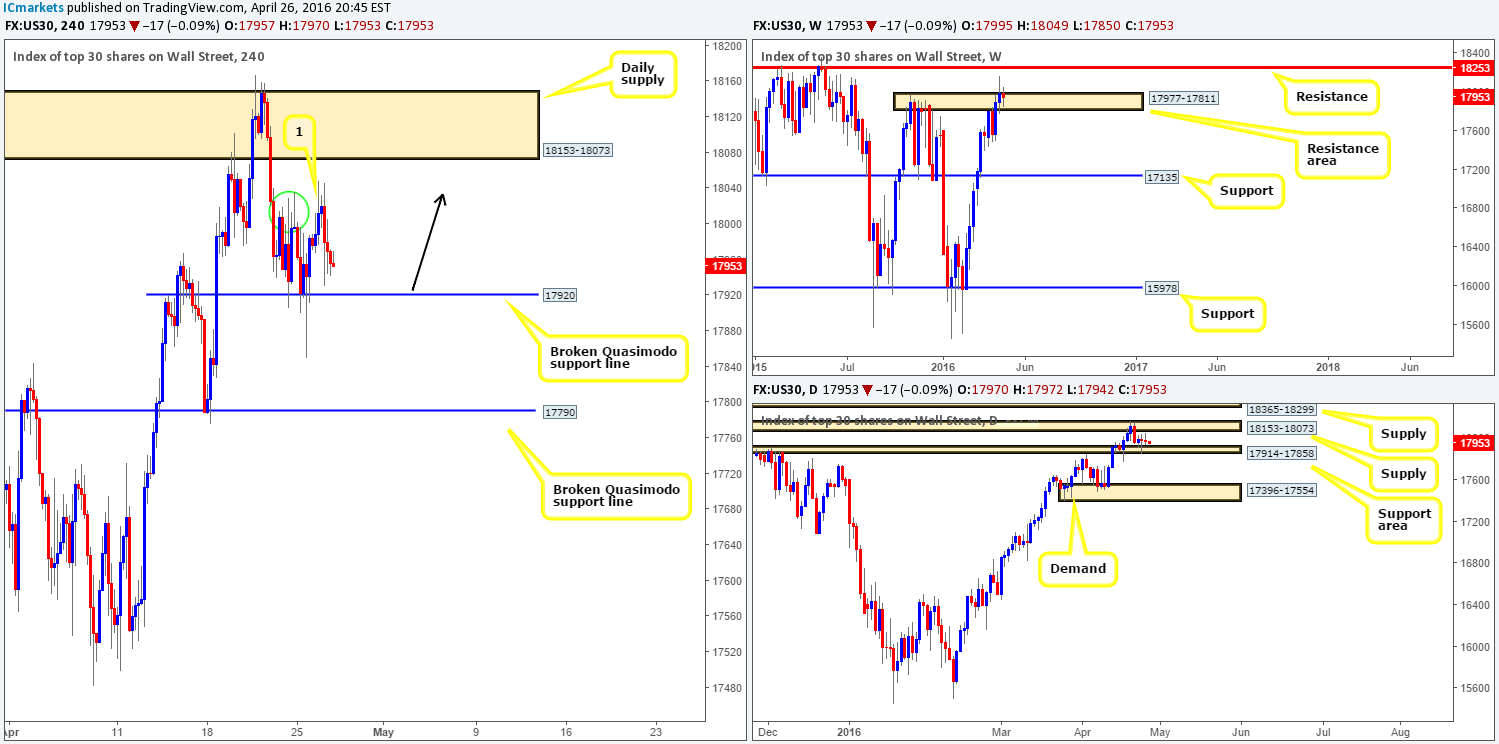
DOW 30:
In a similar fashion to yesterday’s report, we’re going to begin by looking at the weekly chart this morning and working our way down. It is still relatively clear to see that offers positioned around the resistance area at 17977-17811 may be on the verge of drying up. If this proves to be the case, it’s likely we’ll see the DOW visit resistance at 18253 sometime soon. Scrolling down to the daily chart, prices appear to have stagnated between a support area drawn from 17914-17858 and a supply seen overhead at 18153-18073.
Stepping across to the H4 chart, this market remains supported by a broken Quasimodo line given at 17920. What is interesting about the current price structure here, nonetheless, is the recent break above the highs seen marked with a green circle around the 18017 region (see point one). This has likely tapped a truckload of sellers’ stops and also breakout buyers’ buy orders, possibly clearing the path north up to at least the daily supply we just mentioned above. This – coupled with the weekly chart still showing strength to the upside, our team is going to be looking to buy from the aforementioned H4 broken Quasimodo line today. We would advise caution here, however, since fakeouts can and will likely happen! To be on the safe side we’re not placing pending orders at this level. Instead, we’re going to wait for the lower timeframe action to confirm strength resides here before placing our capital at risk (for confirmation techniques, please see the top of this report).
Levels to watch/live orders:
- Buys: 17920 [Tentative – confirmation required] (Stop loss: dependent on where one confirms this level).
- Sells: Flat (Stop loss: N/A).
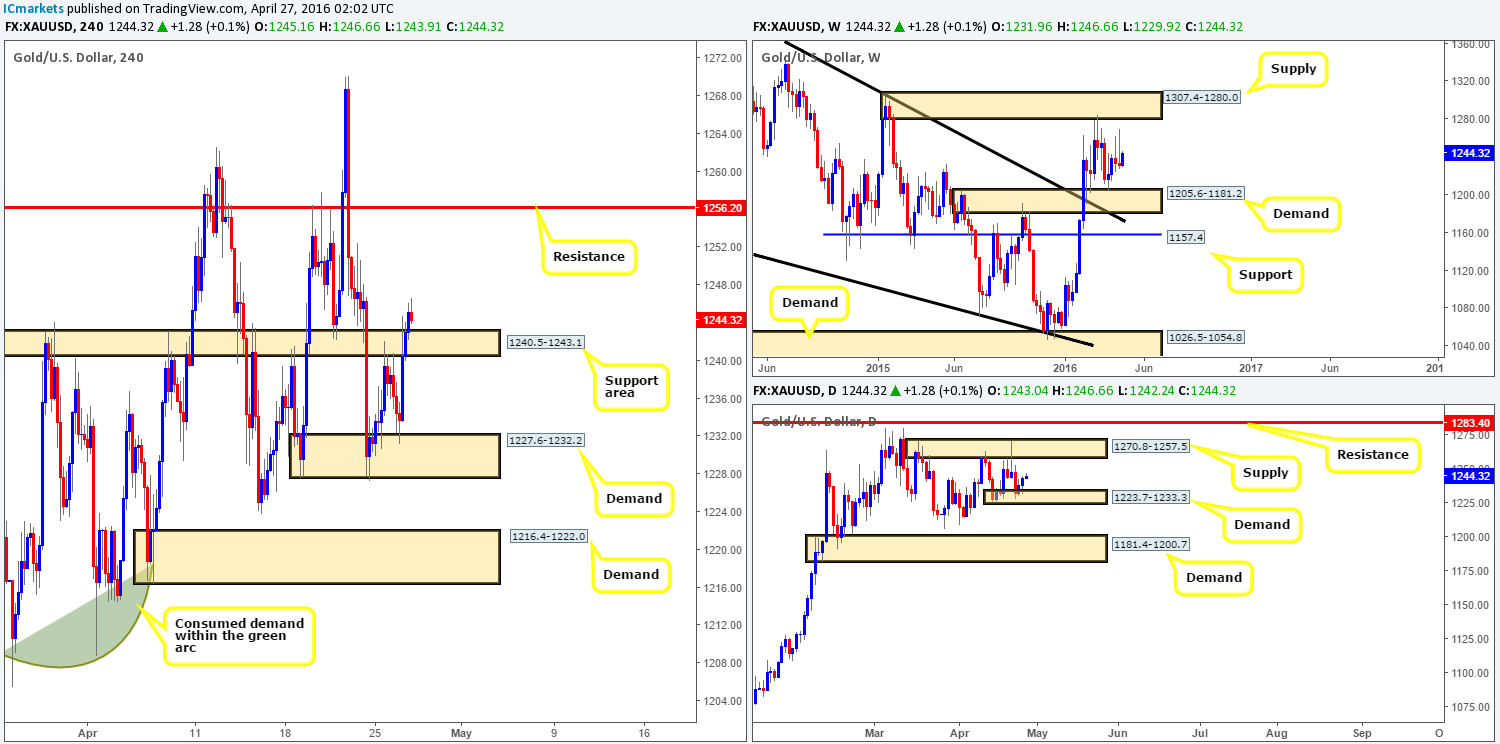
XAU/USD:
Amid broad U.S. dollar weakness (check the U.S. dollar index), the yellow metal was favored during yesterday’s sessions. Gold aggressively bounced from the top-side of H4 demand at 1227.6-1232.2, which, as you can see, saw price engulf a H4 resistance area at 1240.5-1243.1 (now acting support) going into the close. With the path now appearing free for prices to challenge the H4 resistance at 1256.2, and daily action responding relatively well from demand at 1223.7-1233.3, buying this market may be an option today!
Quite simply, we’re going to be looking for price to retest the recently broken H4 resistance area as support, which if holds firm could provide one a sturdy base in which to buy from. Trading from here without lower timeframe confirmation is a possibility due to the higher-timeframe convergence (see above in bold), but we would still prefer to see some sort of buying strength before risking capital. We must also clarify that the target H4 resistance will be our only take-profit zone since it sits directly beneath the daily supply at 1270.8-1257.5 – the next upside target seen on the daily timeframe..
Levels to watch/live orders:
- Buys: 1240.5-1243.1 [Lower timeframe confirmation preferred but not required] (Stop loss: dependent on where one confirms this area).
- Sells: Flat (Stop loss: N/A).