EUR/USD:
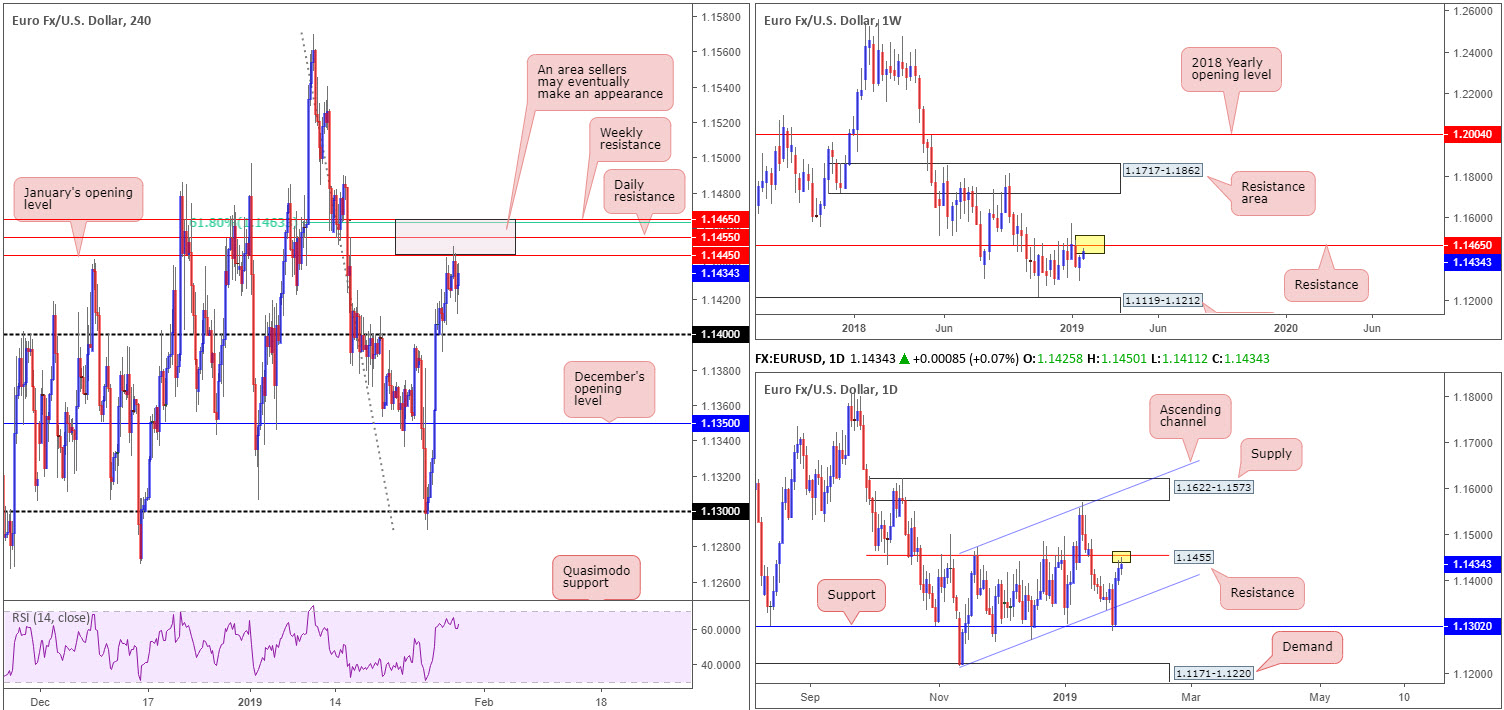
As is marked on the H4 timeframe this morning, the pair crossed swords with January’s opening level at 1.1445 Tuesday. The response from here produced a move to lows of 1.1411 before turning higher amid US hours and reclaiming the day’s lost ground. As emphasized in Tuesday’s briefing, the research team continues to bang its drum concerning levels realised above January’s opening level: nearby daily resistance plotted at 1.1455, a 61.8% H4 Fibonacci resistance at 1.1463 and a weekly resistance at 1.1465 (marked in a subtle shade of red). It might also be of interest to note the H4 RSI indicator is seen hovering just south of its overbought value.
On the data front, Spanish unemployment fell in-line with consensus, while out of the US the conference board consumer confidence index decreased in January, following a decline in December. The Index currently stands at 120.2, down from 126.6 in December.
Areas of consideration:
The 1.1465/1.1445 area, as underlined above, remains a notable sell zone despite yesterday’s reaction, according to our technical studies. The levels included within this base are prominent and incorporate all three timeframes, therefore still worthy of a place on the watch list.
Having seen sell orders triggered off January’s opening level, though, a move deeper into 1.1465/1.1445 is likely in store. For conservative traders sensing the area is open to a fakeout, waiting for additional bearish candle confirmation to form is an option. Not only would this provide entry/exit parameters to work with, it also displays seller intent.
Today’s data points: German Prelim CPI m/m; US ADP Non-Farm Employment Change; FOMC Statement, Federal Funds Rate and Press Conference.
GBP/USD:
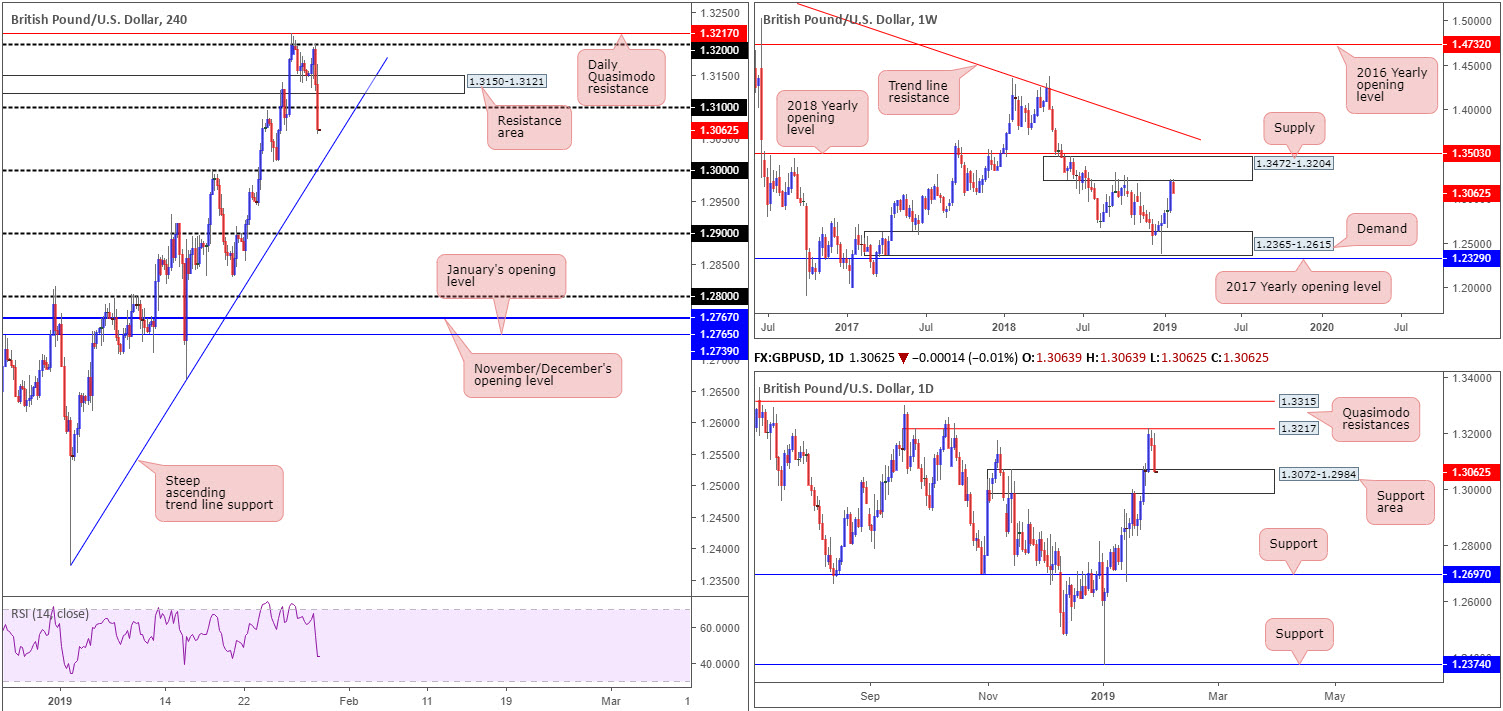
H4 movement, after rebounding from its support area priced in at 1.3150-1.3121, endeavoured to regain 1.32 status Tuesday, though failed in dramatic fashion. The British pound, amid US trading hours, yielded ground to the US dollar, as the pair shrivelled over plan B Brexit concerns. UK lawmakers rejected the key Cooper’s amendment B, along with amendments A, O, G, J also rejected by Parliament.
From a technical viewpoint, the H4 candles, in one fell swoop, overthrew the 1.31 handle, consequently uncovering nearby steep trend line support (taken from the low 1.2373), shadowed closely by the key figure 1.30. Viewing the market from the weekly timeframe, we can see weekly price action engaging with the lower boundary of supply drawn from 1.3472-1.3204. Tailed closely by a 2018 yearly opening level at 1.3503, the current supply, which already capped upside successfully once already in October 2018, houses a healthy chance of repeating history here. A closer reading of the market, however, reveals recent selling pressured price action towards a support area coming in at 1.3072-1.2984. This area fuses nicely with the steep H4 trend line support mentioned above, as well as the 1.30 handle.
Areas of consideration:
In essence, we have weekly sellers digging for lower ground from supply, daily traders considering longs from a support area and H4 players potentially looking to sell the recent breakout sub 1.31.
Technical signs favour further selling, according to current price action, at least until we shake hands with the H4 steep trend line support. A retest of 1.31 as resistance, therefore, is an idea potentially worth exploring. Having seen daily price greet a support area, however, despite weekly supply, traders are urged to trade 1.31 with caution as fakeouts are common viewing around psychological numbers. Waiting for lower-timeframe candlestick confirmation to form is recommended before pulling the trigger (entry and stop parameters can be defined according to the candlestick structure).
Today’s data points: UK Net Lending to Individuals m/m; US ADP Non-Farm Employment Change; FOMC Statement, Federal Funds Rate and Press Conference.
AUD/USD:
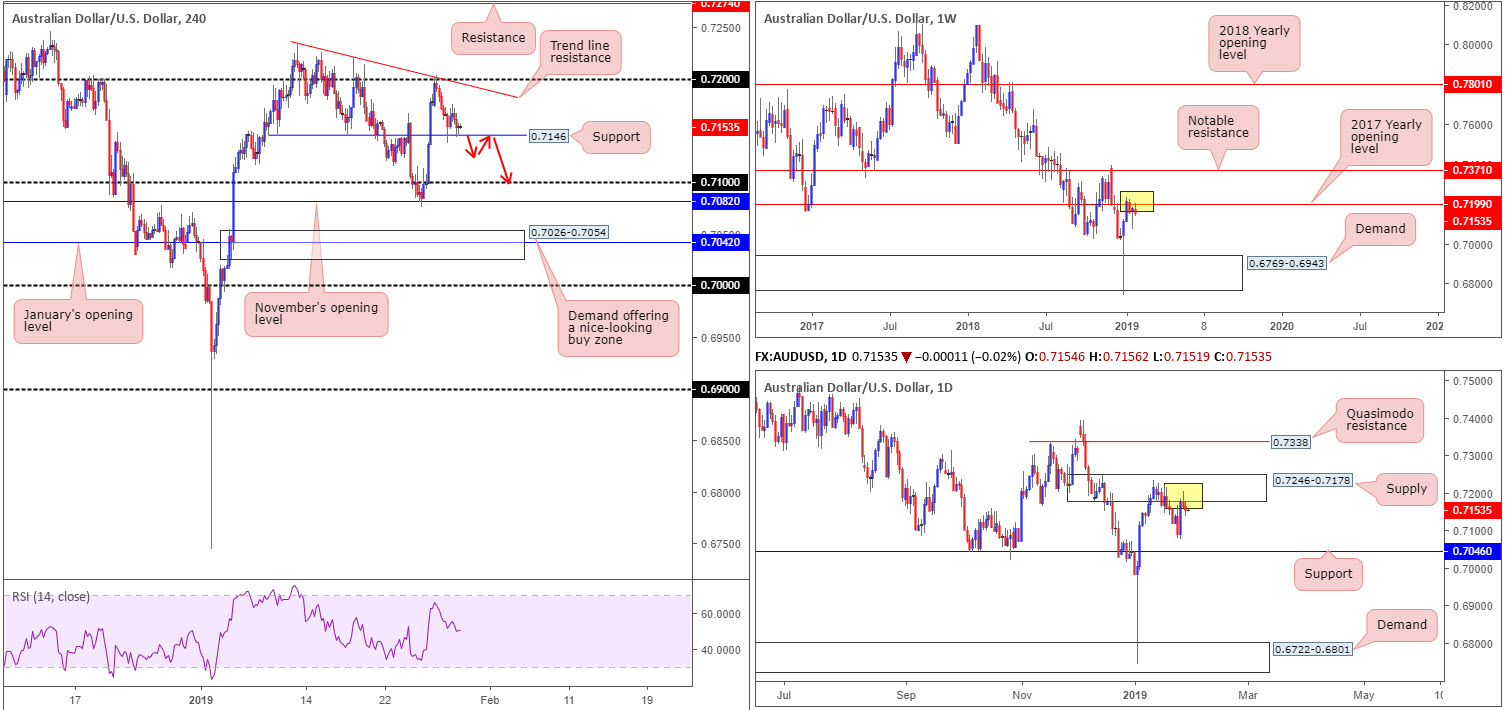
The Australian dollar surrendered further ground to its US peer Tuesday, following Monday’s picture-perfect reaction off the 0.72 handle on the H4 timeframe, along with its merging trend line resistance (extended from the high 0.7235).
Local H4 support at 0.7146 did a superb job in containing further loss yesterday, holding price action higher in the early hours and once again during US trade. For folks who read recent reports you may recall the reason behind selecting 0.72 as a possible resistance worth fading was simply down to its connection with higher-timeframe structure. 0.72 represents weekly resistance in the shape of the 2017 yearly opening level at 0.7199, while 0.72 is also tucked within the limits of daily supply fixed at 0.7246-0.7178.
Well done to any of our readers who remain short, despite the current H4 support in play. Stop-loss orders should be parked at breakeven with a portion of your position liquidated.
Areas of consideration:
Assuming the higher-timeframe analysis is accurate, a H4 close beyond the current H4 support could still be on the cards, targeting a move towards at least the 0.71 handle, followed closely by November’s opening level at 0.7082. Do bear in mind, though, selling beyond this point is certainly possible, given the next obvious higher-timeframe support does not come into view until reaching 0.7046 on the daily timeframe.
With this in mind, as underscored in yesterday’s briefing, traders might want to pencil in a possible intraday short play sub 0.7146 today. A H4 close below this number followed up with a retest as resistance (preferably forming a lower-timeframe bearish candlestick pattern as this will help provide entry/stop parameters) would, given the overall picture of the market right now, likely be sufficient enough to draw in further sellers and push lower.
Today’s data points: US ADP Non-Farm Employment Change; FOMC Statement, Federal Funds Rate and Press Conference.
USD/JPY:
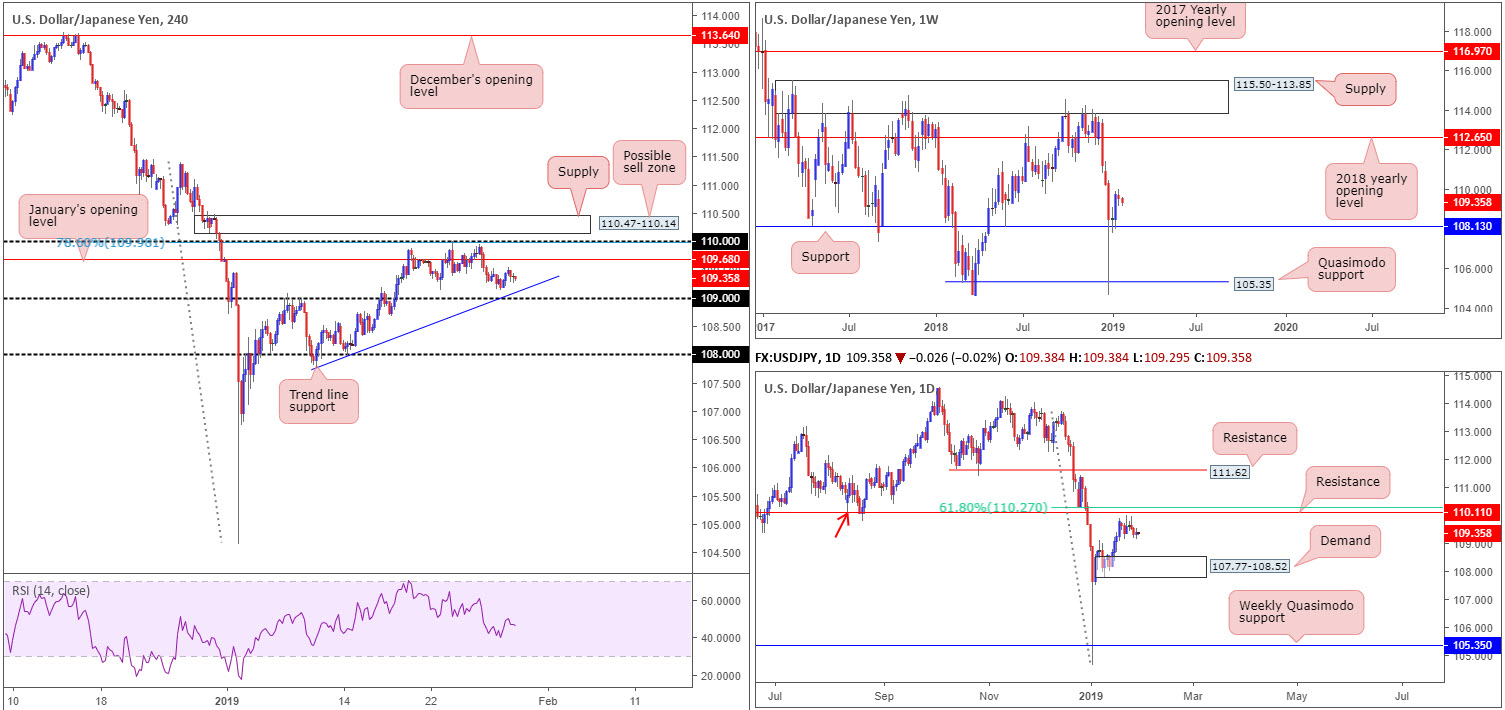
Since the beginning of the week, trading volume has embodied somewhat of a subdued state. Meandering just north of a H4 trend line support (extended from the low 107.77 and positioned close by the 109 handle), price action has January’s opening level at 109.68 to target as initial resistance, trailed closely by the 110 handle (aligns with a 78.6% Fibonacci resistance value at 109.98) and then a H4 supply tucked away at 110.47-110.14.
From the weekly timeframe, the pair is visibly supported by 108.13. The research team notes a relatively clear path to the upside from 108.13 until connecting with the 2018 yearly opening level at 112.65. Should the market spin south, nonetheless, Quasimodo support at 105.35 is the next level on the hit list to be aware of.
Contrary to weekly levels, as highlighted in a number of earlier reports last week, daily price action is seen consolidating gains ahead of resistance coming in at 110.10 that’s shadowed closely by a 61.8% Fibonacci resistance value at 110.27. 110.10 is essentially a Quasimodo support-turned resistance (red arrow). On the condition the unit climbs above the noted resistances, as the weekly timeframe suggests, another layer of resistance is realised at 111.62. A downside move, on the other hand, has demand at 107.77-108.52 in sight.
Areas of consideration:
Outlook remains unchanged due to lackluster movement.
The 109 handle, in light of it aligning closely with a local trend line support mentioned above is worthy of attention for a bounce today. However, the research team urges traders to consider waiting for additional candle confirmation (entry/stop levels can be defined according to the selected pattern) to form before pulling the trigger due to the threat of a fakeout (common viewing at round numbers).
Apart from the 109 handle, eyes also remain on the H4 supply positioned at 110.47-110.14. A push above 110 will not only trip stop-loss orders from traders attempting to fade the psychological mark, which, when filled, will become buy orders to sell in to, breakout buyers will also likely attempt to join the movement. This offer of liquidity to sell to, coupled with daily resistance seen plotted at 110.10, is likely enough to draw in attention and bring price action lower from the noted H4 supply.
Traders who feel the need to trade the H4 supply based on candle confirmation, waiting for a bearish formation to materialise will certainly add weight to a possible rotation lower. Traders who believe the H4 supply and daily resistance is enough evidence to draw sellers’ attention, however, will likely enter short at 110.14 with stop-loss orders planted just north of 110.47. Once, or indeed if, the H4 candles reclaim 109.68 to the downside out of 110.47-110.14, traders can think about reducing risk to breakeven and taking partial profits off the table.
Today’s data points: US ADP Non-Farm Employment Change; FOMC Statement, Federal Funds Rate and Press Conference.
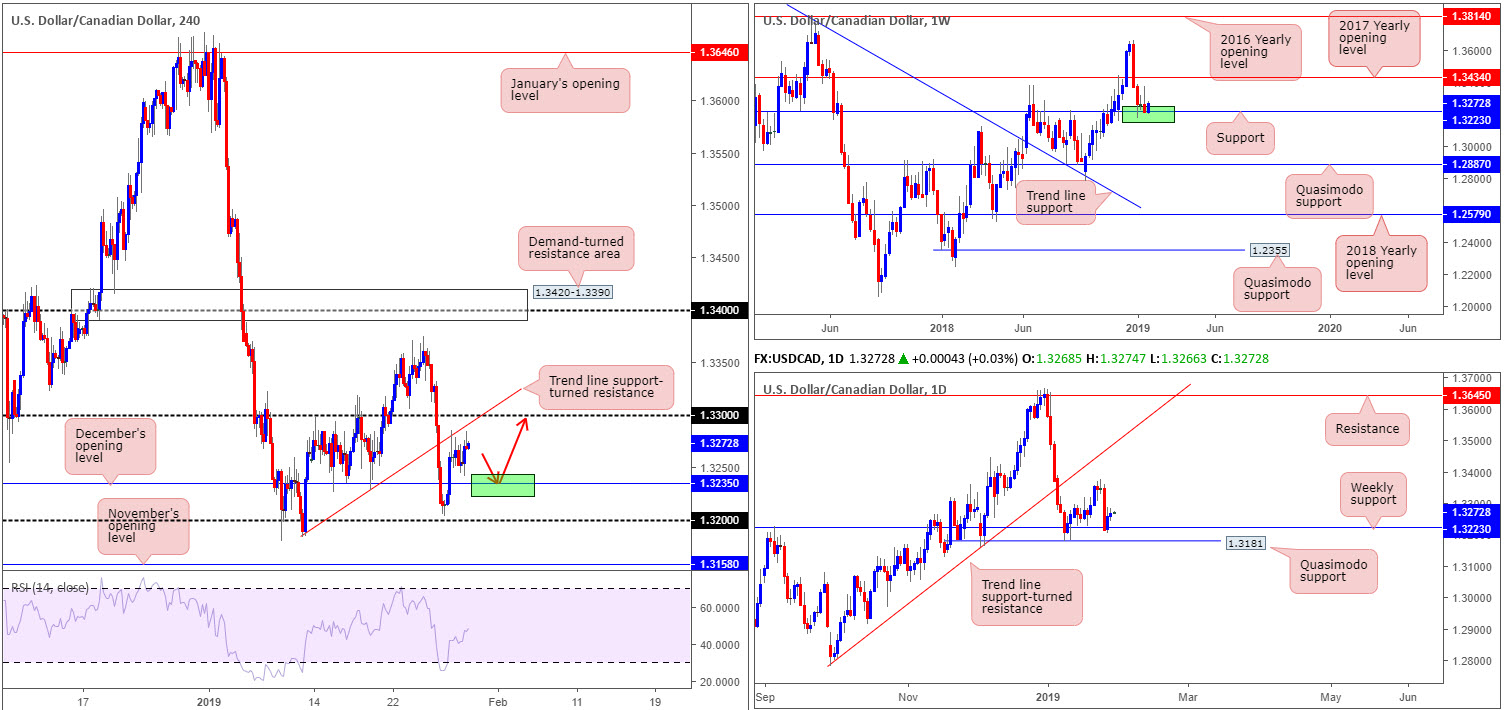
USD/CAD:
In similar fashion to the USD/JPY, activity on the USD/CAD has been somewhat lacklustre, following Monday’s action challenging a H4 trend line support-turned resistance (etched from the low 1.3183).
Supporting upside is weekly support priced in at 1.3223. This level, as you’ll note from the chart, boasts historical significance, meaning a response from the level was highly likely on the cards. Further buying from this angle could eventually advance as far north as the 2017 yearly opening level at 1.3434.
Areas of consideration:
Outlook remains unchanged due to lacklustre movement.
The move off the current H4 trend line support-turned resistance is unlikely to offer much in terms of downside movement, given we have nearby support on the H4 at 1.3235 (December’s opening level) and weekly support in play at 1.3223.
According to our technical studies, the ducks are being lined up for a possible retest play off 1.3235, targeting 1.33 as an initial upside target (red arrows). To avoid being whipsawed out of a trade (should the H4 candles ignore 1.3235 and press towards 1.32), consider waiting for a bullish candlestick signal to take shape; it’ll serve as a way of identifying buyer interest and provide traders entry/stop levels to trade.
Today’s data points: US ADP Non-Farm Employment Change; FOMC Statement, Federal Funds Rate and Press Conference.
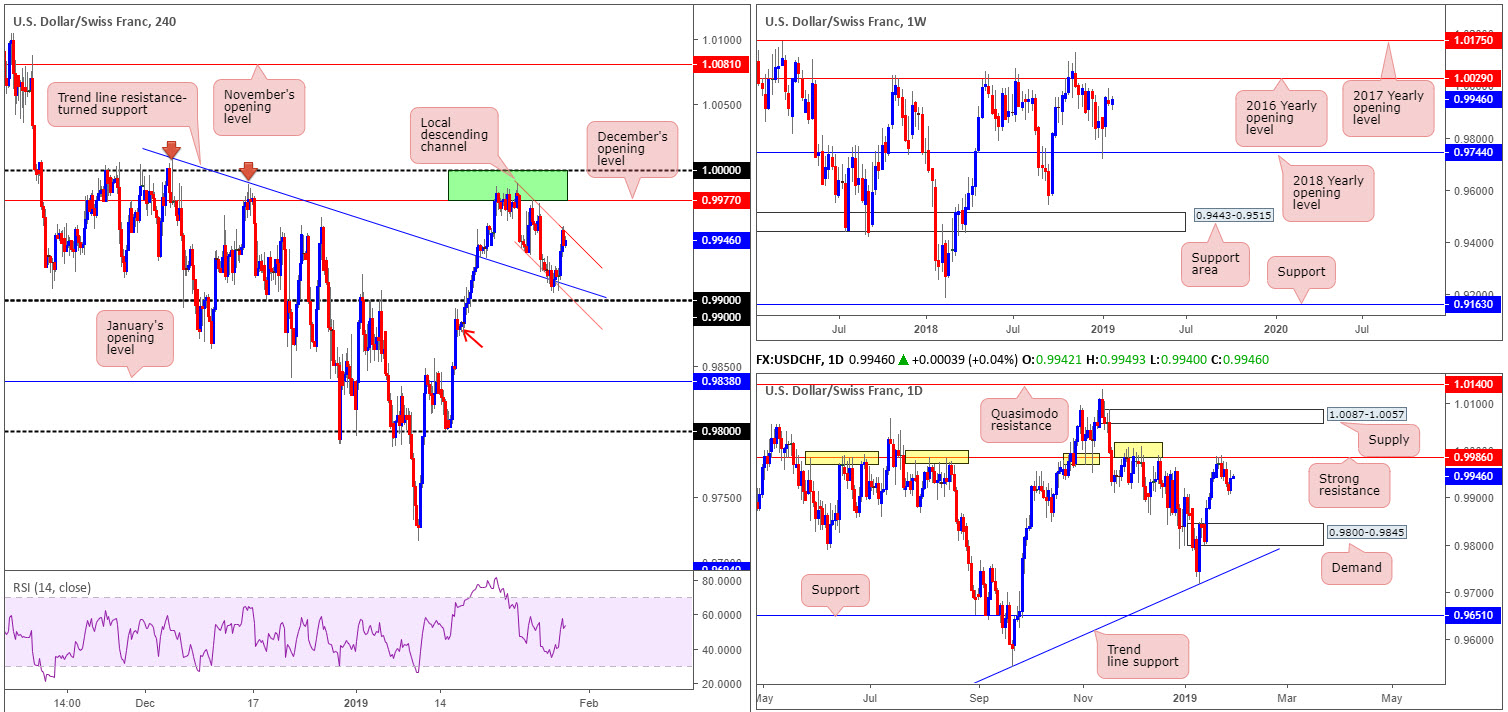
USD/CHF:
A modest recovery observed over on the US dollar index, typically labelled ‘DXY’, appears to be the primary driver behind Tuesday’s USD/CHF advance. In addition to this, though, the H4 timeframe drew in additional support from a trend line resistance-turned support (extended from the high 1.0008), which merged with a local H4 channel support (taken from the low 0.9938) and happens to be sited a handful of pips above 0.99. What’s also noteworthy from a technical standpoint is yesterday’s advance filled the current channel formation, pulling the H4 candles towards its upper limit, which is currently capping price, as we write.
In spite of recent buying, we feel this could simply be another pullback before continuing to explore lower levels. The rationale behind this stems largely from the higher-timeframe picture, though having resistance pulled into the picture from the current H4 channel formation is a bonus.
Factoring in weekly movement, we can visibly see a rather attractive bearish pin-bar pattern formed last week, just south of a 2016 yearly opening level at 1.0029. This has likely attracted some candlestick enthusiasts into the market.
In support of the weekly timeframe’s bearish candlestick formation, daily price is also fading notable resistance fixed at 0.9986. The history surrounding this level is particularly appealing (yellow), with the next support target on this scale not emerging until demand printed at 0.9800-0.9845.
Areas of consideration:
On account of the bearish H4 candle off the current H4 channel resistance, alongside the technical reading of the bigger picture, a sell at current price could be something to consider with stop-loss orders tucked above the channel frame. Ultimately, the next downside target from this section falls in around 0.99 that will likely merge with the opposing channel support from the H4 timeframe.
Traders considering a long in this market, should we puncture the current channel pattern, is difficult. We see nearby resistance in the form of December’s opening level at 0.9977, followed by daily resistance at 0.9986 and 1.0000 (parity) on the H4. Structure, as you can see, is clearly restricted to the upside.
Today’s data points: US ADP Non-Farm Employment Change; FOMC Statement, Federal Funds Rate and Press Conference.
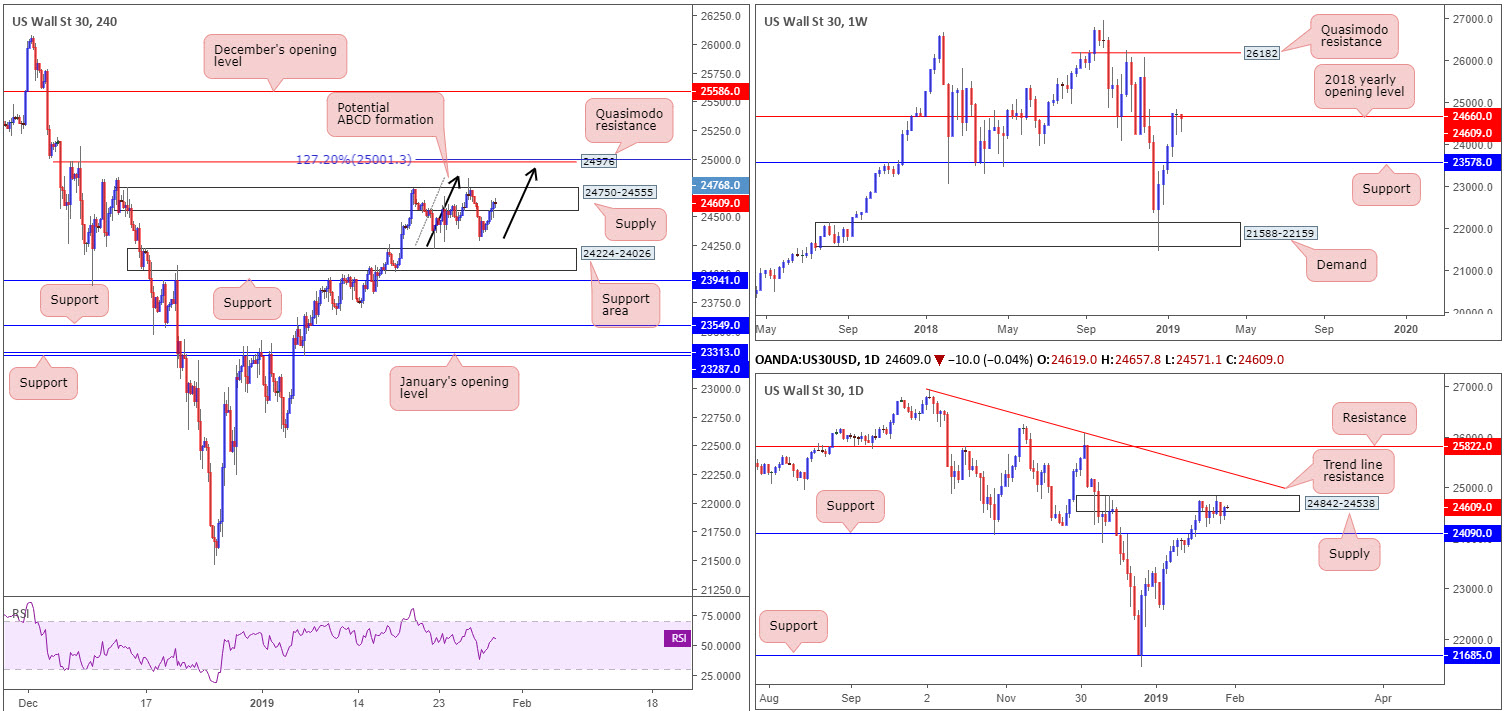
Dow Jones Industrial Average:
Since the 18th of January, US equities have been sandwiched within a tight range between a H4 supply zone coming in at 24750-24555 and a H4 support area at 24224-24026. Areas outside of this range are seen at 24976: a H4 Quasimodo resistance level and 23941: a H4 support level.
The top edge of the current H4 range has experienced most of the action since its foundation, and even suffered a breach to the upside Friday just gone. Judging by candlestick strength, the buyers appear to have the upper hand at the moment. Another key point worth making on the H4 timeframe is the possible ABCD 127.2% pattern (black arrows) that aligns beautifully with the H4 Quasimodo resistance mentioned above at 24976 (25001).
The outlook on the bigger picture reveals weekly movement is testing the 2018 yearly opening level at 24660. Against the backdrop of weekly structure, there also exists a daily supply zone at 24842-24538, which could eventually pressure the unit towards nearby support coming in at 24090. Note 24090 is effectively positioned within the lower limits of the current H4 support area mentioned above at 24224-24026.
Areas of consideration:
Assuming buyers remain in the driving seat today, a test of the H4 Quasimodo resistance mentioned above at 24976 is of interest, thanks to it merging closely with a H4 ABCD pattern. Should this come to fruition, a marginal fakeout above the two higher-timeframe resistances in play will be observed.
Traders interested in shorting 24976 have two options, according to our reading. Either short at 24976 and position stops above the head of the Quasimodo (25111), and target 24750-24555, as this will be acting support at that point, or wait for additional candlestick confirmation to form and enter based on the structure’s rules of engagement.
Today’s data points: US ADP Non-Farm Employment Change; FOMC Statement, Federal Funds Rate and Press Conference.
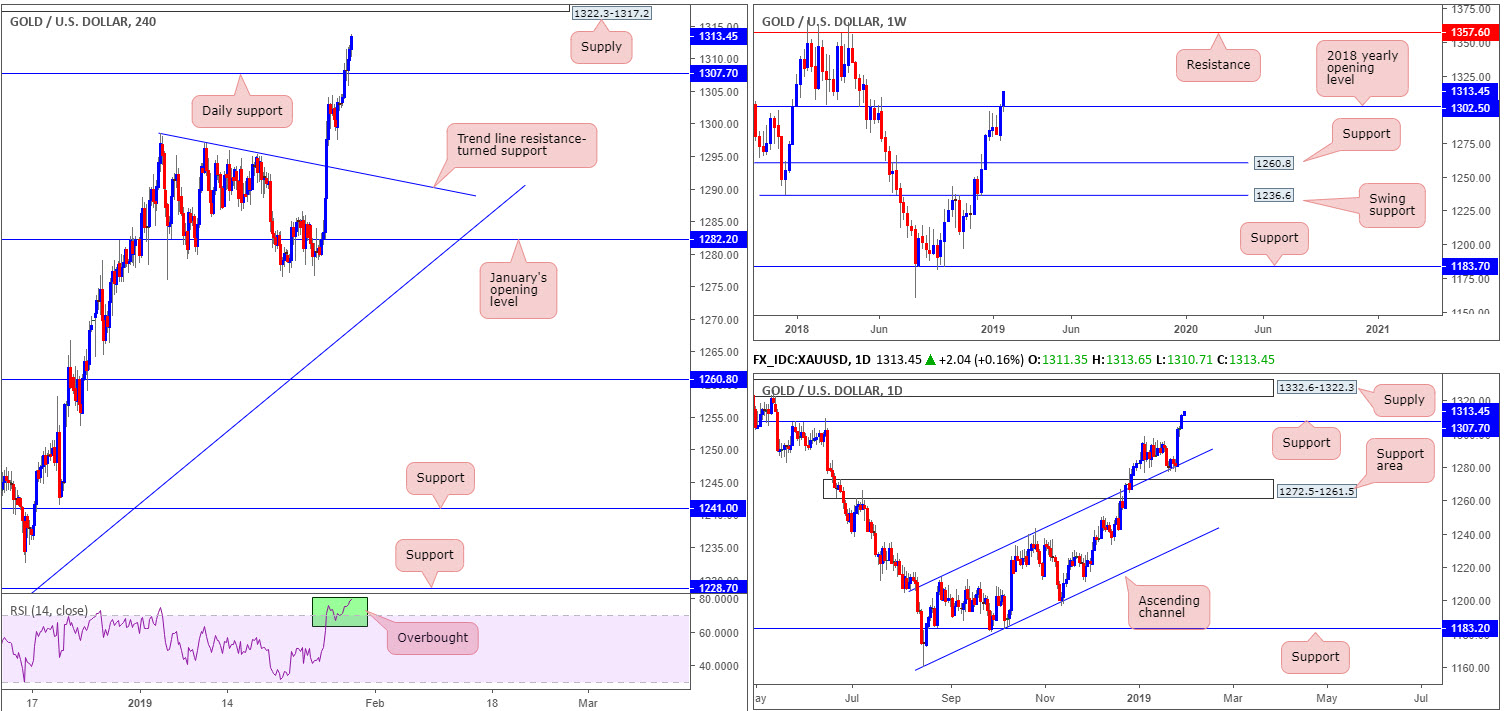
XAU/USD (GOLD):
Coming in from the top this morning, traders likely acknowledge weekly price recently overthrew its 2018 yearly opening level at 1302.5. According to this timeframe, active sellers are likely limited until the precious metal crosses paths with notable resistance priced in at 1357.6.
Closer analysis shows daily price also consumed resistance at 1307.7 (now acting support), consequently exposing nearby supply coming in at at 1332.6-1322.3. Note this supply area has already held price action lower in early May of 2018, proving its worth as a base.
Further down on the curve, the H4 candles resembles pretty much the same picture as the daily timeframe, though the next upside target on the H4 scale falls in at supply drawn from 1322.3-1317.2 (glued to the lower edge of the current daily supply). Traders may also want to note the H4 RSI indicator is seen trading deeply within overbought territory.
Areas of consideration:
All three timeframes point to further buying today, at least until we arrive at the H4 supply area mentioned above at 1322.3-1317.2. With this in mind, traders may want to consider entering long on any retest seen at daily support fixed from 1307.7 (preferably on the back of a H4 bullish candlestick pattern [entry/stop levels can be defined according to this structure]), targeting the current H4 supply, followed then by 1322.3 (the lower edge of daily supply) as the next upside objective.
The use of the site is agreement that the site is for informational and educational purposes only and does not constitute advice in any form in the furtherance of any trade or trading decisions.
The accuracy, completeness and timeliness of the information contained on this site cannot be guaranteed. IC Markets does not warranty, guarantee or make any representations, or assume any liability with regard to financial results based on the use of the information in the site.
News, views, opinions, recommendations and other information obtained from sources outside of www.icmarkets.com.au, used in this site are believed to be reliable, but we cannot guarantee their accuracy or completeness. All such information is subject to change at any time without notice. IC Markets assumes no responsibility for the content of any linked site. The fact that such links may exist does not indicate approval or endorsement of any material contained on any linked site.
IC Markets is not liable for any harm caused by the transmission, through accessing the services or information on this site, of a computer virus, or other computer code or programming device that might be used to access, delete, damage, disable, disrupt or otherwise impede in any manner, the operation of the site or of any user’s software, hardware, data or property.